The document summarizes work to model the highly modified flow network of the Guadalupe River Delta through field data collection and hydrodynamic modeling. Key points:
1) Field work was conducted to collect bathymetry data and map the complex channel network altered by diversions and restrictions using lidar and channel extraction tools.
2) A high-resolution hydrodynamic model called Frehd will be used to understand current conditions and inform management, representing features as boundary conditions on a 10m grid coarsened from lidar.
3) Sensors have been installed throughout the system to monitor inputs, outputs, and junctions to verify the Frehd model, which will focus on recovering this field-collected data.
February 2022 TAGD Business Meeting
Study Results: Delineating Injection Well Buffer Zones in Brackish Aquifers
Juan Acevedo, BRACS Hydrologist, TWDB Jack Sharp, Professor Emeritus in Geology, UT- Austin
February 2022 TAGD Business Meeting
Study Results: Delineating Injection Well Buffer Zones in Brackish Aquifers
Juan Acevedo, BRACS Hydrologist, TWDB Jack Sharp, Professor Emeritus in Geology, UT- Austin
Presented by Charlotte MacAlister, Birhanu Zemadim, Teklu Erkossa, Amare Haileslassie, Dan Fuka, Tammo Steenhuis, Solomon Seyoum, Holger Hoff, Kinde Getnet, and Nancy Johnson to the Nile Basin Development ChallengeScience and Reflection Workshop, Addis Ababa, 4-6 May 2011
Presented by Birhanu Zemadim (IWMI) and Emily Schmidt (IFPRI) at the Nile Basin Development Challenge (NBDC) Science Workshop, Addis Ababa, Ethiopia, 9–10 July 2013
DSD-INT 2017 Groundwater in Global Hydrology - BierkensDeltares
Presentation by Marc Bierkens (Utrecht University) at the iMOD International User Day, during Delft Software Days - Edition 2017. Tuesday, 31 October 2017, Delft.
Preliminary Technical Evaluation of Three Reports by U.S. Environmental Prote...LPE Learning Center
http://www.extension.org/72802 The Yakima Valley is a large agricultural area where there are multiple potential sources of nitrate in groundwater. Potential sources are intermingled, i.e., homes with septic systems are on the same properties as the dairies or adjacent to farms and/or dairies. In 2012, Region 10 of the US Environmental Protection Agency undertook a study to source track and identify nitrogen sources in the Yakima River Basin as part of an enforcement effort focusing on dairies. EPA position was that the targeted dairies did not properly apply nutrients to land application fields at agronomic rates, resulting in groundwater contamination. The study area is underlain by 3 aquifers, a shallow perched aquifer likely related to irrigation return flows, an alluvial aquifer and an underlying basalt aquifer. The three aquifers are hydrologically connected either through natural pathways or through wells completed into more than one aquifer. Because none of the potential sources are isolated, source tracking requires an in-depth knowledge of aquifer properties such as aquifer thickness, groundwater flow direction, hydraulic conductivity, and vertical leakance in addition to understanding localized effects of ditches, drains and production wells on groundwater flow. EPA focused on groundwater chemistry, assuming that indicators such as pesticides and other trace organic compounds would tie the groundwater nitrate to a specific source. EPA’s study failed to yield clear indicators pointing to specific sources and did not collect hydrologic data for its 2012 report to gain a detailed understanding of aquifer properties. This presentation will address how to accurately characterize the hydrogeology below dairy production areas and land application fields, and how to proactively manage nutrients to protect dairies from unsubstantiated enforcement actions.
A REVIEW ON RESERVOIR SEDIMENTATION STUDIES USING SATELLITE REMOTE SENSING TE...ijiert bestjournal
Sedimentation in the reservoir gradually reduces it s storage capacity. By keeping a check on the sedimentation and by providing control measures for the same,the reservoir life can be maintained. Uj jani dam was constructed for irrigation,water supply an d power generation schemes. It lies in Solapur dist rict which is a drought prone area. This makes Ujjani a socially and economically significant project for t he state. In the present study,reservoir sedimentatio n for Ujjani reservoir is assessed for monitoring p urpose. Two techniques namely Satellite Remote Sensing Tech nique (SRST) and mathematical modeling using HEC RAS,were used in the study for estimating sedi mentation. Owing to advantages like low cost,time saving,less manpower requirement,accuracy in esti mation and capability of carrying out past surveys,the Satellite Remote Sensing Technique is gaining impor tance over the time consuming and high cost conventional hydrographic surveys. The water spread areas for different reservoir levels were delineat ed from the satellite images of Ujjain Reservoir using ARC GIS software. Volume between two water levels was calculated using prismoidul formula. The presen t volume of reservoir was compared with the initial volume during impoundment of reservoir. This gave t he loss of volume which was due to sedimentation.
The groundwater is one of leachate generation components in landfills. So, the control of
groundwater level below the base level of landfills is very important for both of decreasing the rate of
leachate generation and minimizing the potential for groundwater contamination. The main aim of this study
is how to control on the pollution problem in landfill site using an improved dewatering system. In this
study, the use of double drainage pipes as a protecting system to control on the pollution in landfill pattern
in case of rising the groundwater level are obtained. Flow patterns for models representing dewatering of
groundwater flow outward landfill site that has geo-membrane liner using the double drainage pipes are
investigated. The double drainage pipes are designed with various parameters for each model. All
investigated models are founded on isotropic soil. Numerical model was used to construct the flow pattern
(flow net) for the models. The solution was presented to study the effect of the depth and the distance
between the single drainage system on the depression of groundwater level as well as the influences of
horizontal and vertical distances between the perforated pipes in double drainage system were achieved.
Lab 06_ FLUVIAL PROCESSES AND LANDSCAPESLAB 06 FLUVIAL PR.docxVinaOconner450
Lab 06_ FLUVIAL PROCESSES
AND
L
AND
SCAPES
LAB 06: FLUVIAL PROCESSES
AND
L
AND
SCAPES
Note:
Please refer to
the
GETTING STARTEDmodule to learn how to maneuver through,
and
how to answer
the
lab
question
s, in
the
Google Earth (
) component.
KEY TERMS
You should know
and
underst
and
the
following
terms
:
Alluvial fan
Drainage divide
Oxbow Lake
Basin
Drainage pattern
Sinuosity
Braided streams
Entrenched me
and
er
Stream discharge
Cutbanks
Hydrograph
Stream order
Delta
Me
and
ering river
Water
shed
Drainage density
Me
and
er scar
LAB LEARNING OBJECTIVES
After successfully completing this module, you should be able to do
the
following
tasks:
·
Describe
the
concepts of sub-basins
and
water
sheds
·
Identify different human
water
uses of a river
·
Construct a stream order
for
a river system
·
Compute drainage density of a given basin
·
Identify drainage patterns of river networks
·
Explain how braided rivers
and
me
and
ering rivers are
for
med
·
Identify
the
physical features common to a me
and
ering river system
·
Describe
the
physical conditions necessary to
for
m alluvial fans
INTRODUCTION
This module examines fluvial processes
and
l
and
scapes.
Topic
s include
water
sheds, drainage patterns
and
densities, stream order, me
and
ering
and
braided streams,
and
alluvial fans. While
the
se
topic
s may appear to be disparate, you will learn how
the
y are inherently related.
The
modules start with four opening
topic
s, or vignettes,
which
are found in
the
accompanying Google Earth file.
The
se vignettes introduce basic concepts of fluvial processes
and
l
and
scapes. Some of
the
vignettes have animations, videos, or short articles that will provide ano
the
r perspective or visual explanation
for
the
topic
at h
and
. After
read
ing
the
vignette
and
associated links, answer
the
following
question
s. Please note that some links might take a while to download based on your Internet speed.
Expand
the
INTRODUCTION
folder
and
the
n
select
Topic
1:
Introduction
Read
Topic
1:
Introduction
Question
1:
Which
of
the
following
is a
reason
for
the
location
select
ed
for
the
first
English
settlement
in
the
New
World
,
Jamestown
,
VA?
A.
Prime
agricultural
l
and
B.
On
the
advice
from
the
Native
Americans
C.
Deep
water
port
D.
The
l
and
was
al
read
y
cleared
Read
Topic
2: Rivers of Life
Question
2:
If our ability to predict floods has improved significantly, why does economic loss continue to rise? (Check all that apply).
A.
Increased urbanization
B.
Increased population
C.
Increased development along coasts
D.
Increased real estate values
Read
Topic
3: Rivers of
Was
te
Question
3:
What are potential outcomes or conditions resulting
from
too much nitrogen running off
from
agricultural
fields? (Check all that apply).
A.
Eutrophication of
water
bodies
B.
Decrease in crop production
C.
Contamination of ground
wate.
Hydrological Application of Remote – Sensing and GIS for Handling of Excess R...IDES Editor
A GIS based hydrological analysis has been carried
out to explore the possibility of diverting storm runoff
generated from the upper catchment safely through a canal
system constructed at the foothill to avoid flooding at
downstream. The study area consisted of Kalapahar-Udyachal
hills (5.38 km sq) in the Kahilipara- Odalbakra area, situated
in the city of Guwahati, Assam. The Digital Elevation Model
(DEM) of the study area was developed from the Survey of
India(SOI) toposheet (1972) using Arcgis software. Watershed
delineation and derivation of required topographic parameters
for for calculating the peak discharge from different
watersheds were done with the help of the generated DEM.
Based on the hydrological analysis, means of safe diversion
of runoff water from hillocks was found out and canal
design of varying geometry capable of handling the peak
discharge suggested.
Numerical modeling in support of the characterization and remediation of impacted sediments can be a challenging task, particularly in environments where multiple physical processes influence sediment fate and transport. The interaction of various controls is particularly complex in estuarine settings, where riverine input, water levels, waves, and other coastal processes combine to create a seasonally dynamic environment. Modeling of such environments requires a comprehensive and integrated approach such that the effects of each process can be assessed individually, as these processes can be allowed to interact to reproduce the natural environment as faithfully as possible
Approach and Activities
This contribution describes the development and calibration of an integrated Delft3D numerical model that includes flow, sediment transport, wave processes, and vegetation. The model boundary conditions are based on data collected during a comprehensive field program. Field data were also used to calibrate various model input parameters (such as bed and vegetation roughness). The model was used to understand erosion and deposition during both low and high flow regimes, and thus to aid in understanding important controls on sedimentary dynamics during these predominant regimes.
Results and Lessons Learned
The integrated numerical model predictions capture important sedimentation, erosion, velocity, and water level patterns. Model predictions indicate that during periods of low riverine input, velocity patterns and sediment transport associated with periodic water level changes dominate. During riverine flood conditions flow and sedimentation patterns are controlled by the river itself. Integrated modeling of this setting, including calibration to field data provides a valuable tool for assessment of future conditions, and thus for remediating impacted sediments.
Similar to carothers_ewriPoster_whole_final.compressed (20)
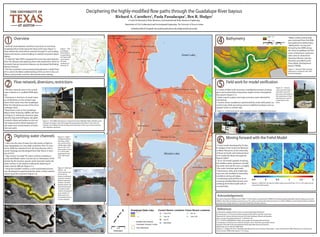
1. Deciphering the highly-modified flow paths through the Guadalupe River bayous
Richard A. Carothers1
, Paola Passalacqua1
, Ben R. Hodges1
1-Center for Research in Water Resources, Environmental and Water Resources Engineering,
Department of Civil, Architectural and Environmental Engineering, The University of Texas at Austin
(richardcarothersUT@gmail.com, paola@austin.utexas.edu, hodges@mail.utexas.edu)
Field work for model verification
Bathymetry
Digitizing water channels
Flow network,diversions,restrictions
Overview
This work is funded by TWDB account 1400011710.The authors would thank the TWDB for the funding and provided data.Likewise,thanks go out to the
GBRA for data,field consultation,and land access.The authors would also like to thank D.Alonso,G.Colville,D.Williams,and K.Kriegel for field consultation
and land access.Finally,thanks to C.Van Dyk for field help with data collection.
1
2
3
4
6
• The flow network seen in the central
map is based on a modified NHD data-
set.
• Diversions in the form of canals (seen
as red flowlines on the central map)
divert fresh water from the Guadalupe
River for industrial use east of the Victo-
ria Barge Canal.
• Restrictions such as the Guadalupe
Blanco River Authority (GBRA) salt barri-
er (Figure 2),salt barrier diversion gate,
and the Hog and Goff bayou salt gates
(circled in black and yellow on the cen-
tral map) prevent inland migration of
salt water and contamination of indus-
trial use water.
• Water surface extent poly-
gons removed from the DEM
and replaced by bathymetry.
• Bathymetric surveys per-
formed by the GBRA along
the lower Guadalupe and the
series of diversion canals pro-
vide some in-channel ba-
thymetry.Mission Lake ba-
thymetry provided by the
Texas Water Development
Board (TWDB).
5
Moving forward with the Frehd Model
• Frehd model developed by Dr.Ben
R.Hodges at the Center for Research
in Water Resources at the University
of Texas at Austin and used previous-
ly to model the fluxes through the
Nueces Deltad
• 2D or 3D model capable of solving
the shallow water equations simulat-
ing water and salt flux over a roughly
10m scale Cartesian grid mesh.
• Restrictions,sinks,and smaller fea-
tures are sub-modeled as boundary
conditions along cell edges.
• Continuing work will focus on re-
covering installed field sensors and
verifying the Frehd model with re-
covered data.
• A series of field work excursions installed barometers,levelog-
gers,and conductivity temperature depth sensors throughout
the system (Figure 5.1).
• Sytem inputs,output,and major junctions were selected for
monitoring.
• Current sensor installed as represented by circles with points on
central map while upcoming sensor installation locations seen as
spoked circles in central map.
Figure 3.1 (right) -
(a) Water hyacinth
covering a diver-
sion canal at time
of lidar data collec-
tion,01/2013.(b)
Same water course
in 11/2014 after
spraying the hya-
cinth with herbi-
cide.
Figure 1 - The
Guadalupe
River Delta is
located along
the Texas Gulf
Coast about
30 miles
southeast of
Victoria,TX.
Figure 2 - The GBRA salt barrier is composed of two inflatable fabric bladders seen
beneath the water in the left image.During periods of low flow in the river,the
bladders are inflated raising the backwater elevation of the river and preventing
salt migration upstream.
Figure 5.1 - Sensors
were mounted atop a
rod with a concrete
base and submerged in
the waterways.A rope
attached by u-bolt se-
cured them to the
bank.
Acknowledgements
References
• Artificial channelization and flow restrictions on the lower
Guadalupe River Delta along the Texas Gulf Coast (Figure 1)
have altered the natural flow network through its surrounding
bayou and estuary system leading to marked ecosystem degra-
dation.
• A“drained”lidar DEM is prepared by removing water features
from the dataset and replacing them with bathymetry.Semi-au-
tomated channel extraction features are developed facilitating
feature removal.
• The fine resolution environmental hydrodynamic model (Freh-
da
) is used to facilitate understanding of the current in-situ con-
ditions and provide a tool for informed decision making.
Figure 4 -“Drained”DEM showing
bathymetry combined with lidar
based topography
Figure 5.2 - A field hand stands watch along the western shore of Schwings bayou.
0 100 200 300 400
Meters
a) Information available at http://www.crwr.utexas.edu/hodges/frehd.html
b) Passalacqua,P.,T.D.Trung,E.Foufoula-Georgiou,& W.E.Dietrich.(2010a).A geometric
framework for channel network extraction from lidar:Nonlinear diffusion and geodesic
paths.Journal of Geophysical Research,115(F01002).doi:
10.1177/030913338000400204.(https://sites.google.com/site/geonethome/home)
c) Passalacqua,P.,P.Belmont,& E.Foufoula-Georgiou.(2012).Automatic geomorphic feature
extraction from lidar in flat and engineered landscapes.Water Resources Research,
48(W03528).doi:10.1029/2011WR010958.
d) Ryan,A.J.,Hodges,B.R.(2011).“Modeling hydrodynamic fluxes in the Nueces River delta.”,Center for Research in Water Resources,The University of
Texas at Austin.CRWR Online Report 11-07,92 pgs.
Figure 3.2 (left and
below) - (a)
Cross-sections are
struck along
stream centerlines
using the GeoNet
feature extraction
toolboxc
.(b) Bank
location points are
determined based
on surface slope
maxima along each
cross section.(c)
Bank points are
connected to form
a water polygon.
• Lidar uses the idea of radar but with pulses of light to
map topography at a very high resolution.This 1m reso-
lution DEM was obtained from the Texas Bureau of Eco-
nomic Geology and developed from lidar flown in Janu-
ary of 2013.
• Lidar returns“no data”for water surfaces resulting in
easily identifiable water courses,but an infestation of the
system by the invasive species water hyacinth masks the
water surface in the dataset making the digitizing of
water extents difficult (Figure 3.1).
• Using the GeoNetb
toolbox,a semi-automated process
was developed to approximate the water surface extents
where hyacinth is present (Figure 3.2).
Figure 6 - DEM from the Nueces Delta study coarsened from 1m2
to 15m2
pixel size for
use in the Frehd model
(a)
(b)
l(
l(
l(
l(
l(
l(
l(
(
(
(
(HH
H
H
H
H
H
H
HH
H
H
HH
H
p0 0.5 1
Kilometers
l(
l(
Guadalupe Delta Lidar
31.3 m
- 1.5 m
Modified NHD flowlines
Freshwater Diversion Canals
( Flow Restrictions
Current Sensor Locations
H 10m CTD
H 10m TD
H 5m TD
H Barometer
Future Sensor Locations
l( 5m TD
l( 10m CTD
H
H
H
H
(a)
(b) (c)
High : 3 m
Low : -2 m
Salt Barrier Diversion Canal
Guadalupe San Antonio
River Confluence
Green Lake
Mission Lake
Highway 35 Diversion Canal
Traylor Cut
Hog Bayou
Mamie Bayou
Schwings Bayou
Upper Hog Bayou
Goff Bayou
Victoria Barge Canal
Guadalupe River
Hog Bayou Salt Gate
Goff Bayou Salt Gate
GBRA Salt Barrier
Salt Barrier Diversion Canal Gate
Guadalupe River North Fork
Guadalupe River South Fork