Download as PDF, PPTX

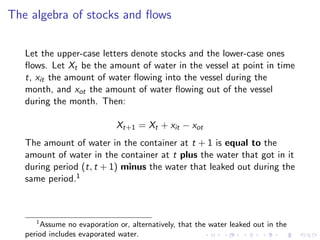
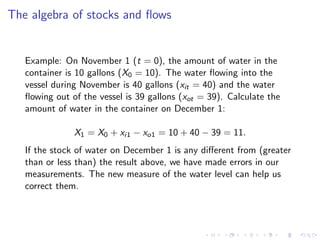
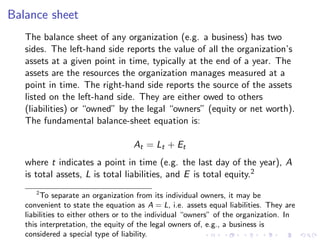
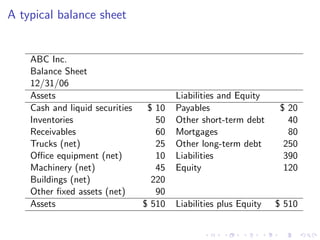
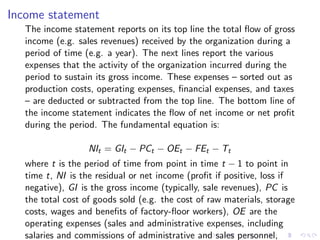
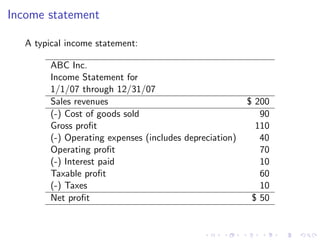
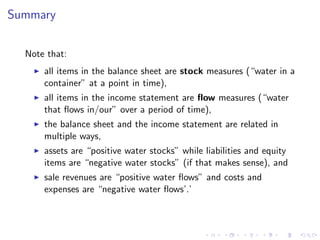

The document explains the concepts of stocks and flows in accounting, economics, and finance, emphasizing their importance for understanding financial statements. It details how stock measures represent values at a specific point in time, while flow measures represent values over a period, illustrating these concepts with equations and examples. Additionally, it describes the balance sheet and income statement as key financial statements, highlighting their roles in reporting a business's financial performance.


