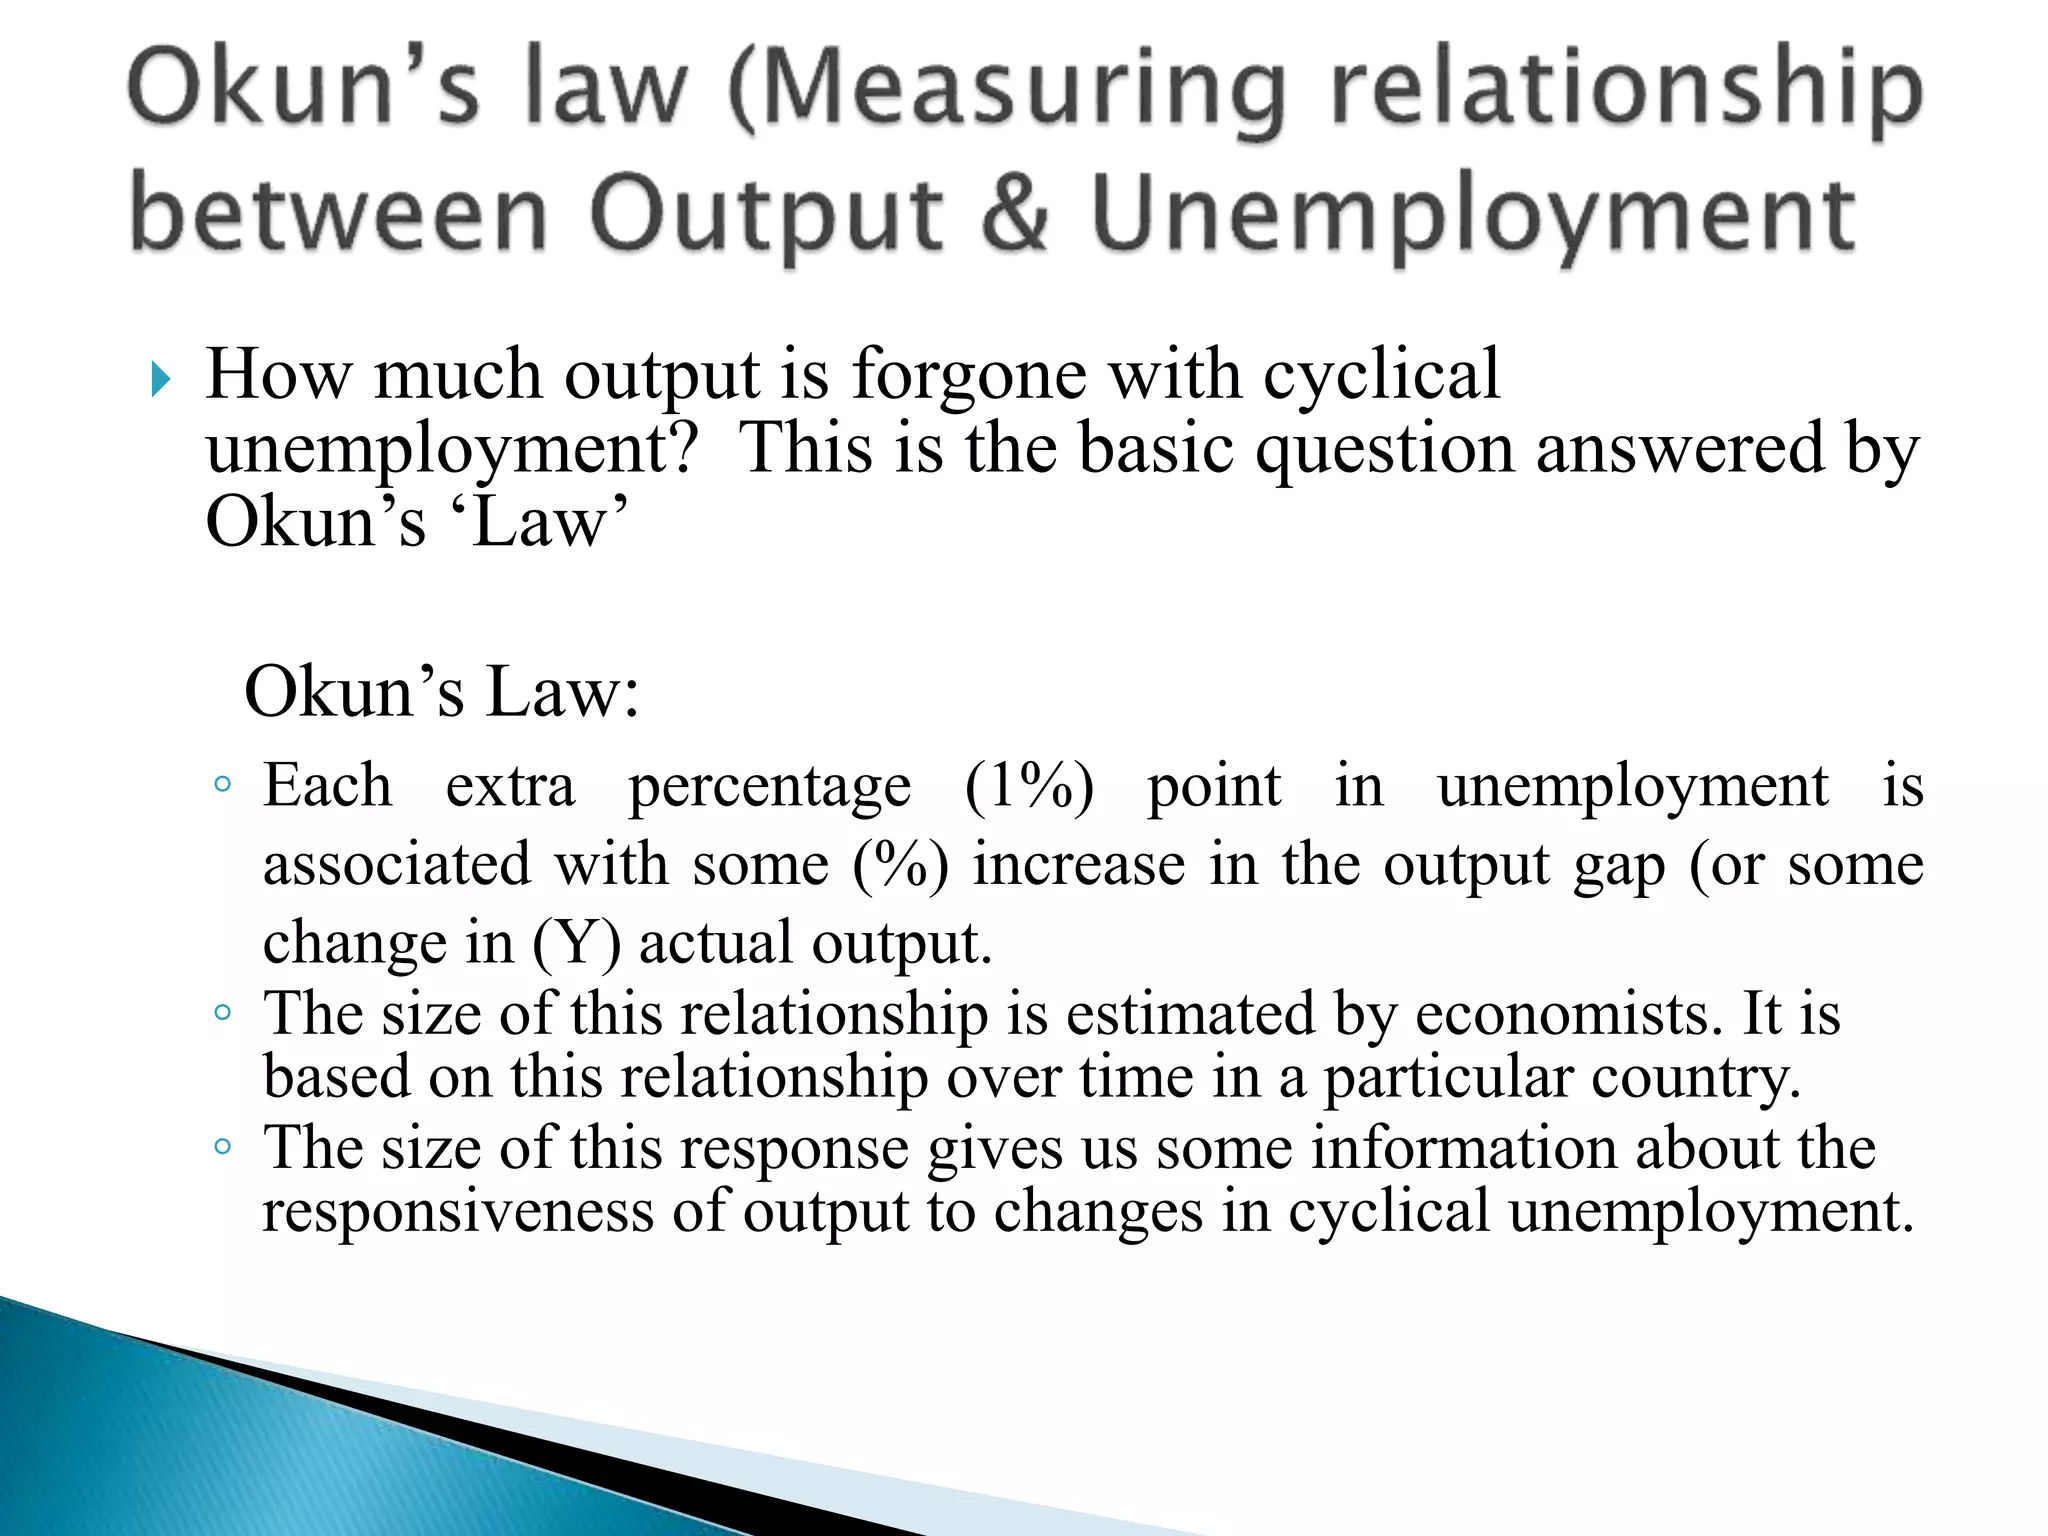
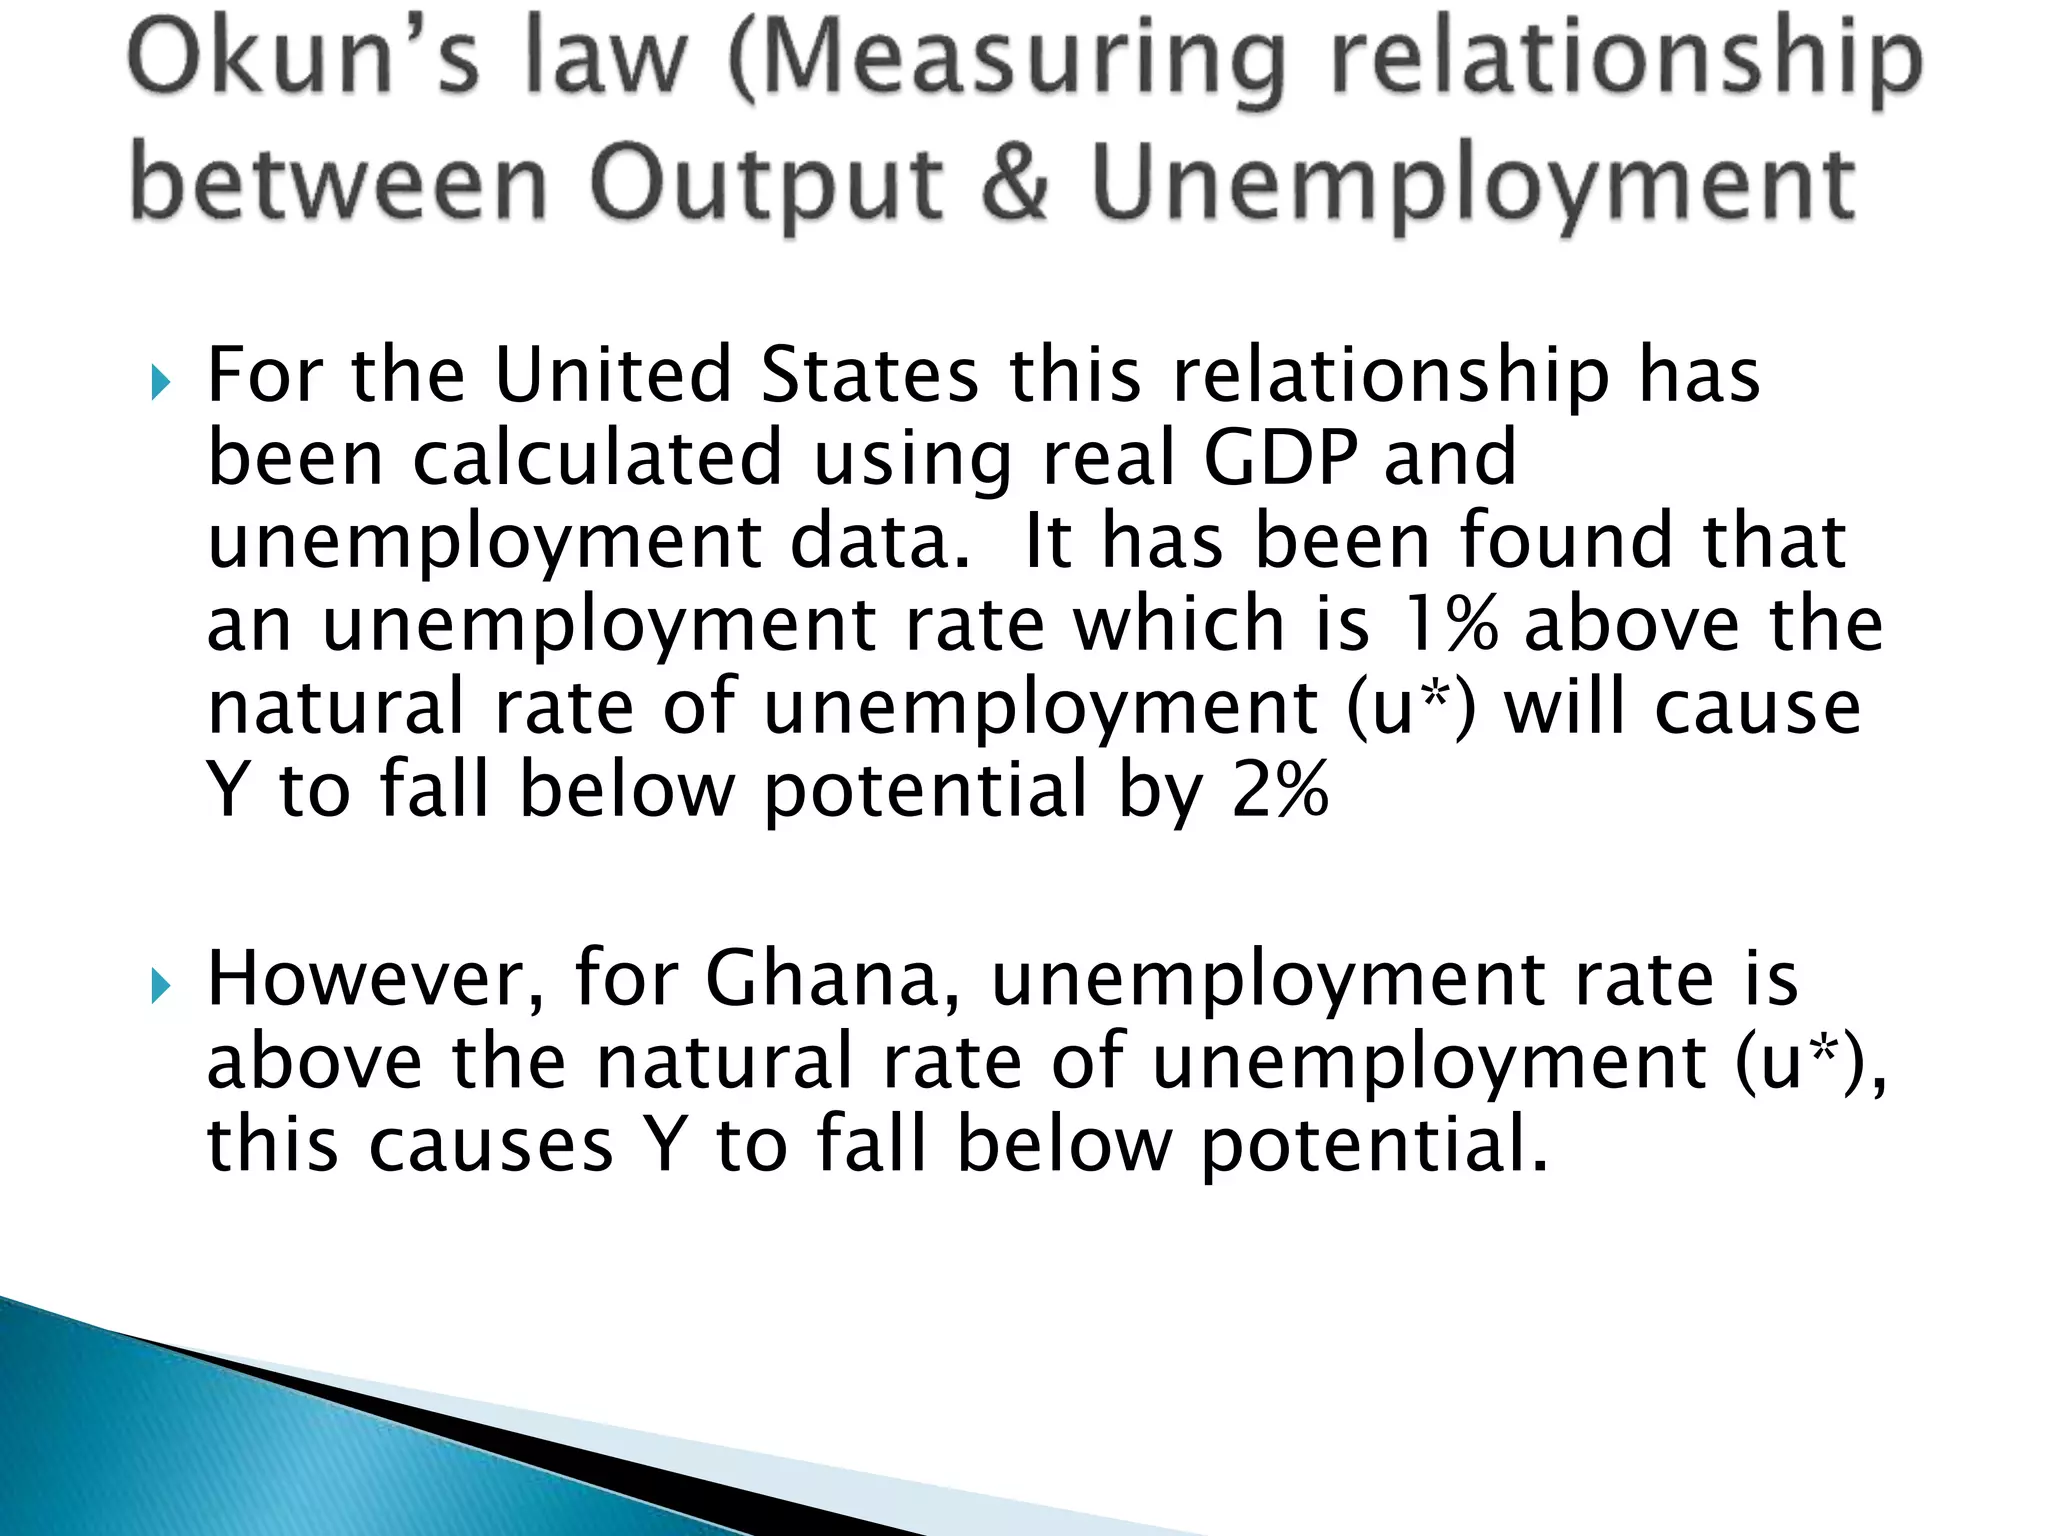
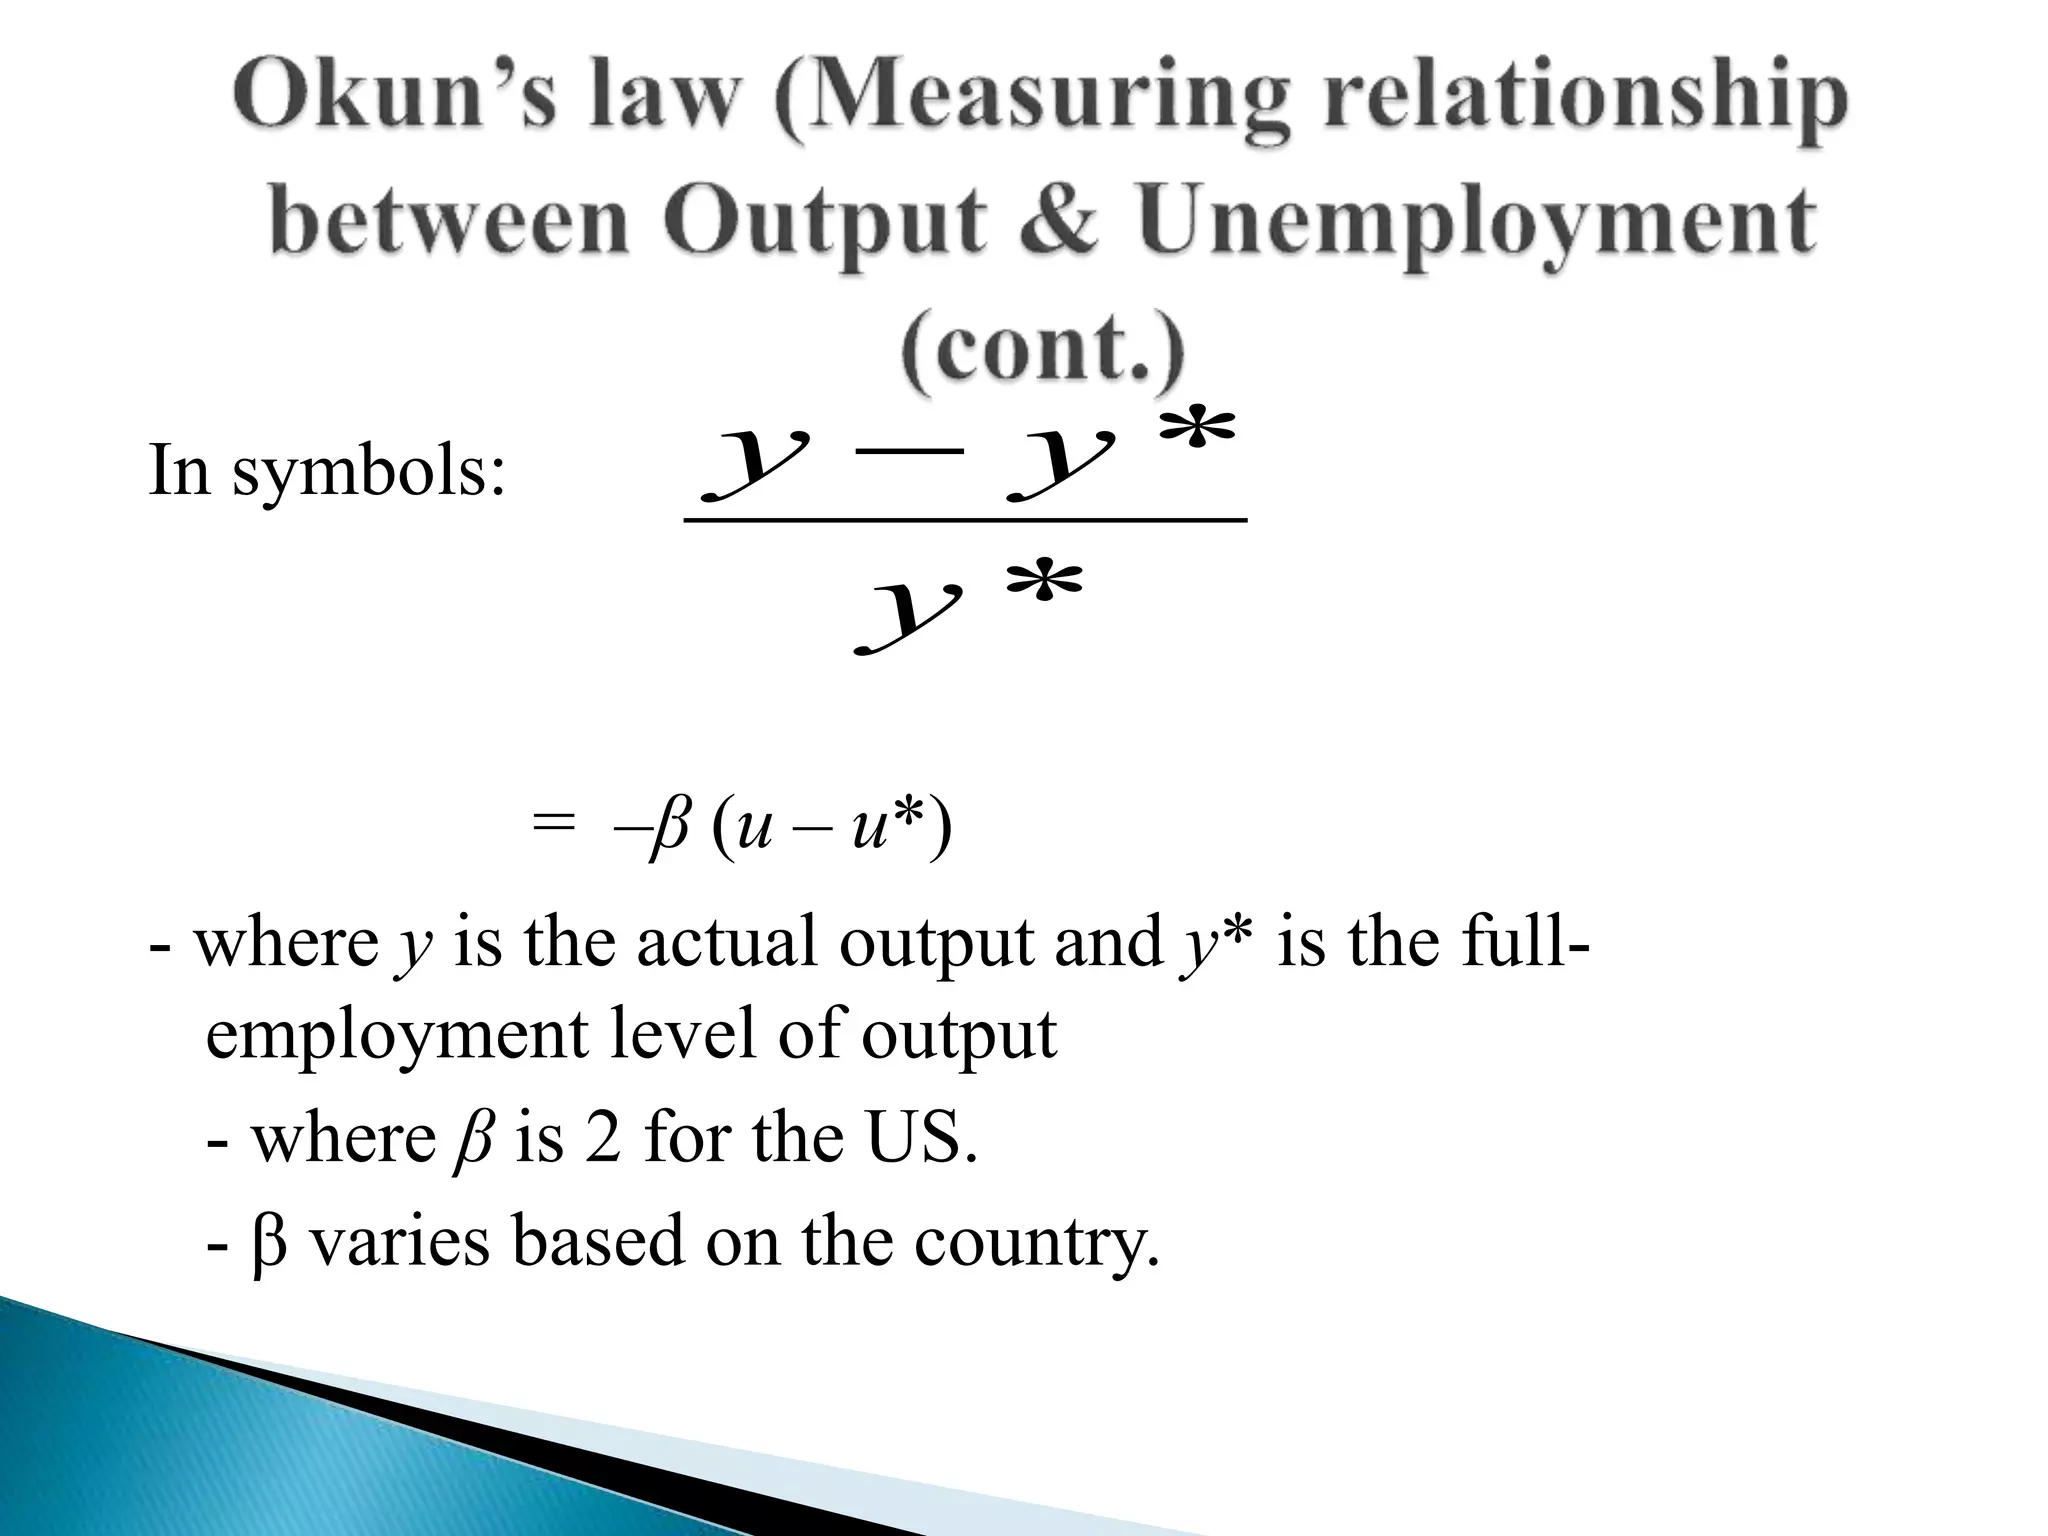
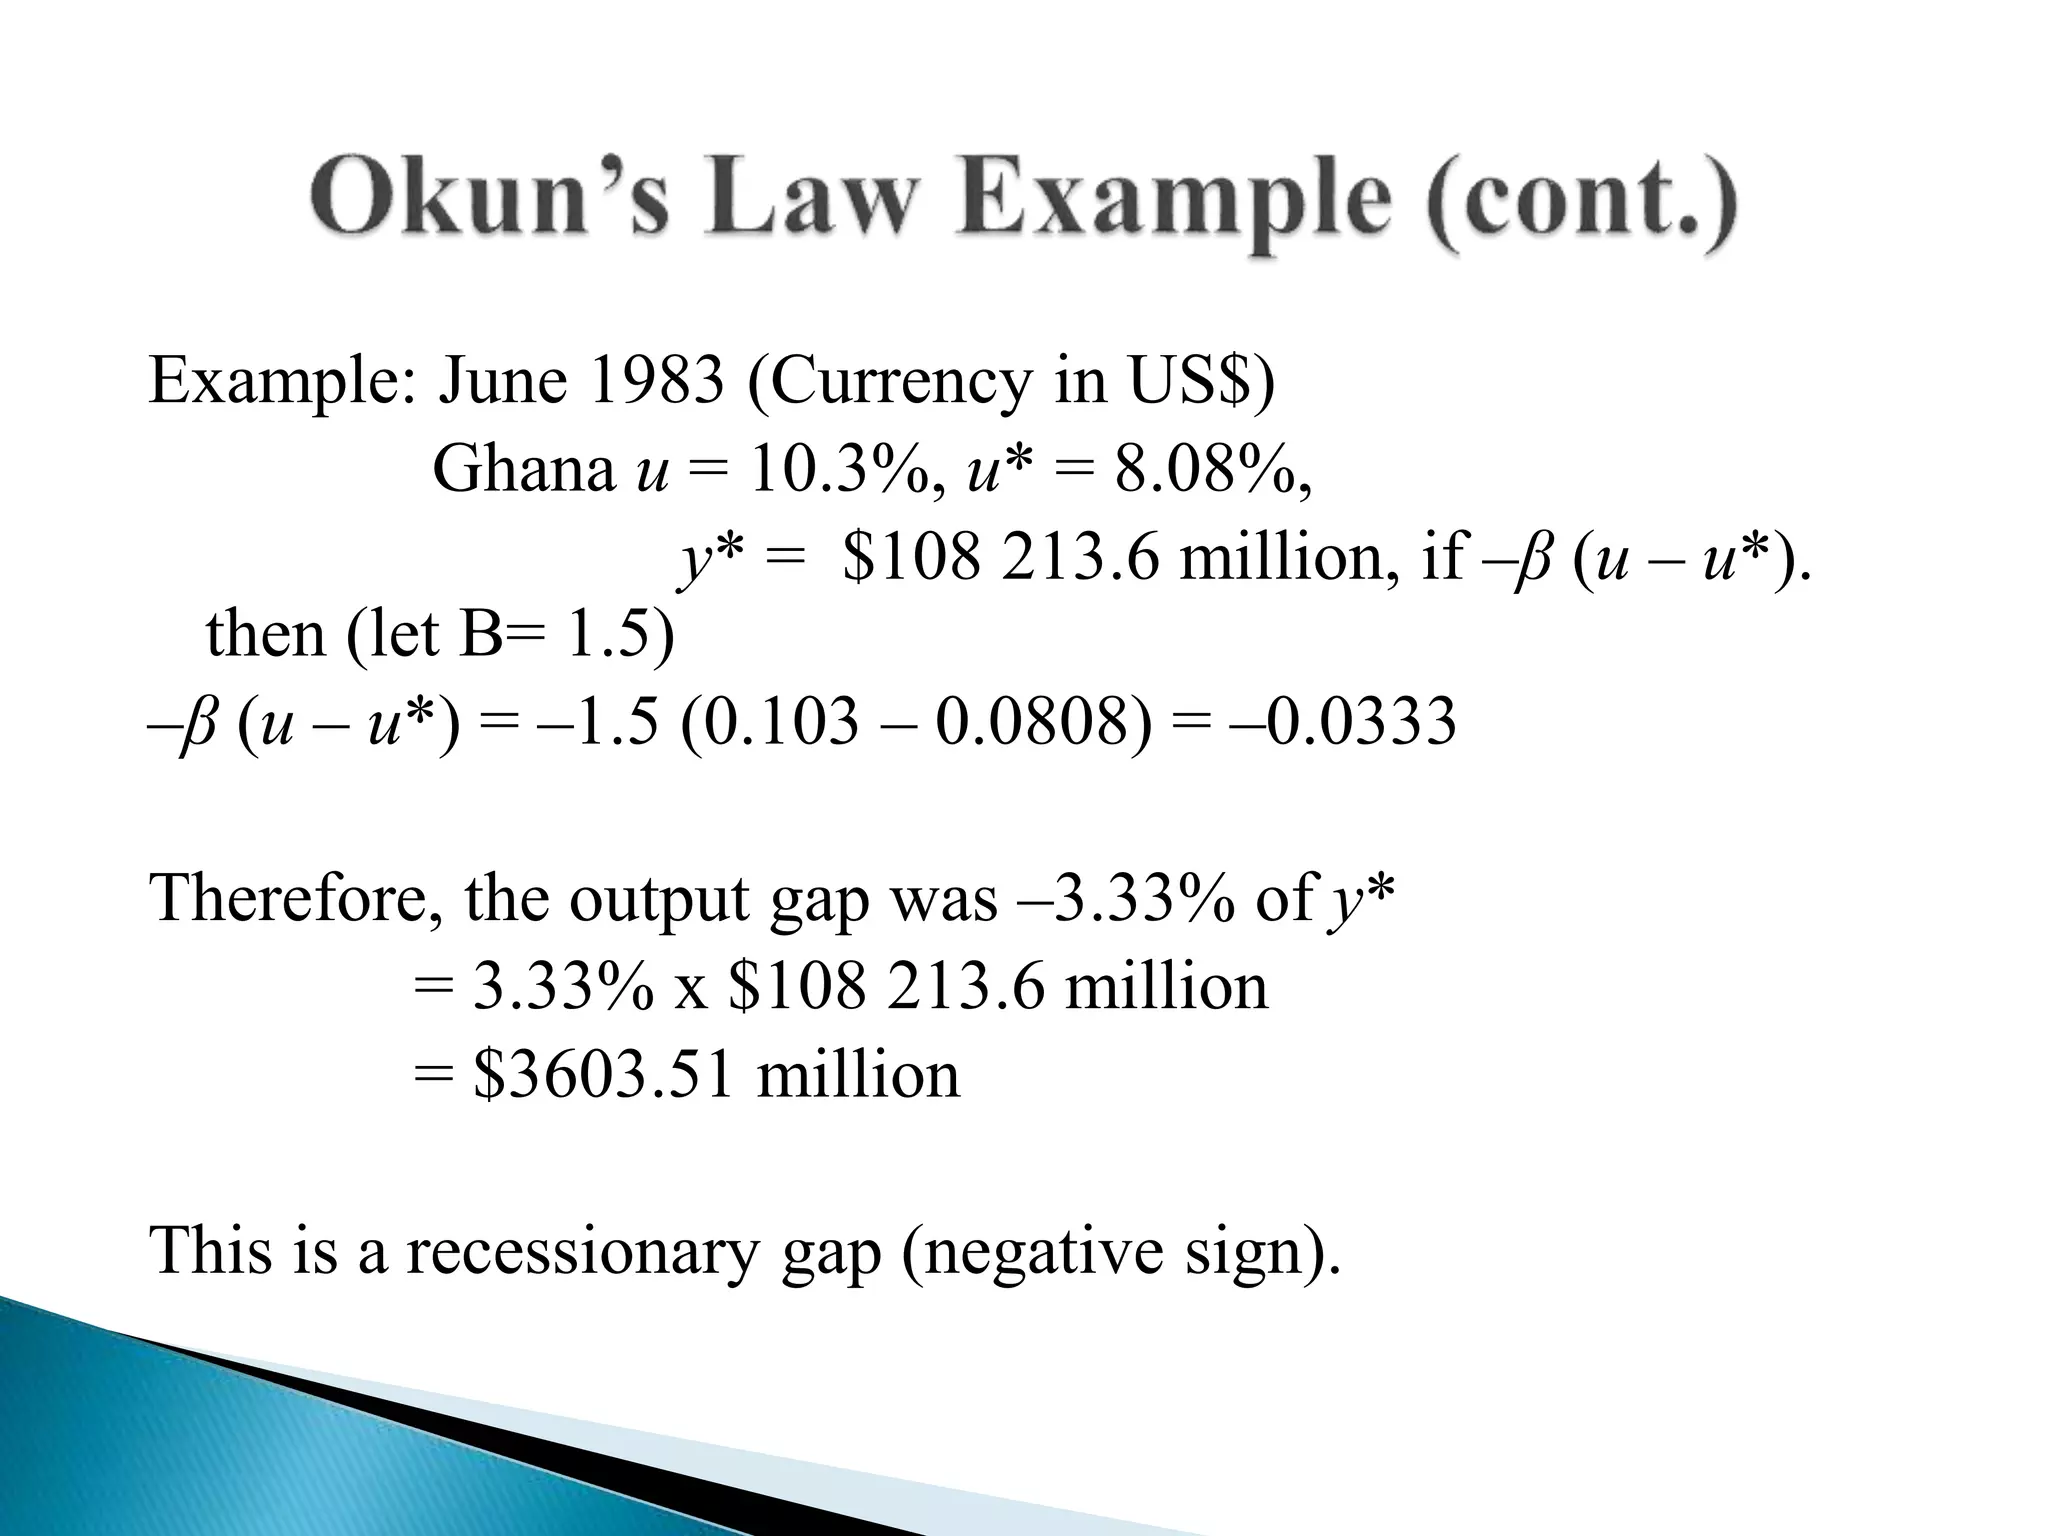
Okun’s Law: Output and Unemployment
By
Dr. Paul Onyina
 How much output is forgone with cyclical
unemployment? This is the basic question answered by
Okun’s ‘Law’
Okun’s Law:
◦ Each extra percentage (1%) point in unemployment is
associated with some (%) increase in the output gap (or some
change in (Y) actual output.
◦ The size of this relationship is estimated by economists. It is
based on this relationship over time in a particular country.
◦ The size of this response gives us some information about the
responsiveness of output to changes in cyclical unemployment.
 For the United States this relationship has
been calculated using real GDP and
unemployment data. It has been found that
an unemployment rate which is 1% above the
natural rate of unemployment (u*) will cause
Y to fall below potential by 2%
 However, for Ghana, unemployment rate is
above the natural rate of unemployment (u*),
this causes Y to fall below potential.
In symbols:
= –β (u – u*)
- where y is the actual output and y* is the full-
employment level of output
- where β is 2 for the US.
- β varies based on the country.
*
*
y
yy 
Example: June 1983 (Currency in US$)
Ghana u = 10.3%, u* = 8.08%,
y* = $108 213.6 million, if –β (u – u*).
then (let B= 1.5)
–β (u – u*) = –1.5 (0.103 – 0.0808) = –0.0333
Therefore, the output gap was –3.33% of y*
= 3.33% x $108 213.6 million
= $3603.51 million
This is a recessionary gap (negative sign).

Addendum to lecture 4 okun's law

  • 1.
    Okun’s Law: Outputand Unemployment By Dr. Paul Onyina
  • 2.
     How muchoutput is forgone with cyclical unemployment? This is the basic question answered by Okun’s ‘Law’ Okun’s Law: ◦ Each extra percentage (1%) point in unemployment is associated with some (%) increase in the output gap (or some change in (Y) actual output. ◦ The size of this relationship is estimated by economists. It is based on this relationship over time in a particular country. ◦ The size of this response gives us some information about the responsiveness of output to changes in cyclical unemployment.
  • 3.
     For theUnited States this relationship has been calculated using real GDP and unemployment data. It has been found that an unemployment rate which is 1% above the natural rate of unemployment (u*) will cause Y to fall below potential by 2%  However, for Ghana, unemployment rate is above the natural rate of unemployment (u*), this causes Y to fall below potential.
  • 4.
    In symbols: = –β(u – u*) - where y is the actual output and y* is the full- employment level of output - where β is 2 for the US. - β varies based on the country. * * y yy 
  • 5.
    Example: June 1983(Currency in US$) Ghana u = 10.3%, u* = 8.08%, y* = $108 213.6 million, if –β (u – u*). then (let B= 1.5) –β (u – u*) = –1.5 (0.103 – 0.0808) = –0.0333 Therefore, the output gap was –3.33% of y* = 3.33% x $108 213.6 million = $3603.51 million This is a recessionary gap (negative sign).