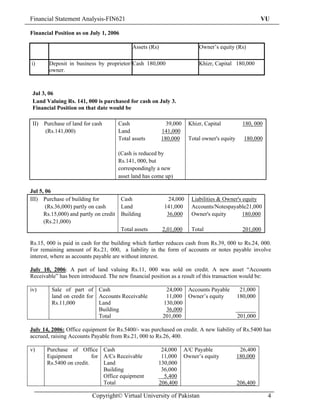
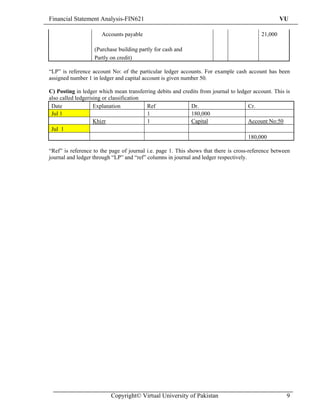
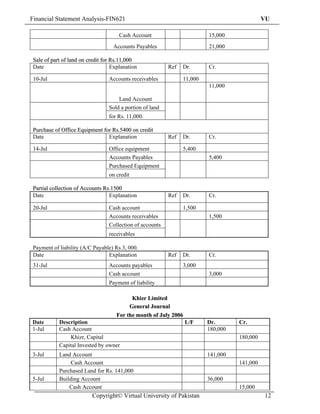
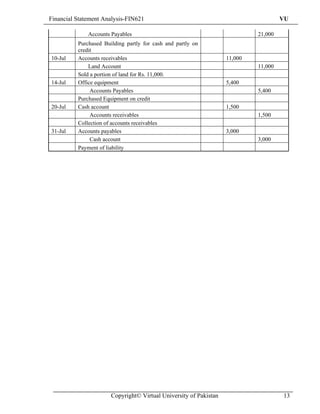
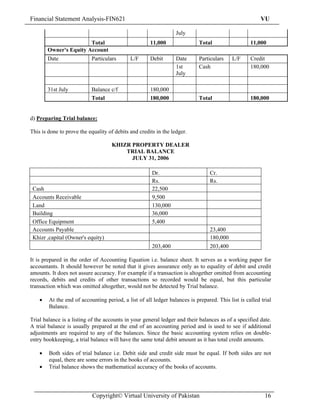
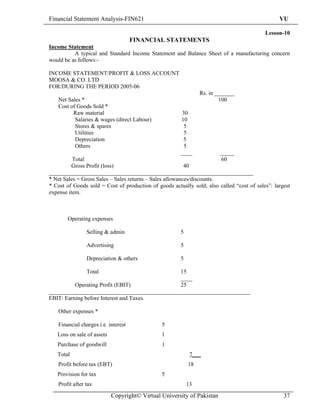
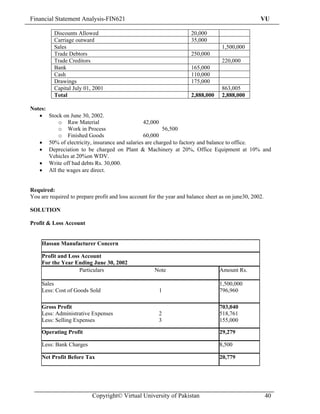
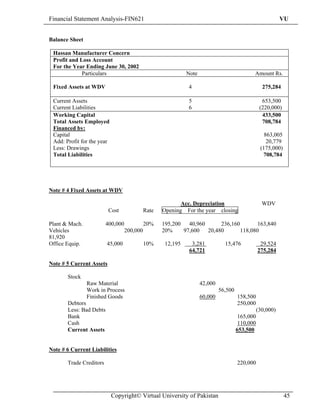
Financial Statement Analysis-FIN621                                                                       VU

                                                                                                   Lesson-1
                         ACCOUNTING & ACCOUNTING PRINCIPLES

Accounting

                 Almost every organization and individual maintains accounts and deals with
accounting. In simple terms, it can be described as a record of Income and expenditure of a business
organization, or budget vs. utilization, in the case of a government non-commercial organization. In the
case of the business entity, accounting would deal with measuring, recording and communicating the
results of business activities. That is why; Accounting is often called “Language of Business”.

Purpose of Accounting

               Accounting provides decision-makers with sufficient, relevant information to make
prudent and intelligent business decisions. This information is provided through accounting reports
called financial statements. The whole process is called “financial reporting”

               •   The purpose of accounting is to organize the financial details of business.
               •   To identify the financial transactions.
               •   To organize the financial data into useful information
               •   To measure the value of these information in terms of money
               •   To analyze, interpret, and communicate the information to persons or groups, both
                   inside or outside the business.

Financial Statements Generated by a Business

                   A business generates four financial statements at the end of its accounting period:-

        i)         Income statement: shows operational results of business during/over the accounting
                   period.

        ii)        Statement of owners’ equity: showing changes in owner’s equity through
                   profit/additional investment or through losses/drawl by owner.

        iii)       Balance sheet showing financial position at the end of the accounting period i.e. a
                   picture of what the business owns and what it owes.

        iv)        Statement of cash flows giving a picture of cash inflows (receipts) and cash outflows
                   (payments) over/during the accounting period. It is prepared from the two major
                   financial statements viz Income Statement and Balance Sheet.

Notes to Financial Statements:

                   In addition to above, notes containing additional information (financial & non-
                   financial) about the business are also attached to financial statements.

Accounting Period

              Accounting period is the period of time covered by an Income Statement. It is usually one
year. It can either be calendar year (Jan to Dec) or financial year (July to June). Financial Statements are
prepared at the end of accounting period and are the end product of accounting process/cycle.


                             Copyright© Virtual University of Pakistan                                     1
Financial Statement Analysis-FIN621                                                                  VU

Different Types of Business Organizations

1. Sole Proprietorship

According to D.W.T. Stafford, “It is the simplest form of business organization, which is owned and
controlled by one man”

Sole proprietorship is the oldest form of business organization which is owned and controlled by one
person. In this business, one man invests his capital himself. He is all in all in doing his business. He
enjoys the whole of the profit. The features of sole proprietorship are:

    •   Easy Formation
    •   Unlimited Liability
    •   Ownership
    •   Profit
    •   Management
    •   Easy Dissolution

2. Partnership

According to Partnership Act, 1932, “Partnership is the relation between persons who have agreed to
share the profits of a business carried on by all or any of them acting for all.”

Partnership means a lawful business owned by two or more persons. The profit of the business shared
by the partners in agreed ratio. The liability of each partner is unlimited. Small and medium size
business activities are performed under this organization. It has the following features:

    •   Legal Entity
    •   Profit and Loss Distribution
    •   Unlimited Liability
    •   Transfer of Rights
    •   Management
    •   Number of Partners

3. Joint Stock Company

According to S. E. Thomas, “A company is an incorporated association of persons formed usually for
the pursuit of some commercial purposes”

A joint stock company is a voluntary association of persons created by law. It has a separate legal entity
apart from its members. It can sue and be sued in its name. In the joint stock company, the work of
organization begins before its incorporation by promoters and it continues after incorporation. The joint
stock company has the following feature:

    •   Creation of Law
    •   Separate Legal Entity
    •   Limited Liability
    •   Transferability of shares
    •   Number of Members
    •   Common Seal


                           Copyright© Virtual University of Pakistan                                    2
Financial Statement Analysis-FIN621                                                                   VU

                           Generally Accepted Accounting Principles (GAAP)

              These are ‘Ground rules’ i.e. Principles for preparing financial statements. These are
constantly evolving. These embody accounting concepts, measurement techniques and standards of
presentation of financial statements. These Accounting Principles enable comparability between various
enterprises and of the operational performance of the same enterprise over many years. These give
reliability to Financial Statements.

                Following are some of the Generally Accepted Accounting Principles:

        i)      Entity principle:     specific business entity separate from personal affairs of the
                owner(s).

        ii)     Cost principle: valuation and recording of assets at cost.

        iii)    Going-concern assumption: connected with cost principle, assets acquired for use and
                not for resale.

        iv)     Objectivity principle: definite, factual basis for assets valuation; measuring
                transactions objectively.

        v)      Stable currency principle. The currency remains more or            less stable and rate of
                inflation is almost zero.

        vi)     Adequate disclosure concept: facts necessary for proper interpretation of statements;
                “subsequent events”, lawsuits against the business, assets pledged as
                securities/collaterals, contingent liabilities etc; reflected in Notes.

                                     ACCOUNTING EQUATION

ASSETS = LIABILITIES + OWNER’S EQUITY

              Balance Sheet is based on Accounting Equation. It is in fact, a detailed statement of the
Equation. The Equation in a way shows, utilization of Funds and Sources of Funds. In other words, it
shows what a business OWNS and what it OWES. Alternately, the Accounting Equation or Balance
Sheet is a description of Total Assets of a business against the claimants of these Assets. Therefore, this
Equation shows financial position on a specific date. The three titles in the Equation are Elements of
Balance Sheet. Similarly Elements of Income Statement would be Revenues & Expenses and their net
affects Owner’s equity.

              Within the Elements, there would be sub-elements, for example, the Element or Account
“Assets” would consist of cash, Accounts Receivable, Land, and Building etc. Each financial
transaction affects two or more elements or sub-elements of the Accounting Equation. Therefore, we
can say that each financial transaction affects Balance Sheet i.e. financial position of the business. This
would be clear from the following illustration.

Khizr property dealer:

The proprietor starts business with deposit of Rs.180, 000. On July 1, 2006


                           Copyright© Virtual University of Pakistan                                     3
Financial Statement Analysis-FIN621                                                                       VU

Financial Position as on July 1, 2006

                                              Assets (Rs)                    Owner’s equity (Rs)

i)      Deposit in business by proprietor/ Cash 180,000                      Khizr, Capital 180,000
        owner.


 Jul 3, 06
 Land Valuing Rs. 141, 000 is purchased for cash on July 3.
 Financial Position on that date would be

 II) Purchase of land for cash          Cash                  39,000    Khizr, Capital           180, 000
     (Rs.141,000)                       Land                141,000
                                        Total assets        180,000     Total owner's equity      180,000

                                        (Cash is reduced by
                                        Rs.141, 000, but
                                        correspondingly a new
                                        asset land has come up)

Jul 5, 06
III) Purchase of building for            Cash                 24,000      Liabilities & Owner's equity
       (Rs.36,000) partly on cash        Land                141,000      Accounts/Notespayable21,000
      Rs.15,000) and partly on credit    Building             36,000      Owner's equity        180,000
      (Rs.21,000)
                                         Total assets       2,01,000      Total                  201,000

Rs.15, 000 is paid in cash for the building which further reduces cash from Rs.39, 000 to Rs.24, 000.
For remaining amount of Rs.21, 000, a liability in the form of accounts or notes payable involve
interest, where as accounts payable are without interest.

July 10, 2006: A part of land valuing Rs.11, 000 was sold on credit. A new asset “Accounts
Receivable” has been introduced. The new financial position as a result of this transaction would be:

iv)      Sale of part of Cash                                24,000 Accounts Payable            21,000
         land on credit for Accounts Receivable              11,000 Owner’s equity             180,000
         Rs.11,000          Land                            130,000
                            Building                         36,000                            _______
                            Total                           201,000                             201,000

July 14, 2006: Office equipment for Rs.5400/- was purchased on credit. A new liability of Rs.5400 has
accrued, raising Accounts Payable from Rs.21, 000 to Rs.26, 400.

v)     Purchase of Office Cash                           24,000        A/C Payable              26,400
       Equipment          for A/Cs Receivable            11,000        Owner’s equity          180,000
       Rs.5400 on credit.     Land                      130,000
                              Building                   36,000
                              Office equipment            5,400
                              Total                     206,400                                206,400

                           Copyright© Virtual University of Pakistan                                        4
Financial Statement Analysis-FIN621                                                                   VU

July 20, 2006. Accounts receivable which were Rs.11, 000 on July 14, have been converted into cash to
the extent of Rs.1, 500. Cash has therefore increased from Rs.24, 000 to Rs.25, 500 and accounts
receivable have correspondingly decreased to Rs.9, 500

 (VI)    Partial collection of           Cash                25,500       A/Cs payable       26,400
         Accounts (Rs.15,00)             A/C receivable       9,500       owner's equity   180,000
                                         Land               130,000
                                         Building            36,000
                                         Office equipment     5,400
                                         Total            206,400         Total             206400

July 31, 2006

 (VII)   Payment of liability            Cash                  22,500     A/Cs payable       23,400
         (A/C payable) Rs.3,000          A/C receivable         9,500     owner's equity    180,000
                                         Land                 130,000
                                         Building              36,000
                                         Office equipment       5,400
                                         Total                203,400     Total            2,03,400

             It is thus clear from the above illustration that each financial transaction affects financial
position, (which in effect is the balance sheet). Accounting period in the example was one month. It
must also be noted no business activity (commissions/ fees/ Revenues & Expenses) was involved in
above example. Only setting up of business was involved and therefore owner’s equity remains the
same.


                           Copyright© Virtual University of Pakistan                                     5
Financial Statement Analysis-FIN621                                                                      VU

                                                                                                    Lesson-2
                     ACCOUNT AND ACCOUNTING CYCLE/PROCESS

Account

An accounting system keeps separate record of each item like assets, liabilities, etc. For example, a
separate record is kept for cash that shows increase and decrease in it.
This record that summarizes movement in an individual item is called an Account.

              Each element/sub-element of the balance sheet is named as “Account”, having three parts
viz title, left side (Debit or Dr) and a right side (Credit or Cr). Technically, these are also called ‘Ledger
Accounts’. The same is true of Income Statement, which would be discussed later.
The Ledger Accounts are also called T-account, because these are in the shape of the alphabet ‘T’ as
shown below:-

                                        Dr          Title          Cr
                                                      !
                                                      !
                                                      !
                                                      !
!
Account Payable:An amount owed to a supplier for good or services purchased on credit; payment is
due within a short time period, usually 30 days or less.

Notes Payable: A liability expressed by a written promise to make a future payment at a specific time,
OR are obligations (short term debt) evidenced by a promissory note? The proceeds of the note are used
to purchase current assets (inventory & receivables).

Dual Aspect of Transactions

For every debit there is an equal credit. This is also called the dual aspect of the transaction i.e. every
transaction has two aspects, debit and credit and they are always equal. This means that every
transaction should have two-sided effect. For example Mr. A starts his business and he initially invests
Rupees 100,000/- in cash for his business. Out of this cash following items are purchased in cash;

            o    A building for Rupees 50,000/-;
            o    Furniture for Rupees 10,000/-; and
            o    A vehicle for Rupees 15,000/-

This means that he has spent a total of Rupees 75,000/- and has left with Rupees 25,000 cash. We will
apply the Dual Aspect Concept on these events from the viewpoint of business.

When Mr. A invested Rupees 100,000/-, the cash account benefited from him. The event will be
recorded in the books of business as,

        Debit            Cash                                       Rs.100, 000
        Credit                    Mr. A                                     Rs.100, 000

        Analyse the transaction. The account that received the benefit, in this case is the cash account,
        and the account that provided the benefit is that of Mr. A.
    •   Building purchased – The building account benefited from cash account

        Debit            Building                                   Rs.50, 000
        Credit                   Cash                                       Rs.50, 000
                            Copyright© Virtual University of Pakistan                                       6
Financial Statement Analysis-FIN621                                                                  VU


    •     Furniture purchased – The furniture account benefited from cash account

          Debit          Furniture                                Rs.10, 000
          Credit                 Cash                                     Rs.10, 000

    •     Vehicle purchased – The vehicle account benefited from cash account

          Debit          Vehicle                           Rs.15, 000
          Credit                   Cash                                   Rs.15, 000

          Basic Principle of Double Entry

We can devise the basic principle of double entry book-keeping from our discussion to this point “Every
Debit has a Credit” which means that “All Debits are always equal to All Credits”.

Assets

Assets are the properties and possessions of the business.

Properties and possessions can be of two types:
            o Tangible Assets that have physical existence ( are further divided into Fixed Assets and
                Current Assets)
            o Intangible Assets that have no physical existence

Examples of both are as follows:
           o Tangible Assets – Furniture, Vehicle etc.
           o Intangible Assets – Right to receive money, Good will etc.

Accounting Equation

From the above example, if the debits and credits are added up, the situation will be as follows:

Debits
                                   Cash                                   Rs.100, 000/-
                                   Building                                   50,000/-
                                   Furniture                                  10,000/-
                                   Vehicle                                    15,000/-
Credits
                                               Mr. A                                        Rs.100, 000/-
                                                Cash                                            75,000/-

The total Equation becomes:
                                                       •
                      DEBITS                               =             CREDITS

             Cash + Building + Furniture + Vehicle         =        Cash + Mr. A
             100000 + 50000 + 10000      + 15000           =        75000 + 75000

Cash on Left Hand Side is Rupees 100,000/- and on Right Hand Side it is Rs.75, 000/-. If it is gathered
on the Left Hand Side it will give a positive figure of Rupees 25,000/- (which you will notice is our
balance of cash in hand). Now the equation becomes:


                            Copyright© Virtual University of Pakistan                                   7
Financial Statement Analysis-FIN621                                                                   VU

                  DEBITS                                   =             CREDITS

           Cash + Building    + Furniture+ Vehicle         =       Mr. A
               25,000+ 50,000 + 10,000 + 15,000            =       100,000

Keeping the entity concept in mind we can see that the business owns the building, furniture, vehicle
and cash and will obtain benefit from these things in future. Any thing that provides benefit to the
business in future is called ‘Asset’. Similarly the business had obtained the money from Mr. A and this
money will have to be returned in form of either cash or benefits. Any thing for which the business has
to repay in any form is called ‘Liability’. So cash, building, furniture and vehicle are the assets of the
business and the amount received from Mr. A for which the business will have to provide a return or
benefit is the liability of the business. Therefore, our equation becomes:

                                 Assets          =         Liabilities

The liabilities of the business can be classified into two major classes i.e. the amounts payable to
‘outsiders’ and those payable to the ‘owners’. The liability of the business towards its owners is called
‘Capital’ and amount payable to outsiders is called liability. Therefore, our accounting equation finally
becomes:

                  Assets         =               Capital           +         Liabilities

        Business or Commercial Accounts are based upon Double entry accounting involving Debit and
credit entries. Rule for Dr. & Cr entries to record changes in balance sheet Accounts or Accounting
Equation is: increase in assets are debited (since Assets are on left side of Accounting Equation) and
increase in liabilities and Owner’s Equity are credited because these are on the right side of Accounting
Equation. Correspondingly, decrease in Assets is credited and decrease in liabilities and Owners Equity
are debited.

Dr+ ↑ Assets = Liabilities + Owner’s equity
                          Cr↓_           Cr ↑ + ↓ _ Dr ↑+Cr ↓_ Dr.

               Rule for Income Statement items is that Revenues are credited and expenses are
debited. The basis of this rule is that income statement shows the effect of Revenues & Expenses on
owner’s equity. Difference of Revenues and Expenses causes difference in owner’s equity. Since
Revenues increase owner’s equity, these are credited. Correspondingly, since expenses ultimately
reduce owner’s equity, these are debited.

             It would thus be seen that normal balances in Assets Accounts would be debit and those in
Liability and Owner’s Equity Accounts would be credit. Orderly arrangement of Accounts is to be
maintained. Numbering of Accounts is also done to facilitate proper record-keeping and cross-
references. When the business is large, a Chart of Accounts is maintained which lists the various
Accounts giving details of their titles and numbers.

Compound Entry. A journal entry that has more than one debit or credit entry.

                     General Journal
 Date                Account Title and explanation                       LP       Dr.        Cr.
                     Cash                                                1        180,000
                        Khizr, Capital                                   50                  180,000
 July, 2006 (1)         (Owner invested cash in business)
 July, 2006 (5)      Building                                                     36,000
                       Cash                                                                  15,000
                           Copyright© Virtual University of Pakistan                                    8
Financial Statement Analysis-FIN621                                                                VU

                      Accounts payable                                                    21,000

                   (Purchase building partly for cash and
                   Partly on credit)

“LP” is reference account No: of the particular ledger accounts. For example cash account has been
assigned number 1 in ledger and capital account is given number 50.

C) Posting in ledger which mean transferring debits and credits from journal to ledger account. This is
also called ledgerising or classification
 Date               Explanation           Ref               Dr.                     Cr.
 Jul 1                                    1                 180,000
                    Khizr                 1                Capital                  Account No:50
 Jul 1
                                                                                    180,000

“Ref” is reference to the page of journal i.e. page 1. This shows that there is cross-reference between
journal and ledger through “LP” and “ref” columns in journal and ledger respectively.


                          Copyright© Virtual University of Pakistan                                  9
Financial Statement Analysis-FIN621                                                                    VU

                                                                                                  Lesson-3

                                  ACCOUNTING CYCLE/PROCESS
                                               (Continued)
*Rules of Debit and Credit

From our discussion up to this point, we have established following rules for Debit and Credit:

Any account that obtains a benefit is Debit.
OR
Anything that will provide benefit to the business is Debit.

Both these statements may look different but in fact if we consider that whenever an account benefits as
a result of a transaction, it will have to return that benefit to the business then both the statements will
look like different sides of the same picture.
For credit,
Any account that provides a benefit is Credit.
OR
         Anything to which the business has a responsibility to return a benefit in future is Credit.

As explained in the case of Debit, whenever an account provides benefit to the business the business
will have a responsibility to return that benefit at some time in future and so it is Credit.

*Rules of Debit and Credit for Assets

Similarly we have established that whenever a business transfers a value / benefit to an account and as a
result creates some thing that will provide future benefit; the ‘thing’ is termed as Asset. By combining
both these rules we can devise following rules of Debit and Credit for Assets:
             o When an asset is created or purchased, value / benefit is transferred to that account, so it
                 is Debited

I.   Increase in Asset is Debit

            o   Reversing the above situation if the asset is sold, which is termed as disposing off, for
                say cash, the asset account provides benefit to the cash account. Therefore, the asset
                account is Credited

II. Decrease in Asset is Credit

*Rules of Debit and Credit for Liabilities

Anything that transfers value to the business, and in turn creates a responsibility on part of the business
to return a benefit, is a Liability. Therefore, liabilities are the exact opposite of the assets.

            o   When a liability is created the benefit is provided to business by that account so it is
                Credited

III. Increase in Liability is Credit

            o   When the business returns the benefit or repays the liability, the liability account
                benefits from the business. So it is Debited


                           Copyright© Virtual University of Pakistan                                     10
Financial Statement Analysis-FIN621                                                                    VU

IV. Decrease in Liability is Debit


*Rules of Debit and Credit for Expenses

Just like assets, we have to pay for expenses. From assets, we draw benefit for a long time whereas the
benefit from expenses is for a short run. Therefore, Expenditure is just like Asset but for a short run.
Using our rule for Debit and Credit, when we pay cash for any expense that expense account benefits
from cash, therefore, it is debited.

            o   Now we can lay down our rule for Expenditure:

V. Increase in Expenditure is Debit

            o   Reversing the above situation, if we return any item that we had purchased, we will
                receive cash in return. Cash account will receive benefit from that Expenditure account.
                Therefore, Expenditure account will be credited

VI. Decrease in Expenditure is Credit

*Rules of Debit and Credit for Income

Income accounts are exactly opposite to expense accounts just as liabilities are opposite to that of assets.
Therefore, using the same principle we can draw our rules of Debit and Credit for Income

VII.     Increase in Income is Credit

VIII.    Decrease in Income is Debit

 Khizr introduced a capital of Rs.180,000 in his business
 Date                             Explanation                Ref    Dr.         Cr.
 2006
 1-Jul                             Cash Account              1      180,000
                                   Khizr, Capital            1                  180,000

 Purchased land for cash for Rs.141,000
 Date                            Explanation                 Ref    Dr.         Cr.
 3-Jul                             Land Account                     141,000
                                       Cash Account                             141,000
                                   Purchased Land for
                                   Rs.
                                   141,000


 Purchase of building partly on cash (Rs.15,000) and partly
 on credit (Rs.21,000)
 Date                             Explanation               Ref     Dr.         Cr.
 5-Jul                            Building Account                  36,000
                           Copyright© Virtual University of Pakistan                                     11
Financial Statement Analysis-FIN621                                                           VU

                                       Cash Account                       15,000
                                    Accounts Payables                     21,000

 Sale of part of land on credit for Rs.11,000
 Date                               Explanation            Ref   Dr.      Cr.

 10-Jul                           Accounts receivables           11,000
                                                                          11,000

                                      Land Account
                                  Sold a portion of land
                                  for Rs. 11,000.

 Purchase of Office Equipment for Rs.5400 on credit
 Date                           Explanation                Ref   Dr.      Cr.

 14-Jul                           Office equipment               5,400
                                  Accounts Payables                       5,400
                                  Purchased Equipment
                                  on credit

 Partial collection of Accounts Rs.1500
 Date                             Explanation              Ref   Dr.      Cr.

 20-Jul                           Cash account                   1,500
                                  Accounts receivables                    1,500
                                  Collection of accounts
                                  receivables

 Payment of liability (A/C Payable) Rs.3, 000.
 Date                            Explanation               Ref   Dr.      Cr.
 31-Jul                           Accounts payables              3,000
                                  Cash account                            3,000
                                  Payment of liability

                                           Khizr Limited
                                          General Journal
                                     For the month of July 2006
Date        Description                                           L/F     Dr.       Cr.
1-Jul       Cash Account                                                  180,000
                Khizr, Capital                                                      180,000
            Capital Invested by owner
3-Jul       Land Account                                                  141,000
                 Cash Account                                                       141,000
            Purchased Land for Rs. 141,000
5-Jul       Building Account                                              36,000
                Cash Account                                                        15,000
                           Copyright© Virtual University of Pakistan                          12
Financial Statement Analysis-FIN621                                                  VU

              Accounts Payables                                             21,000
          Purchased Building partly for cash and partly on
          credit
10-Jul    Accounts receivables                                     11,000
              Land Account                                                  11,000
          Sold a portion of land for Rs. 11,000.
14-Jul    Office equipment                                         5,400
               Accounts Payables                                            5,400
          Purchased Equipment on credit
20-Jul    Cash account                                             1,500
               Accounts receivables                                         1,500
          Collection of accounts receivables
31-Jul    Accounts payables                                        3,000
               Cash account                                                 3,000
          Payment of liability


                       Copyright© Virtual University of Pakistan                     13
Financial Statement Analysis-FIN621                                                                   VU

                                                                                                 Lesson-4
                                  ACCOUNTING CYCLE/PROCESS
                                               (Continued)

ACCOUNTING CYCLE/PROCESS

It mainly consists of Recording, Classifying and Summarizing financial transactions over an accounting
period.

Steps in Accounting Cycle

         a)       Analyzing financial transaction. The purpose is to see which two (or more) Accounts
                  (or sub-Accounts) are affected by a particular financial transaction.
         b)       Recording (chronologically) in journal which is called “book of original entry”.
                  this step is also called journalizing. Its practical illustration is given below.
         c)       Posting in ledger which means transferring debits and credits from journal to
                  ledger account. This is also called ledgerising or classification.
         d)       Preparing trial balance, this is done to prove the equality of debits and credits in the
                  ledger
         e)       Making adjusting Entries

Compound Entry. A journal entry that has more than one debit or credit entry.

                     General Journal
 Date                Account Title and explanation                        LP    Dr.          Cr.
                     Cash                                                 1     180,000
                        Khizr, Capital                                    50                 180,000
 July, 2006 (1)         (Owner invested cash in business)
                     Building                                                   36,000
                       Cash                                                                  15,000
 July, 2006 (5)        Accounts payable                                                      21,000

                     (Purchase building partly for cash and
                     Partly on credit)

“LP” is reference account No: of the particular ledger accounts. For example cash account has been
assigned number 1 in ledger and capital account is given number 50.

C) Posting in ledger which mean transferring debits and credits from journal to ledger account. This is
also called ledgerising or classification

 Date               Explanation          Ref              Dr.                    Cr.
 1-Jul                                   1                180,000
                    Khizr                1                Capital                Account No:50
 1-Jul
                                                                                 180,000

“Ref” is reference to the page of journal i.e. page 1. This shows that there is cross-reference between
journal and ledger through “LP” and “ref” columns in journal and ledger respectively.

                             Copyright© Virtual University of Pakistan                                 14
Financial Statement Analysis-FIN621                                                       VU


                                            Cash Ledger Account
      Date            Particulars     L/F      Debit   Date       Particulars L/F     Credit
      1stJuly         Owners                   180,000 3rd        Land                141,000
                      Equity                           July
                      Accounts                           5th
      20th July       Receivables              1,500     July     Building            15,000
                                                         31st
                                                         Jul      A/P                 3,000
                                                          31st
                                                         July     Balance c/f         22,500
                      Total                    181,500            Total               181,500

                                             Building Account
      Date            Particulars     L/F      Debit     Date     Particulars   L/F   Credit
      5th July        Cash Account             15,000
      5th July        A/P                      21,000
                                                          31st
                                                         July     Balance c/f         36,000
                      Total                    36,000             Total               36,000

                                       Office Equipment Account
      Date            Particulars     L/F     Debit   Date     Particulars      L/F   Credit
      14-Jul          A/P                     5,400
                                                       31st
                                                      July     Balance c/f            5,400
                      Total                   5,400            Total                  5,400

                                             Accounts Payable
      Date            Particulars     L/F      Debit    Date      Particulars   L/F   Credit
      31st July       Cash                     3,000    5thJul    Building            21,000
                                                        14th      Equipment           5,400
                                                        July
      31st July       Balance c/f              23,400
                      Total                    26,400             Total               26,400
                                               Land Account
      Date            Particulars     L/F      Debit    Date      Particulars   L/F   Credit
      3rd July        Cash                     141,000 10th       A/R                 11,000
                                                        July
                                                         31st
                                                         July     Balance c/f         130,000
                      Total                    141,000            Total               141,000
                                            Accounts Receivable
      Date            Particulars     L/F      Debit     Date     Particulars   L/F   Credit
      10th July       Land                     11,000    20th     Cash                1,500
                                                         July
                                                          31st    Balance c/f         9,500
                      Copyright© Virtual University of Pakistan                                15
Financial Statement Analysis-FIN621                                                                     VU

                                                                  July
                        Total                         11,000                Total                  11,000
        Owner's Equity Account
        Date               Particulars       L/F      Debit       Date      Particulars    L/F     Credit
                                                                  1st       Cash                   180,000
                                                                  July

        31st July          Balance c/f                180,000
                           Total                      180,000               Total                  180,000


d) Preparing Trial balance:

This is done to prove the equality of debits and credits in the ledger.

                                     KHIZR PROPERTY DEALER
                                         TRIAL BALANCE
                                           JULY 31, 2006

                                                       Dr.                       Cr.
                                                       Rs.                       Rs.
 Cash                                                  22,500
 Accounts Receivable                                   9,500
 Land                                                  130,000
 Building                                              36,000
 Office Equipment                                      5,400
 Accounts Payable                                                                23,400
 Khizr ,capital (Owner's equity)                                                 180,000
                                                       203,400                   203,400

It is prepared in the order of Accounting Equation i.e. balance sheet. It serves as a working paper for
accountants. It should however be noted that it gives assurance only as to equality of debit and credit
amounts. It does not assure accuracy. For example if a transaction is altogether omitted from accounting
records, debits and credits of other transactions so recorded would be equal, but this particular
transaction which was omitted altogether, would not be detected by Trial balance.

    •   At the end of accounting period, a list of all ledger balances is prepared. This list is called trial
        Balance.

Trial balance is a listing of the accounts in your general ledger and their balances as of a specified date.
A trial balance is usually prepared at the end of an accounting period and is used to see if additional
adjustments are required to any of the balances. Since the basic accounting system relies on double-
entry bookkeeping, a trial balance will have the same total debit amount as it has total credit amounts.

    •   Both sides of trial balance i.e. Debit side and credit side must be equal. If both sides are not
        equal, there are some errors in the books of accounts.
    •   Trial balance shows the mathematical accuracy of the books of accounts.


                            Copyright© Virtual University of Pakistan                                     16
Financial Statement Analysis-FIN621                                                                VU


Limitations of Trial Balance

   1. Trial balance only shows the mathematical accuracy of the accounts.
   2. If both sides of trial balance are equal, books of accounts are considered to be correct. But this
      might not be true in all the cases.
   3. If any transaction is not recorded at all, trial balance can not detect the omitted transaction.
               • If any transaction is recorded in the wrong head e.g. if an expense is debited to an
                   assets account. Trial balance will not be able to detect that mistake too


                         Copyright© Virtual University of Pakistan                                   17
Financial Statement Analysis-FIN621                                                                      VU

                                                                                                    Lesson-5
                                ACCOUNTING CYCLE/PROCESS
                                                (Continued)

Preparing Balance Sheet from Trial Balance: We have assumed that the first month i.e. July was
taken up in setting up of the business and no business activity as such took place in this month. It means
there were no Revenues & Expenses and hence no Income Statement. Preparing Balance Sheet from
Trial balance: involves re-arranging of items or Accounts in the Trial Balance. What is done is that
Assets are taken on the left side and liabilities and owner’s equity on the right. This is the Account Form
of Balance Sheet. Alternate form is Report Form in which Assets are written above and liabilities and
owner’s equity are written below.


                                             Balance Sheet
                                         Khizr Property dealer
                                       For the month of July 2006
 Assets                            Rs.            Liabilities & Owner's Equity
                                                                                          Rs.
 Cash                              22,500            Accounts Payable                     23,400
 Accounts Receivable               9,500             Khizr, Capital (owner’s equity)      180,000

 Land                              130,000
 Building                          36,000
 Office Equipment                  5,400


 Total                             203,400           Total                                203,400

     It is to be seen that each of the 7 transactions during July, changed the Accounting Equation, and
hence each gave rise to new balance sheet. The question may arise as to why make journal & ledger
entries. The answer is that we have to have reasonable time-period at the end of which balance sheet
may be prepared. This time-period is Accounting Period which is usually one year. And during this
period individual transactions occurring daily are journalized and ledgerised i.e. posted in ledgers.

Assets are economic resources that are owned by a business and are expected to benefit future
operations. In most cases, the benefit to future operations comes in the form of positive future cash
flows. The positive future cash flows may come directly as the asset is converted into cash (collection of
a receivables) or indirectly as the asset is used in operating the business to create other assets that result
in positive future cash flows (building & land used to manufacture a product for sale). Assets may have
definite physical form such as building, machinery or stock. On the other hand, some assets exist not in
physical or tangible form, but in the form of valuable legal claims or right. Examples are accounts
receivables, investment in govt. bonds and patent rights etc.

Liabilities are debts and obligations of the business. The person or organization to which the debt is
owed is called creditors. All businesses have liabilities; even the most successful companies’ purchase
stocks, supplies and receive services on credit. The liabilities arising from such purchases are called
Accounts payable.

Rule of Debit and Credit for Assets and Liabilities

Assets (increase in assets is debit and decrease in asset is credit)

                            Copyright© Virtual University of Pakistan                                      18
Financial Statement Analysis-FIN621                                                                   VU

Liabilities (Increase in liability is credit and decrease in liability is debit)

Classification of Assets:

There are two types of assets:

1. Tangible Assets which have physical existence and can be seen or touched. It includes Fixed as
   well as Current assets.

2. Intangible assets which have no physical existence like goodwill, patents and copyrights etc.

       •   Fixed Assets – Are the assets of permanent nature that a business acquires, such as plant,
           machinery, building, furniture, vehicles etc. Fixed assets are subject to depreciation.

       •   Long Term Assets –These are the assets of the business that are receivable after twelve
           months of the balance sheet date. For example, if business has invested some money for two
           years in any saving scheme or has purchased saving certificates for more than one year, it is a
           long term asset.

       •  Current Assets – Are the receivables that are expected to be received within one year of the
          balance sheet date. Debtors, closing stock & all accrued incomes are the examples of Current
          Assets because these are expected to be received within one accounting period from the
          balance sheet date.
The year, in which long term asset is expected to be received, long term asset is transferred to
current assets in that year.

Classification of Liabilities

Capital – is the funds invested by the owners of the business. Business has a liability to return these
funds to the owner. We know that for the purpose of accounting, business is treated separately from its
owners. This is known as Separate Entity Concept i.e. Business is a separate entity. Therefore, if the
owner gives something (can be in form of Cash or Some other Asset) to the business then the business,
not only has to return the amount to the owner but it also has to give some return on that money. That is
why we treat Capital (Owners Funds) as a Liability.

Profit & Loss Account – The net balance of the profit and loss account i.e. either profit or loss also
belongs to the owners.
While explaining capital we said that the business has to give return to the owners. Now if the business
is managed successfully, then this return would be a Favorable figure (Profit). This return will,
therefore, be added to the Owners’ investment.
On the other hand, if the business is not managed successfully then this return would be an un-favorable
figure (Loss). It will, therefore, be deducted from the Owners’ Investment.

       •   Long Term Liabilities – These are the liabilities that will become payable after a period of
           more than one year of the balance sheet date. For example, if business has taken a loan from
           bank or any third person and it is payable after three years, it will be treated as a long term
           liability for the business.

       •   Current Liabilities – These are the obligations of the business that are payable within
           twelve months of the balance sheet date. Creditors and all accrued expenses are the examples
           of current liabilities of the business because business is expected to pay these back within one
           accounting period.
The year in which long term liability is to be paid back, long term liability is transferred to
current liability in that year.
                             Copyright© Virtual University of Pakistan                                  19
Financial Statement Analysis-FIN621                                                                          VU

Balance Sheet

It is a position statement that shows the standing of the organization in Monetary Terms at a Specific
Time.
Unlike Profit and Loss that shows the performance of the entity over a period of time, the Balance Sheet
shows the Financial State of Affairs of the entity at a given date. Balance sheet is the summarized
analysis in a ‘T’ form of all assets and liabilities of the entity, with liabilities listed on left hand side and
assets on right hand side. Asset is any owned physical object (tangible asset) or a right (intangible asset)
having economic value to the owner. Liability is an obligation of the business to deliver goods or to
provide a benefit in future.

Format of Balance Sheet (Account Form)

Name of the Entity
Balance Sheet
As At-------
Liabilities                                Amount        Assets                                    Amount
                                            Rs.                                                    Rs.
Capital                                                  Fixes Assets                              75000
100000
                                           115000        Long Term Assets                          20000
Add Profit       and    loss     Account
15000                                      50000         Current assets                            80000

Long Term Liabilities                      10000

Current liabilities

Total                                      175000        Total                                     175000

Format of Balance Sheet (Report Form)

Name of the Entity
Balance Sheet
As At-------
PARTICULARS                                                                           Amount        Amount
                                                                                      Rs.           Rs.
ASSETS

Fixes Assets                                                                                         75000
Long Term Assets                                                                                     20000
Current Assets                                                                                       80000


Total                                                                                               175000
LIABILITIES

Capital                                                                               100000
Profit                                                                                 15000        115000

Long Term Liabilities                                                                                50000
Current Liabilities                                                                                  10000
Total                                                                                               175000

                               Copyright© Virtual University of Pakistan                                      20
Financial Statement Analysis-FIN621                                                                      VU


Illustration # 1

The following is the Trial Balance extracted from the books of Naeem & Sons as on 30/06/2007.
Prepare a profit & loss account & balance sheet for the year ended June 30, 2007.

  Particulars                                                               Dr.              Cr.
 Sales                                                                                       100,000
 Purchases                                                                  45,000
 purchase return                                                                                3,000
 Salaries                                                                    12,000
 Rent                                                                         5,000
 Debtors                                                                     25,000
 Creditors                                                                                     16,000
 Capital                                                                                      368,000
 Plant & machinery                                                          400,000
  Grand Total                                                                  487,000           487,000

Financial Statements

    •   Different reports generated from the books of accounts to provide information to the relevant
        persons.
    •   Every business is carried out to make profit. If it is not run successfully, it will sustain loss. The
        calculation of such profit & loss is probably the most important objective of the accounting
        function. Such information is acquired from “Financial Statements”.
    •   Financial Statements are the end product of the whole accounting process. These show us the
        profitability of the business concern and the financial position of the entity at a specified date.
    •    The most commonly used Financial Statements are ‘profit & loss account’ ‘balance sheet’ &
        ‘cash flow statement’.

Income & Expenditure Vs Profit & Loss Account

    •   Income and Expenditure Account is used for Non-Profit Organizations like Trusts, NGOs while
    •   Profit and Loss Account is used for Commercial organizations like limited companies.

Profit & Loss Account

    •   Profit & Loss account is an account that summarizes the profitability of the organization for a
        specific accounting period.
    •   Profit & Loss account has two parts:
    o   First part is called Trading account in which Gross Profit is calculated. Gross profit is the
        excess of sales over cost of goods sold in an accounting period. In trading concern, cost of
        goods sold is the cost of goods consumed plus any other charge paid in bringing the goods in
        salable condition. For example, if business purchased certain items for resale purpose and any
        expense is paid in respect of carriage or bringing the goods in store (transportation charges).
        These will also be grouped under the heading of ‘cost of goods sold’ and will become part of its
        price. In manufacturing concern, cost of goods sold comprises of purchase of raw material plus
        wages paid to staff employed for converting this raw material into finished goods plus any other
        expense in this connection.
    o   2nd part is called Profit & Loss account in which Net Profit is calculated. Net Profit is what is
        left of the gross profit after deducting all other expenses of the organization in a specific time
        period.


                           Copyright© Virtual University of Pakistan                                       21
Financial Statement Analysis-FIN621                                                                    VU

How to prepare Profit & Loss Account?

   •   One way is to write down all the Debit and Credit entries of Income and Expense accounts in
       the Profit and Loss Account. But it is not sensible to do so.
   •   The other way is that we calculate the net balance or we can say Closing Balance of each
       income and expense account. Then we note all the credit balances on the credit side and all the
       debit balances on the debit of profit and loss account.
   •   If the net balance of profit and loss is Credit (credit side is greater than debit side) it is Profit
       and if the net balance is Debit (Debit side is greater than credit side) it is a loss.

Income, Expenditure, And Profit & Loss

   •   Income is the value of goods and services earned from the operation of the business. It includes
       both cash & credit. For example, if a business entity deals in garments. What it earns from the
       sale of garments, is its income. If somebody is rendering services, what he earned from
       rendering services is his income.
   •   Expenses are the resources and the efforts made to earn the income, translated in monetary
       terms. It includes both expenses, i.e., paid and to be paid (payable). Consider the above
       mentioned example, if any sum is spent in running the garments business effectively or in
       provision of services, is termed as expense.
   •   Profit is the excess of income over expenses in a specified accounting period.

                                Profit= Income-expenses

In the above mentioned example, if the business or the services provider earn Rs. 100,000 & their
expenses are Rs. 75,000. Their profit will be Rs. 25,000 (100,000-75,000).
    • Loss is the excess of expenses over income in a specified period of time. In the above example,
        if their expenses are Rs. 100,000 & their income is Rs. 75,000. Their loss will be Rs. 25,000.

Rules of Debit & Credit

   •   Increase in expense is Debit    (Dr.)
   •   Decrease in expense is credit   (Cr.)
   •   Increase in income is credit    (Cr.)
   •   Decrease in income is Debit     (Dr.)

Classification of Expenses

   •   It has already been mentioned that a separate account is opened for each type of expense.
       Therefore, in large business concerns, there may be a large number of accounts in
       organization’s books
   •   . As profit & loss account is a summarized record of the profitability of the organization. So,
       similar accounts should be grouped for reporting purposes.

   •   The most commonly used groupings of expenses are as follows:
          o Cost of goods sold
          o Administration expenses
          o Selling expenses
          o Financial expenses

   •   Cost of goods sold (CGS) is the cost incurred in purchasing or manufacturing the product,
       which an organization is selling plus any other expense incurred in bringing the product in
       saleable condition. Cost of goods sold contains the following heads of accounts:

                          Copyright© Virtual University of Pakistan                                      22
Financial Statement Analysis-FIN621                                                               VU

            o   Purchase of raw material/goods
            o   Wages paid to employees for manufacturing of goods
            o   Any tax/freight is paid on purchases
            o   Any expense incurred on carriage/transportation of purchased items.

    •   Administrative expenses are the expenses incurred in running a business effectively. Main
        components of this group are:
            o Payment of utility bills
            o Payment of rent
            o Salaries of employees
            o General office expenses
            o Repair & maintenance of office equipment & vehicles.
    •   Selling expenses are the expenses incurred directly in connection with the sale of goods. This
        head contains:
            o Transportation/carriage of goods sold
            o Tax/freight paid on sale
            o If the expense head ‘salaries’ includes salaries of sales staff then it will be excluded
                from salaries & appear under the heading of ‘selling expenses’.

            o   Financial expenses are the interest paid on bank loan & charges deducted by bank on
                entity’s bank accounts. It includes:
            o   Mark up on loan
            o   Bank charges

Receipt & Payment Account

A receipt & payment account is the summarized record of actual cash receipts and actual cash payment
of the organization for a given period of time. This is a report that provides cash movement during the
reported period. In other words, it can be defined as the summarized record of the cash book for a
specific period.

Receipt & Payment Vs Profit & Loss Account

    o   Receipt & payment account is the summarized record of actual cash receipts and actual cash
        payment during the period while profit & loss account also includes Receivable and Payable.

    o   Income & Expenditure Vs Profit & Loss Account

    o   These are two similar terms. Only difference between these two terms is that income &
        expenditure account is prepared for non profit oriented organizations, e.g. Trusts, NGO’s,
        whereas profit & loss account is prepared in profit oriented organizations, e.g. Limited
        companies, Partnership firms etc.
    o   In case of Income and Expenditure account, Surplus/Deficit is to be find and in case of Profit
        and loss account, profit or loss is to be found.


                          Copyright© Virtual University of Pakistan                                 23
Financial Statement Analysis-FIN621                                                                  VU

A sample of Profit and Loss Account

                                       Name of the Entity
                                     Profit and Loss Account
                                    For the period Ending ----
DEBIT                                  CREDIT
PARTICULARS                          AMOUNT         PARTICULARS                       AMOUNT
                                     Rs.                                              Rs.
Cost of sale                         60,000         Income                            100,000
Gross profit c/d                     40,000
(Income – cost of sales)
Total                                100,000        Total                             100,000
Admin expenses                       15,000         Gross profit b/d                  40,000
Selling expenses                     5,000
Financial expenses                   5,000
Net profit                           15,000
(Gross profit – expenses)
Total                                40,000         Total                             40,000

Calculations of Gross profit and Net profit

    Gross profit = Income – cost of sales
                  = 100000-60000
                  = 40000
    Net profit = Gross profit – Expenses
                  = 40000 – (15000+ 5000+5000)
                  = 15000

 A sample of Income Statement

                                 Name of the Entity
                                 Income statement
                                 For the period Ending ----
PARTICULARS                                      AMOUNT                   AMOUNT
                                                 Rs.                      Rs
Income/Sales/Revenue                                                      100000
Less: Cost of sales                                                       (60000)
Gross profit                                                              40000
Less: Administration expenses                     15000
      Selling expenses                            5000
      Financial expenses                          5000                    (25000)
Net profit                                                                15000

Recognition of Income and Expenditure Account:

Income – should be recognized / recorded at the time when goods are sold or services are rendered.
Expenses – should be recognized / recorded when benefit relating to that expense has been drawn.
Income Statement and Net Income

           Income Statement summarizes operating results of a business by matching revenues with
expenses over the same accounting period.

                            Copyright© Virtual University of Pakistan                                24
Financial Statement Analysis-FIN621                                                                    VU


               Net income is the increase in owner’s equity resulting from profitable operations of a
business. This is accompanied by increase in total assets, (but not necessarily cash) or decrease in total
liabilities. It may happen that a profitable business may also run short of cash, because the profit that it
earns is tied up in other assets i.e. Accounts Receivables, fixed assets etc or else, it was used in paying
out its obligations like Accounts Payable etc. Net loss is the corresponding decrease in owner’s equity.

Elements of Income Statement

Revenues: This is defined as sale price of goods sold and services rendered during an           accounting
period.

Expenses: These constitute Cost to the business of the goods and services used in business operations
during the same accounting period. In other words, these are “cost of doing business”. Just as in
Balance Sheet we have sub-elements or sub-Accounts, in Income Statement also there are sub-
elements/sub-Accounts i.e. difference sources of Revenues, different expenses like cost of good sold,
depreciation expenses, interest expense etc.

Accrual Basis of Revenue & Expense Accounting

              Revenue Recording is done on Realization Principle. In this case, the date of rendering
services or date of delivery of good sold is considered as the date of earning revenue. For example, if
services are rendered in January and actual receipt of revenue/fee takes place in February i.e. after one
month as per agreement, still the revenue would be recorded in the month of January since it was
“earned” in January.

               Expense Recording is done on matching principle. This means that revenues are offset by
all expenses incurred in producing those revenues, pertaining to a particular accounting period. It would
thus be seen that there is cause-and-effect relationship between revenues and expenses. For example,
June salaries are paid in July but these have to be recorded as salaries expense for June. It must also be
noted that Revenue & cash Receipts and Expense & cash payments are different. The two can happen
before, after or during the accounting period.

             Dr. & Cr. Rules for Recording Revenues and Expenses are the same as those for Owner’s
equity or Capital Account.

Expenses are the costs of the goods and services used up in the process of earning revenue. Examples
include the cost of employee’s salaries, advertising, rent, utilities, and the gradual wearing-out
(depreciation) of such assets as buildings, automobiles, and office equipment. All these costs are
necessary to attract and serve customers and here by earn revenue. Expenses are often called the “costs
of doing business” that is, the cost of the various activities necessary to carry on a business.

An expense always causes a decrease in owner’s equity. The related changes in the accounting equation
can be either (1) a decrease in assets, or (2) an increase in liabilities. An expense reduces assets if
payment occurs at the time that the expense is incurred. If the expense will not be paid until later, as for
example, the purchase of advertising services on account, the recording of the expense will be
accompanied by an increase in liabilities.


                           Copyright© Virtual University of Pakistan                                     25
Financial Statement Analysis-FIN621                                                                     VU

                                                                                                    Lesson-6

                                ACCOUNTING CYCLE/PROCESS
                                             (Continued)

Business transactions during August, 2006

                 Now let us suppose that during the month of August, actual business operations
commenced and Khizr provided services to clients at the agreed commission/fee rate of 2% of rental
value of property. Suppose rental value of property during August was Rs.532, 000. Commission/fee
earned at the rat of 2% comes to Rs.10, 640. Commission actually received (in cash) during August was
Rs.5, 000, the rest was to be paid later.

       Provided services to clients at the agreed commission/fee rate of 2% of rental value of property.

    Rental value of property during Aug:                                Rs.532, 000

       Rental Value                                                   = Rs.532, 000
       Commission (532,000 x 2%)                                      = Rs. 1 0,640
       Actual Cash Received                                           = Rs. 5,000

Date      Description                                L/F        Dr.                   Cr.

Aug       Cash Account                                          5,000
          Accounts Receivable                                   5,640
                Commission Received                                                   10,640
          Commission Income Received

   Advertising expenses (paid in advance) Rs.645.
Date                  Description           L/F                       Dr.                     Cr.
                            Cash Account                                                      645
                      Advertising expense
                      paid

   •   Salaries for Aug (to be paid in September) Rs.7, 400.

Date       Description                              L/F          Dr.                  Cr.
           Salaries Expense                                      7,400
              Salaries Payables                                                       7,400
           Accrued salaries for the month of
           August


       Telephone bill for Aug (to be paid in September) Rs.400.

Date        Description                                   L/F           Dr.              Cr.

            Utilities Expense                                           400
               Utilities bill Payables                                                   400
            Accrued telephone bill
                           Copyright© Virtual University of Pakistan                                     26
Financial Statement Analysis-FIN621                                                                 VU


                Expenses were:-
                Advertising expenses (paid in advance)                       Rs. 645
                Salaries for Aug (to be paid in September)                   Rs.7, 400
                Telephone bill for Aug (to be paid in September)             Rs. 400

                The above is incomplete list of Expenses. There are certain invisible expenses
amounting to Rs.195 (in which no cash is involved), which are recorded at the end of accounting period.
Before we take these up, let us distinguish between Expenditure and Expenses.

Expenditure Vs Expenses

Expenditure: It is the cost benefiting or spreading over two or more accounting periods. Expense is the
portion of Expenditure for one accounting period only.

Examples: Expenditure on fixed assets is incurred in lump sum. Then there are pre-paid costs e.g.
insurance, pre-paid rent, for more than one year/accounting period. It may be noted that expenditure on
advertisements, employees training, are directly charged to expenses because in these cases, the number
of accounting periods over which revenue is likely to be produced (or increased) because of these, are
not readily estimable.

    •   Incomplete list of Expenses: Invisible expenses (non cash involved), recorded at the end of
        accounting period.

Date       Description                                    L/F          Dr.               Cr.

           Depreciation Expense-Building                               150
           Depreciation Expense-Equipment                              45
              Accumulated Depreciation                                                   195
           Depreciation Expenses

Invisible Expenses

Cost value of Building                                          = Rs. 36,000
Estimated useful life                                           = 20 years
Expense for one month will be calculated as follows:
                                                                = 36,000 x 1/240
                                                                = Rs. 150 per month

This Rs. 150 is the portion of expenditure of Rs.36, 000. This expense is technically called Depreciation

Note: Land is not depreciated

Value of Office Equipment                                 = 5,400
Estimated useful life                                     = 10 years
The calculation of expense on equipment will be
Calculated as follows:                                    = 5,400 X 1/120
                                                          = Rs. 45
This Rs. 45 is technically called depreciation on Office Equipment.

Pre-paid costs e.g. Insurance, Pre-paid rent, will be recorded as follows:


                           Copyright© Virtual University of Pakistan                                  27
Financial Statement Analysis-FIN621                                                            VU

Date       Description                                   L/F        Dr.               Cr.

           Prepaid Rent                                             12,000
                  Cash Account                                                        12,000

           Rent paid in advance
           Rent Expense                                             1,000
                  Prepaid Rent                                                        1,000
           Recording rent expense

                                           Income Statement
                                 For the period ending August 31, 2006
Revenues
                                                                          Rs.
                Sales Commission earned.                                  10,640
Expenses
                Advertising expenses.                       645
                Salaries expenses.                         7,400
                Telephone expenses.                          400
                Depreciation expense: building               150
                Depreciation expense: office equipment        45
Total Expense                                                               8,640
                Net Income                                                   2000


With this background, let us now move on to the fifth step in the Accounting Cycle.


                          Copyright© Virtual University of Pakistan                            28
Financial Statement Analysis-FIN621                                                                    VU

                                                                                                  Lesson-7
                               ACCOUNTING CYCLE/PROCESS
                                               (Continued)


e) Making adjusting entries: These are the Entries required for those transactions which affect
revenues or expenses of more than one accounting period.

                Immediate recording of every event in some cases is not practical e.g. raw material,
office supplies, depreciation. Journal entries of such expenses are recorded at the end of accounting
period and are called adjusting entries. Regular journal entries (chronological) are recorded in blue and
adjusting entries are recorded in red.

Adjusting Entry to record Expenses on Fixed Assets

        The expenditure use to acquire Fixed Assets is spread over a number of Accounting periods.
        The spreading of that expenditure over a number of Accounting periods is called Expense for
        that period.
        Adjusting entry is also required to record Prepaid Costs.
        Expenses are the expired portion of Assets.

        Office supplies and Raw material are treated at the end of Accounting period.
        The balance of Office supplies & Raw materials is calculated as follows:


Opening balance
Add: Purchases
Less: Closing balance
        Prepaid Costs are initially taken as Asset.
        Pre paid costs, if consumed entirely during Accounting period are charged directly to expense

    Types of Adjusting Entries

        i)     Entries to distribute expenditure benefiting more than one accounting period             e.g.
               fixed assets, pre-paid costs (if for more than one year). Pre-paid costs are initially taken
               as Asset and corresponding portion for an accounting period is reduced there from. In
               the case of office supplies, raw materials, the formula is: - opening balance + purchases-
               closing balance. This would give the amount/extent of official supplies, raw materials
               consumed during the accounting period. It must also be noted that pre paid costs, if
               consumed entirely during accounting period, are charged directly to expense.
    Fixed assets are those which are used for more than one Accounting period.

        ii)     Entries to distribute un-earned revenue i.e. revenue collected in advance (deferred
                revenue). It is first recorded as liability, and is gradually reduced in the subsequent
                accounting period.

        iii)    Entries to record accrued expenses e.g. unpaid salaries, interest payable, to be paid in
                the subsequent accounting period.

        iv)     Entries to record accrued revenues. These are first recorded as Assets i.e. Revenue
                Receivable. For example if rendering of services/delivery of goods is spread over a
                number of accounting periods, and billing is to be done at the completion of rendering
                services or delivering goods, then corresponding adjusting entry for each accounting
                period is made for Revenue Receivable, but not yet earned.

                           Copyright© Virtual University of Pakistan                                     29
Financial Statement Analysis-FIN621                                                                  VU


                                          Khizr Property dealer
                                              Trial Balance
                                       For the month of July 2006
 Particulars                           Rs.                               Rs.
 Cash                                  22,500
 Accounts Receivable                   9,500
 Land                                  130,000
 Building                              36,000
 Office Equipment                      5,400
 Accounts Payable                                                        23,400
 Khizr, Capital (owner’s equity)                                         180,000
 Total                                 203,400                           203,400

Adjusted entries are all related to accrual accounting, as would be seen from the very description of each
adjusting entry given above.

    f) Preparing adjusted trial balance:

   This is the sixth step in Accounting Cycle. In this, we take into account the adjusting entries made
   earlier in step 5 (e).
         Adjusting entries are journalized and posted, i.e. recorded in journal and posted in ledger.
   Accumulated depreciation would double after second month, in the example of adjusted trial
   balance given above. In the above example, estimated life of building is taken as 20 years and that
   of office equipment as 10 years, which makes the monthly figure of the use of these assets as
   Rs.150 and Rs.45 respectively. Other transactions during August 2006 changed balances of cash,
   A/Cs Receivable, A/Cs payable. Reverting to the earlier reference about invisible expenses of
   Rs.195, in the Income Statement, these were depreciation expenses of building amounting to Rs.150
   and depreciation expenses of office equipment amounting to Rs.45.
The adjusting entries which are recorded in Journal at the end of Accounting period are adjusted in,
Adjusted Trial Balance.


                                          Khizr Property Dealer
                                          Adjusted Trial Balance
                                             August 31,2006
 Particulars                                          Dr.                           Cr.
 Cash.                                                16,105
 Accounts Receivable.                                 18,504
 Land.                                                130,000
 Building.                                            36,000
 Accumulated depreciation: building.                                              150
 Office equipment.                                    5,400
 Accumulated Dep: office equipment.                                               45
 Accounts Payable.                                                                23,814
 Owner’s equity.                                                                  180,000
 Sales commission earned.                                                         10,640
                           Copyright© Virtual University of Pakistan                                   30
Financial Statement Analysis-FIN621                                             VU

 Advertising expenses.                               645
 Salaries expenses.                                  7,400
 Telephone expenses.                                 400
 Depreciation expenses: building.                    150
 Depreciation expenses: office equipment.            45
                                                     214,649          214,649


The above is adjusted trial balance as on August 31, 2006.


                          Copyright© Virtual University of Pakistan             31
Financial Statement Analysis-FIN621                                                              VU

                                                                                            Lesson-8
                                ACCOUNTING CYCLE/PROCESS
                                                (Continued)

Pre-paid costs e.g. Pre-paid rent, will be recorded as follows:
Date             Description                      L/F       Dr.            Cr.

                 Prepaid Rent                               12,000
                       Cash Account                                        12,000
                 Rent paid in advance

Pre-paid costs e.g. Pre-paid rent, will be recorded as follows:
Date             Description                       L/F       Dr.           Cr.
                 Rent Expense                                 1,000
                       Prepaid Rent                                        1,000
                 Recording rent expense

Pre-paid costs e.g. Pre-paid Insurance will be recorded as follows:
Date             Description                      L/F        Dr.           Cr.
                 Prepaid Insurance                            12,000
                       Cash Account                                        12,000
                 Insurance paid in advance


Pre-paid costs e.g. Pre-paid Insurance will be recorded as follows:
Date             Description                      L/F        Dr.           Cr.
                 Insurance Expense                            1,000
                    Prepaid Insurance                                      1,000

                 Recording Insurance expense

g) Preparing Financial Statements
              Now we come to the all-important step of preparing Financial Statements from
Accounting Records. Income Statement is prepared from Adjusted Trial Balance, first. Then Statement
of Owner’s equity between Income Statement and Balance Sheet is prepared. For this, Net profit/loss in
Income Statement is added to/ subtracted from owner’s equity in “Owner’s equity Statement”, and the
total/net is then transferred to Balance Sheet. After the preparation of Balance Sheet, the fourth
Financial Statement i.e. Cash flow Statement is prepared separately.

As a practical illustration, let us prepare these Financial Statements.

 Income Statement
 For the period ending August 31, 2006


 Particulars                                       Rs.                    Rs.
 Revenues
 Sales Commission earned.                                                 10,640

                            Copyright© Virtual University of Pakistan                              32
Financial Statement Analysis-FIN621                                                                  VU

 Expenses
 Advertising expenses.                           645
 Salaries expenses.                              7,400
 Telephone expenses.                             400
 Depreciation expense: building                  150
 Depreciation expense: office equipment          45
                                                                         8,640
 Net Income.                                                             2,000

The revenue and expenses shown in the income statement are taken directly from the company’s
adjusted trial balance. Our measurement of net income is not absolutely accurate or precise, because of
the assumptions and estimates in the accounting process. An income statement has certain limitations.
Remember that the amount shown for depreciation expense or based on estimates of the useful lives of
the company’s building and office equipment. Also the income statement includes only those events that
have been evidence by business transactions. Alternative titles for the income statement include
earnings statement, statement of operations, and profit and loss statement. However, income statement
is by far the most popular term for this important financial statement. In summary, we can say that an
income statement is used to summaries the operating results of business by matching the revenue
earned during a given time period with the expenses incurred in obtaining that revenue.

Note: This is case of service business, and sole proprietorship. In the case of Merchandise
      & Manufacturing business:

Net Income=Sales–Cost of Goods sold–Other expenses.

ii) Owner’s equity Statement

                Owner’s equity which was Rs.180, 000 on July 31, 2006 increases by Rs.2000 due to
profitable operations during the month of August, 2006. Net income is transferred to owner’s equity
statement, which is further transferred to Balance Sheet. Correspondingly, there would be either
increase in Assets (Left) side of the Accounting Equation (or Balance Sheet), or decrease in Liabilities
(Right) side, to maintain balance.
         Statement of Owner’s equity summarizes increase/decrease in owner’s equity during
accounting period. It is increased due to profit and additional investment by the owner. It is decreased
due to loss and withdrawal/drawing by the owner.

 Statement of Owner’s equity for the month of August, 2006
 Particulars                                                                          Rs.
 Khizr, capital July 31, 2006                                                 180,000
 Add: Net income for August, 2006                                             2,000
 Additional investment by owner                                               4,000
 Sub total                                                                    186,000
 Less withdrawal/drawing by owner                                             3,000
 Owner’s equity August 31, 2006                                               183,000

   III. Balance Sheet

        The balance sheet lists the amounts of the company’s assets, liabilities, and owner’s equity at
        the end of accounting period. The balances of the assets and liability accounts are taken directly
                           Copyright© Virtual University of Pakistan                                   33
Financial Statement Analysis-FIN621                                                                      VU

          from the adjusted trial balance. Cash is listed first among the assets. It is often followed by such
          asset as marketable securities, short-term notes receivable, accounts receivable, inventories, and
          supplies. These are the most common examples of current assets. The term “current assets”
          includes cash and those assets that will be quickly converted to cash or used up in operations
          .
                                           Khizr Property Dealer
                                               Balance Sheet
                                           As on August 31,2006


 Assets                        Rs.             Rs.            Liabilities & Equity           Rs.
 Cash                                          16,105         Accounts Payable               23,814
 Accounts Receivables                          19,504         Owner’s equity                 183,000
 Land                                          130,000
 Building                      36,000
 Less Accumulated Dep:         150             35,850
 Office Equipment              5,400
 Less Accumulated Dep:         45              5,355

 TOTAL                                         206,814        TOTAL                          206,814


              -   Owner’s equity obtained from Owner’s equity statement


                             Copyright© Virtual University of Pakistan                                     34
Financial Statement Analysis-FIN621                                                                 VU

                                                                                               Lesson-9
                               ACCOUNTING CYCLE/PROCESS
                                              (Continued)


Other steps in the Accounting Cycle after the preparation of Financial Statements are:-

        h) Closing entries in Accounting Cycle.

        As previously stated, revenues increase owner’s equity, and expenses and withdrawals by the
owner decrease owner’s equity. If the only financial statement that we needed was a balance sheet, these
changes in owner’s equity could be recorded directly in the owner’s capital account. However, owners,
managers, investors, and others need to know amount of specific revenues and expenses, and the
amount of net income earned in the period. Therefore we maintain separate ledger account to measure
each type of revenue and expense, and other owner’s drawings.

              The revenue, expense, and drawing accounts are called temporary accounts, are nominal
accounts, because they accumulate the transactions of only one accounting period. At the end of this
accounting period the changes in owner’s equity accumulated in these temporary accounts are
transferred into the owner’s capital account. This process serves two purposes. First it updates the
balance of the owner’s capital account for changes in owner’s equity account for changes in owner’s
equity occurring during the accounting period. Second, it returns the balances of the temporary accounts
to zero, so that they are ready for measuring the revenue, expenses, and drawings of the next accounting
period.
                The owner’s capital account and other balance sheets are called permanent or real
accounts, because their balances continue to exist beyond the current accounting period. The process of
transferring the balances of the temporary account into the owner’s capital account is called closing the
accounts. The journal entries made for the purpose of closing the temporary accounts are called closing
entries.
                Revenue and expense accounts are closed at the end of each accounting period by
transferring their balances to a summary account called income summary. When the credit balance of
the revenue accounts and the debit balances of expense accounts have been transferred into one
summary account, the balance of this income summary will be the net income or net loss for the period.
If the revenue (credit balances) exceeds the expenses (debit balances), the income summary account will
have a credit balance representing net income. Conversely, if expenses exceed revenue, the Income
Summary will have a debit balance representing net loss. This is consistent with the rule that increases
in owner’s equity are recorded by credits and decreases are recorded by debits.

Closing Entries for Revenue Accounts

                  Revenue accounts have credit balances. Therefore, closing a revenue account means
transferring its credit balance to the Income Summary account. This transfer is accomplished by a
journal entry debiting the revenue account an amount equal to its credit balance, with an offsetting
credit to the Income Summary account. The debit portion of this closing entry returns the balance of the
revenue account to zero; the credit portion transfers the former balance of the revenue account into the
Income Summary account.

Closing Entries foe Expense Accounts

                 Expense accounts have debit balances. Closing an expense account means transferring
its debit balance to the Income Summary account. The journal entry to close an expense account,
therefore, consists of a credit to the expense account in an amount equal to its debit balance, with an
offsetting debit to the Income Summary account.


                           Copyright© Virtual University of Pakistan                                  35
Financial Statement Analysis-FIN621                                                                   VU

Closing the Income Summary Account

                Due to increase in net income owner’s equity increases. The credit balance of Income
Summary account is, therefore transferred to the owner’s equity account. Conversely if the expenses of
a business are larger than its revenue, the Income Summary account will have a debit balance,
representing a net loss for the accounting period .In this case, the closing of the Income Summary
account requires a debit to the owner’s capital account and an offsetting credit to the Income Summary
account. The owner’s equity will, of course, be reduced by the amount of the loss debited to the capital
account.
Note that the Income Summary account is used only at the end of the period when the accounts are
being closed. The Income Summary account has no entries and no balance except during the process of
closing the accounts at the end of accounting period.

Closing the Owner’s Drawing Account

               Withdrawals of cash or other assets by the owner are not considered an expense of the
business and, therefore, are not a factor in determining the net income for the period. Since drawings by
the owner do not constitute an expense, the owner’s drawing account is closed not into the Income
Summary account but directly to the owner’s capital account.
Revenue, Expense and Drawing (by owner) change owner’s equity. These are temporary capital
accounts. To make these Accounts ready for recording events of next accounting periods, we take the
following steps:-

        Close (transfer) Revenue Accounts to Income Summary Account.
        Close (transfer) Expense Accounts to Income Summary Account.
        Close (transfer) Income Summary Account to Owner’s Equity Account or Capital Account.
        Close Drawing Account directly to Capital Account.

Debit and credit entries of course are involved in journal and ledger.

            i)        Prepare after-closing trial balance. In many cases, another trial balance is prepared
                      after closing entries have been recorded in journal and posted in ledger.

                                                Summary
Steps in Accounting Cycle:

The accounting procedures in the accounting cycle may be summarized as follows

                 1.   Journalize Transactions
                 2.   Post to Ledger Accounts
                 3.   Prepare A Trial Balance
                 4.   End of Period Adjustments
                 5.   Prepare an Adjusted Trial Balance
                 6.   Prepare Financial statements
                 7.   Journalize and Post Closing Entries
                 8.   Prepare an After Closing Trial Balance


                            Copyright© Virtual University of Pakistan                                   36
Financial Statement Analysis-FIN621                                                              VU

                                                                                           Lesson-10
                                     FINANCIAL STATEMENTS
Income Statement
          A typical and Standard Income Statement and Balance Sheet of a manufacturing concern
would be as follows:-

INCOME STATEMENT/PROFIT & LOSS ACCOUNT
MOOSA & CO. LTD
FOR/DURING THE PERIOD 2005-06
                                                                Rs. in _______
   Net Sales *                                                          100
   Cost of Goods Sold *
         Raw material                                  30
          Salaries & wages (direct Labour)             10
          Stores & spares                               5
          Utilities                                     5
          Depreciation                                  5
          Others                                        5
                                                       ____             _____
          Total                                                          60
          Gross Profit (loss)                             40
_______________________________________________________________________
* Net Sales = Gross Sales – Sales returns – Sales allowances/discounts.
* Cost of Goods sold = Cost of production of goods actually sold; also called “cost of sales”: largest
expense item.


       Operating expenses

                Selling & admin                        5

                Advertising                            5

                Depreciation & others                  5

                Total                         15
                                              ____
          Operating Profit (EBIT)             25
______________________________________________________________________
EBIT: Earning before Interest and Taxes.

   Other expenses *

   Financial charges i.e. interest             5
   Loss on sale of assets                      1
   Purchase of goodwill                        1
   Total                                                    7___
   Profit before tax (EBT)                                 18
   Provision for tax                           5
   Profit after tax                                        13

                            Copyright© Virtual University of Pakistan                              37
Financial Statement Analysis-FIN621                                                                  VU

    Other income *
    Investment gains                                   7
    Net Profit                                                    20
                                                                ===== (bottom line)

  Dividend paid                                                    5

  Retained earnings                                             15
  (Added in shareholder’s equity and carried forward to Balance Sheet)
________________________________________________________________
* Other expenses: also called non-operating expenses.
* Other income: Dividend revenue, Interest revenue, Gain on Assets Sales etc.
  The above is called Multiple – Step Income Statement.

Special items: These are one-time items that will not recur in the future, and are disclosed separately on
Income Statement. Examples are: discontinued operations (firm selling a major portion of its business),
extra ordinary transactions (unusual in nature), and cumulative effect of changes in accounting methods
of Inventory and Depreciation.

Illustration # 1

The following Trial Balance has been extracted from the books of ABC Company. on 30-06-2002.
From this, prepare an Income Statement and Balance Sheet for the year ended 30-06-2002.

           Particulars                                                 Dr.          Cr.
           Sales                                                                    200,000
           Purchases                                                   180,000
           purchase return                                                          2,500
           Office salaries                                             3,500
           Furniture & Fixture                                         16,000
           Office Equipment                                            11,000
           Rent                                                        5,000
           Accounts Payable(creditors)                                              28,000
           Sales Salaries                                              3,000
           Freight & custom duty on purchases                          6000
           Repair of office equipment                                  2,000
           Accounts Receivable(debtors)                                52,000
           Freight on sales                                            1,000
           Capital                                                                  41,500
           Cash in hand                                                37,000
           Loan from bank(for three years)                                          50,000
           Bank charges                                                500
           Interest on loan                                            5,000
            Grand Total                                                322,000      322,000


                           Copyright© Virtual University of Pakistan                                   38
Financial Statement Analysis-FIN621                                                              VU

Solution

  BC Company.
   ofit & Loss Account for the year ended June 30, 2002.
                                      Rs.                                                 Rs.
                                                     Sales                                200,000
    Purchases                         180,000        Purchase return                      2,500
    Freight,     custom    duty   on
    purchases                         6,000
    Gross Profit                      16,500
                                      202,500                                             202,500
    Salaries                           3,500         Gross Profit                         16,500
    Rent                              5,000
    Repair of office equipment         2,000
    Sales salaries                    3,000
    Freight on sales                   1,000
    Interest on loan                   5,000
    Bank charges                       500
                                                     Net loss                             3,500
     Total                            20,000                                              20,000


   ILLUSTRATION #2

   Following trial balance has been extracted from the books of Hassan Manufacturing Concern on June
   30, 2002.

             Hassan Manufacturing Concern
             Trial balance
             As on June 30, 2002
             Particulars                                               Amount      Amount
                                                                       Dr. (Rs.)   Cr. (Rs.)
             Raw Material stock Jul. 01, 2001                          35,500
             Work in process Jul. 01, 2001                             42,000
             Finished goods stock Jul. 01, 2001                        85,000
             Raw material purchased                                    250,000
             Wages                                                     180,000
             Freight inward                                            12,000
             Plant and machinery                                       400,000
             Office equipment                                          45,000
             Vehicles                                                  200,000
             Acc. depreciation Plant                                               195,200
             Acc. depreciation Office equipment                                    12,195
             Acc. depreciation Vehicles                                            97,600
             Factory overheads                                         125,000
             Electricity                                               80,000
             Salaries                                                  140,000
             Salesman commission                                       120,000
             Rent                                                      200,000
             Insurance                                                 150,000
             General Expense                                           60,000
             Bank Charges                                              8,500
                            Copyright© Virtual University of Pakistan                               39
Financial Statement Analysis-FIN621                                                                 VU

          Discounts Allowed                                           20,000
          Carriage outward                                            35,000
          Sales                                                                    1,500,000
          Trade Debtors                                               250,000
          Trade Creditors                                                          220,000
          Bank                                                        165,000
          Cash                                                        110,000
          Drawings                                                    175,000
          Capital July 01, 2001                                                    863,005
          Total                                                       2,888,000    2,888,000

Notes:
   • Stock on June 30, 2002.
          o Raw Material                       42,000
          o Work in Process                            56,500
          o Finished Goods                     60,000
   • 50% of electricity, insurance and salaries are charged to factory and balance to office.
   • Depreciation to be charged on Plant & Machinery at 20%, Office Equipment at 10% and
       Vehicles at 20%on WDV.
   • Write off bad debts Rs. 30,000.
   • All the wages are direct.


Required:
You are required to prepare profit and loss account for the year and balance sheet as on june30, 2002.

SOLUTION

Profit & Loss Account


     Hassan Manufacturer Concern

     Profit and Loss Account
     For the Year Ending June 30, 2002
                    Particulars                       Note                        Amount Rs.

     Sales                                                                        1,500,000
     Less: Cost of Goods Sold                           1                         796,960

     Gross Profit                                                                 703,040
     Less: Administrative Expenses                      2                         518,761
     Less: Selling Expenses                             3                         155,000

     Operating Profit                                                             29,279

     Less: Bank Charges                                                           8,500

     Net Profit Before Tax                                                        20,779


                           Copyright© Virtual University of Pakistan                                     40
Financial Statement Analysis-FIN621                                                           VU

NOTES TO THE ACCOUNTS

Note # 1 Cost of Goods Sold

       Stock of Raw Material Jul 01, 2001                                       35,500
       Add. Purchases                                                          250,000
       Add. Freight Inward                                                      12,000
                                                                               297,500
        Less: Closing Stock of Raw Material                                    (42,000)
        Raw Material Consumed                                                  255,500
        Direct labour                                                          180,000
        Factory Overheads
                 Factory Overheads                       125,000
                 Electricity (50% of 80,000)              40,000
                 Salaries (50% of 140,000)                 70,000
                 Insurance (50% of 150,000)                75,000
                 Plant Depreciation (Note 5)               40,960              350,960
        Total Factory Cost                                                     786,460
        Add: Work in Process Jul 01, 2001                                       42,000
        Less: Work in Process Jun 30, 2002                                     (56,500)
        Cost of Goods Manufactured                                             771,960
        Add: Finished Goods Stock Jul 01, 2001                                  85,000
        Less: Finished Goods Stock Jun 30, 2002                                        (60,000)
        Cost of Goods Sold                                                     796,960
Note # 2 Administrative Expenses

       Salaries (50% of 140,000)                                      70,000
       General Expenses                                               60,000
       Rent                                                          200,000
       Insurance (50% of 150,000)                                     75,000
       Discount Allowed                                               20,000
       Bad Debts                                                      30,000
       Office Electricity (50% of 80,000)                             40,000
       Depreciation Vehicles (Note 5)                                 20,480
       Depreciation Office Equip. (Note5)                              3,281
       Administrative Expenses                                       518,761

Note # 3 Selling Expenses

       Salesman Commission                                          120,000
       Carriage Outward                                              35,000
       Selling Expenses                                             155,000


                         Copyright© Virtual University of Pakistan                                41
Financial Statement Analysis-FIN621                                                                  VU

                                                                                               Lesson-11
                                     FINANCIAL STATEMENTS
                                              (Continued)
Balance Sheet

The balance sheet lists the amounts of the company’s assets, liabilities, and owner’s equity at the end of
accounting period. The balances of the assets and liability accounts are taken directly from the adjusted
trial balance. Cash is listed first among the assets. It is often followed by such asset as marketable
securities, short-term notes receivable, accounts receivable, inventories, and supplies. These are the
most common examples of current assets. The term “current assets” includes cash and those assets that
will be quickly converted to cash or used up in operations

BALANCE SHEET
MOOSA & CO LTD.,
AS ON JUNE 30, 2006
I) Account form
                                                                          Rs. in _________

ASSETS                                                LIABILITIES+SHARE                      HOLDERS’
FUNDS/OWNERS’ EQUITY
  Current Assets
- cash & cash equivalents             15         Current liabilities
- Marketable securities                3
- pre-paid expense                     2       - Bank borrowings                  15

- Accounts Receivables                10        - Accounts payable                 5
  (trade debtors/customers)                    (trade creditors)

- Inventory                          20       -Provision for tax                  5
                                  ______    Total current liabilities            25
                                            Long-term interest bearing loan
  Total current Assets                50      (fixed liabilities)                 50
Fixed Assets                         150 Owner’s equity/shareholders funds 125
Total Assets                         200    Total Liabilities and owners’ equity 200
                                   =========                                    ====

Note: The above list is not exhaustive. It may include many other items. Cash equivalent are cash
substitutes not immediately required i.e. short-term high liquid investment, usually for three months.
Examples are Treasury bills, certificates, prize bonds etc. Marketable securities are investments in govt.
bonds and stocks and bonds of other companies. Fixed Assets are acquired for long-term use e.g. Land,
Building, Plant & Machinery, Vehicles, Furniture‘s & Fixtures etc. Long-term loans are usually secured
against inventory and fixed assets. Tax is shown both on Balance Sheet as current liability i.e. tax
payable and on Income Statement, as Interest expense for the accounting period.

 ii)    Report form

        Balance sheet (As on end of accounting period)
                                                         Rs. in______
         Assets
  i)     Current Assets                                                   50
       ↓    ↑
 ii)     Fixed Assets                                                    150
        Total:                                                           200


                              Copyright© Virtual University of Pakistan                                42
Financial Statement Analysis-FIN621                                                                 VU


LIABILITIES & OWNERS’ EQUITY/SHARE HOLDERS’ FUNDS.
                                    STOCK
↑↓    Current liabilities                            25
      Fixed/long f term liabilities                  50
      Owners’ equity/shareholders funds.            125
                                                   ____
      Total:                                        200

Recording in Balance Sheet: The guiding rule for an accountant is to be conservative and choose
lower values. For example marketable securities are recorded at cost, but current market rate is also
mentioned. Inventory is recorded at cost or market value, whichever is lower. Land is recorded at
historical cost. Other fixed assets (i.e. Building, Plant & Machinery, etc) are recorded at original cost
less accumulated depreciation called “Book value. The accountant must also make provisions for
doubtful debts and inventory losses.

Current Assets: These are assets capable of being converted into cash within one year or operating
cycle, whichever is longer. Operating cycle is the time required to purchase or manufacture inventory,
sell the product and collect cash i.e.

        Cash/assets -----------→ Inventory--------→Receivables ---------→ cash
               Processing                  sales            collection

               Length of operating cycle = inventory sale days + Receivable Collection days. Current
assets are recorded in order of liquidity i.e. ease of conversion into cash. Within current Assets, some
assets are more liquid than others. These are Quick Assets= Total current Assets – Inventory – Pre paid
expenses. The accountant must make allowances for “doubtful accounts” i.e. “unrealizable”. It may
also be noted that proportion of current and fixed assets to total assets is determined by the nature of
business.

               Some additional items on Balance Sheet: Other Assets: These are Incorporation cost i.e.
start-up costs in connection with setting up new business, property held for sale etc. Other additional
items may be, Intangible Assets like Goodwill, patents, trademarks etc. Goodwill arises when one
business acquires another for a price in excess of its fair market value. This is shown on “fixed Assets
side of B/Sheet. It has no physical substance or existence as such. Common meaning of “Good Will” in
non-accounting terms is the benefits derived from a favorable reputation of the business.


ILLUSTRATION #2

Following trial balance has been extracted from the books of Hassan Manufacturing Concern on June
30, 2002.

          Hassan Manufacturing Concern
          Trial balance
          As on June 30, 2002
          Particulars                                                 Amount       Amount
                                                                      Dr. (Rs.)    Cr. (Rs.)
          Raw Material stock Jul. 01, 2001                            35,500
          Work in process Jul. 01, 2001                               42,000
          Finished goods stock Jul. 01, 2001                          85,000
          Raw material purchased                                      250,000

                           Copyright© Virtual University of Pakistan                                  43
Financial Statement Analysis-FIN621                                                      VU

         Wages                                                180,000
         Freight inward                                       12,000
         Plant and machinery                                  400,000
         Office equipment                                     45,000
         Vehicles                                             200,000
         Acc. depreciation Plant                                          195,200
         Acc. depreciation Office equipment                               12,195
         Acc. depreciation Vehicles                                       97,600
         Factory overheads                                    125,000
         Electricity                                          80,000
         Salaries                                             140,000
         Salesman commission                                  120,000
         Rent                                                 200,000
         Insurance                                            150,000
         General Expense                                      60,000
         Bank Charges                                         8,500
         Discounts Allowed                                    20,000
         Carriage outward                                     35,000
         Sales                                                            1,500,000
         Trade Debtors                                        250,000
         Trade Creditors                                                  220,000
         Bank                                                 165,000
         Cash                                                 110,000
         Drawings                                             175,000
         Capital July 01, 2001                                            863,005
         Total                                                2,888,000   2,888,000

Notes:
    • Stock on June 30, 2002.
            o Raw Material                      42,000
            o Work in Process                           56,500
            o Finished Goods                    60,000
    • 50% of electricity, insurance and salaries are charged to factory and balance to office.
    • Depreciation to be charged on Plant & Machinery at 20%, Office Equipment at 10% and
        Vehicles at 20%on WDV.
    • Write off bad debts Rs. 30,000.
All the wages are direct


                        Copyright© Virtual University of Pakistan                          44
Financial Statement Analysis-FIN621                                                                          VU


Balance Sheet

 Hassan Manufacturer Concern
 Profit and Loss Account
 For the Year Ending June 30, 2002
             Particulars                                      Note                            Amount Rs.

 Fixed Assets at WDV                                          4                                     275,284

 Current Assets                                               5                                     653,500
 Current Liabilities                                          6                                    (220,000)
 Working Capital                                                                                    433,500
 Total Assets Employed                                                                              708,784
 Financed by:
 Capital                                                                                             863,005
 Add: Profit for the year                                                                             20,779
 Less: Drawings                                                                                    (175,000)
 Total Liabilities                                                                                  708,784


Note # 4 Fixed Assets at WDV

                                                           Acc. Depreciation                        WDV
                          Cost               Rate   Opening For the year closing

Plant & Mach.            400,000             20%    195,200 40,960     236,160        163,840
Vehicles                           200,000          20%    97,600 20,480       118,080
81,920
Office Equip.            45,000              10%     12,195     3,281           15,476             29,524
                                                               64,721                             275,284

Note # 5 Current Assets

       Stock
                Raw Material                                         42,000
                Work in Process                                               56,500
                Finished Goods                                       60,000            158,500
       Debtors                                                                         250,000
       Less: Bad Debts                                                                            (30,000)
       Bank                                                                             165,000
       Cash                                                                             110,000
       Current Assets                                                                  653,500


Note # 6 Current Liabilities

       Trade Creditors                                                                 220,000


                            Copyright© Virtual University of Pakistan                                          45
Financial Statement Analysis-FIN621                                                                   VU

                                                                                                Lesson-12
                                   FINANCIAL STATEMENTS
                                              (Continued)

Cash Flow Statement

Cash flow statement shows, how cash was generated and how it was used during the period. These days,
it is required by law to include this statement in financial statements, especially in case of financial
statements of limited companies.

Need For Cash Flow Statement

For any business, it is important to ensure that:
    • Sufficient profits are made to compensate owners for the investment made, efforts put in and the
        risk taken for the business,
    • Sufficient funds are available to meet the obligations of the business as and when required.
The information as to profitability is provided by the Profit and Loss Account. The information as to
availability of funds or financial health is provided by the balance sheet. But the balance sheet is
prepared on a specific date and can provide information of financial position as on that date only. Cash
flow, on the other hand provides more detailed information about the movement of funds during the
period. With the help of cash flow, we can determine the amount of cash generated form different
sources and the areas on which it is utilized.

Difference between Profitability and Liquidity

Liquidity

It is the ability of a business to pay its debts in time. By having good liquidity, we mean that a business
has sufficient liquid funds (cash and cash equivalents) so that it can repay liabilities.

Cash

Cash includes cash in hand and demand deposits.

Cash Equivalents

Cash equivalents are those short term investments that can be converted into a known amount of cash at
any time. Usually, investments up to three months maturity are included in cash equivalents.

People generally mix up profitability with liquidity. One might think that if a business has earned, say,
One Million Rupees of profit than it should have approximately the same amount of cash in it.
But mostly this is not the case. Consider the following example:
    • A person starts a small business with Rs. 10,000.
    • He purchases goods worth Rs. 20,000. Rs. 10,000 is paid in cash and remaining is payable at the
       end of the month.
    • The same day, all the goods are sold on credit of two months for Rs. 30,000.
    • Now if we draw a profit and loss account at the end of the month, the business has earned a
       profit of Rs. 10,000, considering no expenses.
    • But at the same time, it is time to pay to the Creditors, whereas payment from debtor is not due
       yet.
    • This means that although the business earned a profit of Rs. 10,000 but it has no cash to pay to
       its creditors.
    • This simple example helps us to understand that liquidity is different from profitability
    • But it is as important as profitability.
                           Copyright© Virtual University of Pakistan                                    46
Financial Statement Analysis-FIN621                                                                 VU

Components of Cash Flow Statement

Cash flow statement is divided into three components
   • Cash Flow from Operating Activities
   • Cash Flow from Investing Activities
   • Cash Flow from Financing Activities

Cash Flow From Operating Activities

Cash flow from operating activities is generally derived from the principal revenue producing activities
of the business.

Cash Flow from Operating Activities is the indicator of success or failure of a business’s operations. If
the cash flow from operations is continuously negative, this means that the business revenue is not
enough to recover the costs that are incurred to earn it. Therefore, in the long run Cash flow from
operations must be positive.

Examples of cash flows from operating activities are:
   • Cash receipt from sale of goods and rendering of services.
   • Cash receipts from fees, commission and other revenues.
   • Cash payments to suppliers for goods and services.
   • Cash payments to and on behalf of the employees.
   • Cash payments or refunds of income taxes.

EXAMPLE

Net Profit before Tax                                                        16,514
Add: Adjustment for Non-Cash Items
       Depreciation for the Year                                              5,500
       Provision for Doubtful Debts                                             810
       Exchange Gain / Loss                                                      -
       Gain / Loss on Disposal of Assets                                          -
       Return on Investments                                                   4,000
       Mark-up on Loans                                                       3,500

Operating Profit Before Working Capital Changes                              30,324
Working Capital Changes
       Add: Decrease in Current Assets                                                 40,000
       Less: Increase in Current Assets                                     (50,000)
       Add: Increase in Current Liabilities                                      -
       Less: Decrease in Current Liabilities                                     -

Cash Generated From Operations                                               20,324
Less: Markup paid on loans                                                   (3,000)
       Less: Taxes Paid                                                                (5,000)
Net Cash Flow from Operating Activities                                      12,324


Cash Flow From Investing Activities

Cash flow from investing activities includes cash receipts and payments that arise from Fixed and Long
Term assets of the organization.


                           Copyright© Virtual University of Pakistan                                  47
Financial Statement Analysis-FIN621                                                               VU

Cash Flows from Investing Activities shows the investment trend of the business. If it is negative
(Outflow) this means that the company is investing in long term assets and is expanding. On the other
hand if it is positive (Inflow) over the years, this means that the company is selling its long term
investments.

Examples of cash flows from investing activities are:
   • Cash payments to acquire property plant and equipment. These also include payments made for
      self-constructed assets.
   • Cash receipts from sale of property plant and equipment.
   • Cash payments and receipts from acquisition and disposal of other than long term assets e.g.
      Shares, debentures, TFC, long term loans given etc.

If assets are held for trading purposes or in normal course of business e.g. car / property dealers and
loans given by banks, then cash flow from these are included in Operating Cash Flow.

EXAMPLE

Cash Flow from Investing Activities

       Add: Disposal of Fixed Asset and Long Term Investments                      100,000
       Less: Acquisition of Fixed Assets and Long Term Investments                 (80,000)
       Add: Dividend Received / Returns on Investment Received                          -
Net Cash Flow from Investing Activities                                             20,000

Cash Flow From Financing Activities

Cash flow from financing activities includes cash receipts and payments that arise from Owners of the
business and other long term liabilities of the organization.

Cash Flows from Financing Activities shows the behavior of investors (both equity capital and debt
capital). A positive figure (inflow) shows that funds are being invested in the company and vice versa.

Examples of cash flows from financing activities are:
   • Cash received from owners i.e. share issue in case of company and capital invested by sole
      proprietor or partners.
   • Cash payments to owners i.e. dividend, drawings etc.
   • Cash receipts and payments for other long term loans and borrowings.

EXAMPLE

Cash Flow from Financing Activities

       Add: Shares Issued / Capital Invested                                 1,000,000
       Less: Dividend Paid / Drawings                                         (400,000)
       Add: Increase in Long Term Borrowings                                   150,000
Net Cash Flow from Financing Activities                                        750,000

Procedure Of Preparing Cash Flow

Cash Flow Statement is prepared as follows:
   • We start from the Profit / Loss for the period before taxation.
   • Adjustments are made for non-cash items that are included in the profit and loss account such as
       Depreciation, Provisions and other items that relate to investing and financing activities.
   • This gives us Operating Profit before Working Capital Changes.
                          Copyright© Virtual University of Pakistan                                 48
Financial Statement Analysis-FIN621                                                               VU

    •   Then Working Capital Changes, i.e. increase or decrease in items of current assets and
        liabilities, are added / subtracted (Cash and Cash Equivalents are not included here)
    •   This gives the Cash Flow from Operations.
    •   To this figure, we add / subtract cash flows from investing and financing activities.
    •   This gives us Net Increase / Decrease in Cash and Cash Equivalents.
    •   To this figure we add Opening Balance of Cash and Cash Equivalents (that we excluded from
        current assets)
    •   This gives us the Closing Balance of Cash and Cash Equivalents.

Increase or Decrease is generally taken as difference in opening and closing balances of accounts
reported in balance sheets.

FORM OF CASH FLOW STATEMENT

Name of the Entity
Cash Flow Statement for the Period Ending -----


Net Profit before Tax                                                           XYZ
Add: Adjustment for Non-Cash Items
       Depreciation for the Year                                                XYZ
       Provision for Doubtful Debts                                             XYZ
       Exchange Gain / Loss                                                     XYZ
       Gain / Loss on Disposal of Assets                                        XYZ
       Return on Investments                                                    XYZ
       Mark-up on Loans                                                         XYZ

Operating Profit Before Working Capital Changes                                 XYZ
Working Capital Changes
       Add: Decrease in Current Assets                                                  XYZ
       Less: Increase in Current Assets                                        (XYZ)
       Add: Increase in Current Liabilities                                     XYZ
       Less: Decrease in Current Liabilities                                   (XYZ)
                                                                                `
Cash Generated From Operations                                                  XYZ
        Less: Markup paid on loans                                             (XYZ)
        Less: Taxes Paid                                                               (XYZ)
Net Cash Flow from Operating Activities                                         XYZ
Cash Flow from Investing Activities
        Add: Disposal of Fixed Asset and Long Term Investments                          XYZ
        Less: Acquisition of Fixed Assets and Long Term Investments            (XYZ)
Add: Dividend Received / Returns on Investment Received                         XYZ
Net Cash Flow from Investing Activities                                         XYZ
Cash Flow from Financing Activities
        Add: Shares Issued / Capital Invested                                   XYZ
        Less: Dividend Paid / Drawings                                         (XYZ)
Add: Increase in Long Term Borrowings                                           XYZ
Net Cash Flow from Financing Activities                                         XYZ
Net Increase / Decrease in Cash and Cash Equivalents                            XYZ
Add: Opening Balance of Cash and Cash Equivalents                               XYZ
Closing Balance of Cash and Cash Equivalents                                    XYZ

IV) Statement of cash flows. This final Financial Statement provides net results of cash inflows
(receipts) and cash outflows (payments) during an accounting period. Banks/creditors/investors look for
                          Copyright© Virtual University of Pakistan                                 49
Financial Statement Analysis-FIN621                                                                   VU

this statement, because it gives them a picture of net cash flow of the business. As already explained,
positive net income (profit) does not necessarily mean increase in cash. Therefore such statement must
be prepared in order to depict actual cash position. It is clear that a highly profitable business may also
go bankrupt. Therefore profitability does not necessarily mean solvency i.e. ability to pay debts and
obligations. This fact gives rise to the need for preparing cash flow statement.

Parts of cash flow statement

             Cash “flows” through a business during accounting period by Cash & Cash equivalent (T-
bills, saving certificates, bonds etc), and through operating activities which include, producing or
delivering goods for sale and providing services, and also cash effects of transactions and other events
that determine net income.

             For example Cash flows/collections from sales and interest and dividends received would
be cash Inflows. Similarly, purchase of inventories and payment of operating expenses would constitute
cash outflows.

           Generating positive cash from operations is the preferred method to finance capital
expenditure, debt repayments and dividend payments.

               The third method or process by which cash “flows” through a business is the group of its
activities called investing activities which include short-term investments, acquiring/disposing of
securities, acquiring/disposing of plant assets, and lending money/collecting loan.

              The fourth method or process of cash flow is the group of activities called “Financial”
activities which include borrowings from creditors/repaying the principal, obtaining resources from
owners, and providing owners with return on investment.

               The fifth method or process of cash flow in a business is of course the effect of exchange
rate fluctuations on cash.

To prepare cash flow statement, look at changes in all of balance sheet accounts from beginning to end
of accounting period, and transfer the changes to appropriate area of cash flow statement.

Cash Flow from operating activities.
Inflows in this case are: - cash collections from customers, Interest/dividends collected, and other
operating cash receipts e.g. proceeds from litigations.

               Outflows would be, cash paid to suppliers & employees, interest & taxes paid and other
operating cash payments e.g. payments in litigations.

                It should be noted that receipt and payment of interest are classified as operating
activities and not investing or financing activities.

                Net of the “Inflows” and “Outflows”, gives cash flow from operating activities.

Cash flow from investing activities:

               Inflows in this case are proceed from sales of Certificates/ Securities, proceeds from sales
of Plant assets, and collection of loans (principal).

               Outflows here would be purchase of Certificates/Securities, purchase of plant assets,
and loans made to borrowers.


                           Copyright© Virtual University of Pakistan                                    50
Financial Statement Analysis-FIN621                                                                 VU

                 Net of ‘Inflows’ and ‘Outflows’ gives cash flow from investing activities.

Cash flow from financing activities

                Here, the ‘Inflows’ are proceeds from borrowings, proceeds from issuing “bonds
payable”, and    proceeds from issuing capital stock.

             Outflows correspondingly are payment to settle debts (principal), and payment of
dividends.
                 Net of ‘Inflows’ and ‘Outflows’, gives cash provided by financing activities.

                Sum of net cash flows from all the three activities viz Operating, Investing and
Financing gives overall cash flow during the accounting period.

               Analysis of Cash Flow Statement determines firm’s ability to generate cash from
operations, its capacity to meet cash obligations and its future financing needs. It indicates firm’s
success in investing activities, and determines the magnitude, fluctuations and causes of the positive or
negative operating cash flow.


                           Copyright© Virtual University of Pakistan                                  51
Financial Statement Analysis-FIN621                                                                VU

                                                                                             Lesson-13
                               STATEMENTS OF CASH FLOWS
                                             (Continued)

Preparing Cash Flows

                 Ledgers are maintained on accrual basis; not on cash basis. Preparing Cash Flow
involves converting accrual-based accounts into cash-based. In small business, cash flow statement is
prepared directly from special journals for cash receipts and cash payments. For most businesses, such
statement is prepared by analyzing Income Statement and balance sheet.

               Analyzing Income Statement involves re-arrangement of its items/Accounts in two
major groups viz (i) Sales, other income and gains, and (ii) Cost of sales, other expenses and losses.
These cover Operating and Investing Activities.

                 Analyzing balance sheet involves looking at changes in all of balance sheet accounts
(except cash) from beginning to end of accounting period, and transferring these changes to appropriate
area of cash flow statement.

↑    Asset Account               Dr.    Asset Accounts       ↓ Cr

↑    Liabilities Account        Cr      Liability Accounts ↓     Dr

↑    Owner’s Equity Account Cr          Owner’s Equity A/C ↓    Dr

                 The arrow ↑ shows increases, and ↓ shows decreases. It has to be determined whether
a certain increase or decrease (which is debited or credited in ledger accounts involves cash inflow or
cash outflow. For example decrease in Asset Account other than cash shows either collection of
Accounts Receivable or sale of fixed assets, which results in Cash Inflow. Similarly increases in Assets
say fixed assets would imply purchase of fixed assets and hence cash outflow.

Practical exercise: Consider the following Income Statement of a business.

MOOSA CORPORATION
INCOME STATEMENT
FOR THE YEAR ENDED JUNE 30, _____

                                                                Rs.____
Net sales                                                       900,000
Cost of Goods sold                                              500,000
Gross Profit                                                    400,000
Operating expenses                                              300,000
(Includes depreciation Rs.40, 000)
Operating Profit (EBIT)                                         100,000

Other expenses
Interest                                35,000
Loss on sale of marketable securities    4,000                    39,000
Profit before tax (EBT)                                           61,000
Income tax expenses                                               36,000
Profit after tax                                                  25,000


                           Copyright© Virtual University of Pakistan                                 52
Financial Statement Analysis-FIN621                                    VU

Other Income
Dividend revenue                        3,000
Interest revenue                        6,000
Gain on sale of plant assets           31,000                40,000
                                                            _______
Net Income                                                   65,000


                           Copyright© Virtual University of Pakistan   53
Financial Statement Analysis-FIN621                                                                 VU

                                                                                              Lesson-14
                                 STATEMENTS CASH FLOWS
                                              (Continued)

Additional Information (AI) obtained from analysis of changes in the balance sheet accounts during
the current year:-

                 Cash & Cash equivalents at beginning of the year        Rs.40, 000
                                       at end of the year                Rs.75, 000

          Other additional information classified into the three categories i.e. Operating, Investing and
Financing Activities, was as follows:-

         Additional Information relating to Operating Activities

            1. Accounts Receivable increased by Rs.30, 000.
            2. Accrued interest i.e. interest receivable decreased by Rs.1, 000 (Dividend revenue
               recognized on cash basis & interest revenue on accrual basis).

            3.   Inventory increased by Rs.10, 000 and accounts payable by Rs.15, 000.
            4.   Short-term prepared expenses increased by Rs.3, 000.
            5.   Accrued expenses (payable) decreased by Rs.6, 000.
            6.   Depreciation for the year Rs.40, 000.
            7.   Interest payable increased by Rs.7, 000.
            8.   Income tax payable decreased by Rs.2, 000.

         Additional Information relating to Investing Activities

    1. Marketable Securities (not qualifying as cash equivalent) show debit entries of Rs.65,000 and
       credit entries of Rs.44,000.
    2. Notes Receivable Account shows Rs.17, 000 debit and Rs.12, 000 credits.
    3. Purchase of plant assets for Rs.200,000: Cash Rs.160,000 and long-term Note Payable
       Rs.40,000
    4. Sale of plant assets with book value Rs.44,000

         Additional Information relating to Financing Activities

    1.   Borrowed Rs.45, 000 cash by issuing short-term Notes Payable.
    2.   Repaid Rs.55, 000 on account of principal on Loans & Notes Payable.
    3.   Issued bonds payable Rs.100, 000 cash.
    4.   Issued for cash 1000 shares of Rs.10 par value at Rs.50 per share.
    5.   Cash dividend paid Rs.40,000

             Re-arranging Income Statement in the two categories of Operating and Investing Activities
would give the following picture of the Income Statement:


MOOSA CORPORATIAON
Income statement
For the year ended June 30, ________

Sales, other revenue and gains                        Rs._____
         Net sales                                           900,000
         Dividend Revenue                                       3,000

                           Copyright© Virtual University of Pakistan                                  54
Financial Statement Analysis-FIN621                                         VU

        Interest Revenue                                            6,000
Gain on sales of plant assets                                      31,000
        Total                                                     940,000
Cost of sales, other expenses and losses
        Cost of goods sold                                        500,000
        Operating expenses                                        300,000
         (Includes Dep of Rs. (40, 000)
        Interest expenses                                         35,000
        Income tax expenses                                       36,000
        Loss on sale of marketable securities                      4,000
                 Total                                           875,000
                 Net Income                                       65,000


                          Copyright© Virtual University of Pakistan         55
Financial Statement Analysis-FIN621                                                              VU

                                                                                           Lesson-15

                                   FINANCIAL STATEMENTS
                                            (Continued)

Cash flow from Operating Activities

             Study computation of net sales, cost of goods sold and interest expense etc. On Income
Statement.

              Cash received from customers; Cash received from sales on cash = Net Sales; Cash
received from sales on credit/on account =     Net sales – increase in Accounts Receivable or Net
sales + decrease in Accounts Receivable. Increase/decrease in Accounts Receivable is observed from
beginning and ending/closing balances, appearing on Balance Sheet.

(A1 No:1): Cash received from customers = 900,000 – 30,000       = Rs.870,000

A1 No:2

       Cash dividend received = Dividends Revenue =Rs.3,000: Divided Revenue is based on cash, so
whatever Dividend Revenue is being received, that in cash Inflows.

        Cash interest received=Interest Revenue + Decrease in Interest Receivable, or Interest Revenue
– Increase in Interest Receivable = 6000 + 1000 = 7000

       Interest & Dividend received = 3,000 + 7,000 = 10,000

       Cash Inflow from operating activities would be: Cash from customers + interest & dividends
receivable = 870,000 + 10,000 = Rs. 880,000

                           CASH FLOW STATEMENT CONTD………

QUESTION # 1

You are given the Balance Sheet of ABC Limited as at June 30, 2001 and June 30, 2002 and its Profit
and Loss Account for the year ended June 30 2002.

Required

You are required to prepare Cash Flow Statement for the given period.

ABC Ltd
Balance Sheet As At June 30 2002

                                                       2002 Rs.          2001 Rs.
                                                       Rs. ‘000                Rs.
‘000
Building at Cost                                               181,000
140,000
Accumulated Depreciation                                36,000           30,000
Written Down Value                                     145,000          110,000
Plant and Machinery cost                                83,000           90,000
Accumulated Depreciation                                36,000           35,000
Written Down Value                                      47,000           55,000

                           Copyright© Virtual University of Pakistan                               56
Financial Statement Analysis-FIN621                                             VU

Total Fixed Assets at WDV                         192,000         165,000
Long Term Investment                              17,000           10,000
Current Assets
       Debtors                                      30,000            21,000
       Stock                                        25,000            40,000
       Short Term Deposits                          18,000            15,000
       Cash and Bank                                30,000             24,000
                                                   103,000
100,000
Current Liabilities

       Creditors                                   15,000              12,000
       Proposed Dividend                           18,000              16,000
       Tax Payable                                  9,000               8,000
                                                   42,000              36,000
Working Capital                                    61,000              64,000
Net Assets Employed                              270,000              239,000
Financed By

 Share Capital                                    180,000             160,000
Share Premium Account                                        17,000
12,000
General Reserve                                              23,000
20,000
Accumulated Profit and Loss                        34,000              27,000
Share Holders’ Equity                             254,000             219,000
Term Finance Certificates                          16,000              20,000
Total                                             270,000             239,000


                        Copyright© Virtual University of Pakistan               57
Financial Statement Analysis-FIN621                                                      VU


ABC Ltd
Profit and Loss Account For the Year Ended June 30 2002
                                                                    Rs. ‘000
Sales                                                               300,000
Cost of Sales                                                           (231,000)
Gross Profit                                                        69,000
Other Income                                                        4,000
                                                                    73,000
Less: Administrative Expenses
      Director’s Remuneration                                       4,000
      Depreciation on Building                                      6,000
      Loss on Sale of Machinery                                     2,000
      Other Administrative Expenses                                 12,000
                                                                    24,000
Less: Selling Expenses
                                                                    10,000
Less: Mark up on TFC
                                                                    2,000
Profit for the Year Before Tax                                      36,000
Provision for tax                                                   37,000
Profit after tax                                                    9,000
Acc. Profit Brought Forward                                         28,000
                                                                    27,000
                                                                    55,000
Appropriation
    Transfer to Reserve                                                         3,000
    Proposed Dividend                                                           18,000
                                                                    21,000
Accumulated Profit Carried Forward                                              34,000


Additional Information

   1. Other income include dividend on Long Term Investment
   2. Cost of goods sold includes depreciation for the year on machinery Rs. 5,000.
   3. Accumulated Depreciation on the machine disposed off amounts to Rs. 4,000.


                          Copyright© Virtual University of Pakistan                      58
Financial Statement Analysis-FIN621                                         VU

 SOLUTION

ABC Ltd
Cash Flow Statement For the Year Ended June 30 2002
                            Note                                  Rs. ‘000
Net Profit Before Tax                                             37,000
Adjustment of Non Cash Items
       Depreciation                                               11,000
       Loss on Sale of Machinery                                  2,000
         Markup on TFC                                            2,000
                                                                  52,000
Less: Other Income                                                (4,000)
Operating Profit Before Working
 Capital Changes                                                  48,000
Working Capital Changes
       Reduction in Stock                                         15,000
       Increase in Creditors                                      3,000
       Increase in Debtors                                        (9,000)
                                                                  9,000
Cash Flow from Operations                                         57,000
        Markup on TFC Paid                                        (2,000)
        Tax Paid                        1                         (8,000)
Net Cash Flow From Operating Activities                           47,000
Cash Flow From Investing Activities
Dividend Received                                                 4,000
Payment to Acquire Investments 2                                  (7,000)
Purchase of Fixed Assets (Building)     3                         (41,000)
Receipt from Sale of Assets             4                         1,000
Net Cash Flow From Investing Activities                           (43,000)
Cash Flow From Financing Activities
       Issue of Ordinary Shares                                   20,000
       Share Premium Account                                      5,000
       Dividend Paid                     5                        (16,000)
       Repayment of TFC                 6                         (4,000)
Net Cash Flow From Financing Activities                           5,000
Net Increase / (Decrease) in Cash and
  Cash Equivalents During The Year                                9,000
O/B of Cash and Cash Equivalents                                  39,000
C/B of Cash and Cash Equivalents                                  48,000


                           Copyright© Virtual University of Pakistan         59
Financial Statement Analysis-FIN621                                           VU

Note # 1                   Tax Paid

Provision for Tax          Account Code --------
Particulars                 Amount   Particulars                  Amount
                           Dr. (Rs.)                              Cr. (Rs.)
Cash                       8,000     Bal. B/F                     8,000
Balance c/f                9,000
                                     For the year
                                                                  9,000

Total                       17,000      Total                     17,000

Note # 2                  Payments to Acquire Investments
Investment          Account Code --------
Particulars                Amount       Particulars               Amount
                           Dr. (Rs.)                              Cr. (Rs.)
Bal. B/F                   10,000

Cash                        7,000

                                        Bal. C/F                  17,000

Total                       17,000      Total                     17,000

Note # 3                   Purchase of Fixed Assets

Building Cost       Account Code --------
Particulars                Amount       Particulars               Amount
                           Dr. (Rs.)                              Cr. (Rs.)
 Bal. B/F                  140,000
 Cash                      41,000


                                        Bal. C/F                  181,000

Total                       181,000     Total                     181,000

Note # 4                   Sale Proceed of Machinery
Machinery at Cost          Account Code --------
Particulars                 Amount     Particulars                Amount
                            Dr. (Rs.)                             Cr. (Rs.)
Bal. B/F                    90,000     Disposal A/c               7,000


                                        Bal. C/F                  83,000

Total                       90,000      Total                     90,000


                      Copyright© Virtual University of Pakistan               60
Financial Statement Analysis-FIN621                                                VU


Disposal of asset          Account Code --------
Particulars                 Amount   Particulars                  Amount
                           Dr. (Rs.)                              Cr. (Rs.)
Cost                       7,000     Accumulated Dep.             4,000
                                     Loss on Sale                 2,000
                                     Sale Proceed                 1,000


Total                       7,000     Total                       7,000


Note # 5                   Dividend Payable


Dividend Payable           Account Code --------
Particulars                 Amount    Particulars                 Amount
                            Dr. (Rs.)                             Cr. (Rs.)
Cash                        16,000    O/B                                 16,000
                                      For the Year                   18,000


C/B                         18,000
Total                       34,000    Total                       34,000

Note # 6                   Repayment of TFC


TFC Account                Account Code --------
Particulars                 Amount   Particulars                  Amount
                           Dr. (Rs.)                              Cr. (Rs.)
Cash                       4,000     O/B                          20,000


C/B                         16,000

Total                       20,000    Total                       20,000


                      Copyright© Virtual University of Pakistan                    61
Financial Statement Analysis-FIN621                                                                 VU

                                                                                              Lesson-16
                                   FINANCIAL STATEMENTS
                                              (Continued)

Cash payment for Merchandise = Cost of Goods Sold + increase in Inventory + Decrease in Accounts
Payable, or Cost of Goods sold – Decrease in Inventory – Increase in Accounts Payable.

Keeping in view, A1 No.3; cash payment for merchandise= 500,000 + 10,000 - 15000 = Rs.495, 000

A1 No.4, 5 & 6
               Pre Paid expenses increased by Rs.3, 000, therefore cash payment exceeded the actual
expense. Accrued expenses (Payable) decreased by Rs.6000, therefore cash payment exceeded the
actual expense (includes employees’ expenses). Depreciation of Rs.40, 000 requires no cash payment
but it does increase total expenses. It is therefore deducted from operating expenses.

Cash payment for operating expenses = expenses + increase in Pre Paid expenses + decrease in Accrued
Expenses – Depreciation=
                                       300,000 + 3,000 + 6000 - 40,000 = Rs.269, 000

     Cash paid for merchandise and operating expenses= 495,000+269,000 = Rs.764, 000

Cash payment for interest: (A17) accrued interest liability (interest payable) increased by Rs.7, 000. It
means that not all of the interest expense shown in Income Statement was paid in cash. Interest expenses
in Income Statement 35,000. From this, reduce the increase in related accrued liability i.e. 7,000. That
means interest paid in cash was Rs. 28,000.

Cash payment for Income Tax (A1 8) Tax liability reduced by Rs.2, 000/-. It means that cash payment
is greater than expense shown in Income Statement. Tax expenses in Income Statement are Rs.36, 000.
Add to this the reduction in tax liability, i.e. Rs. 2,000/-. Therefore Income tax paid in cash comes to
Rs.38, 000/-.

Operating Activities’ portion of cash flow statement

                                                   Rs.____

Cash received from customers                     870,000
Interest & dividend received                      10,000
                Cash inflow                                      880,000
Cash paid to suppliers
(Merchandise) & operating                        (764,000)
Expenses (including employees)
Interest paid                                    (28,000)
Income tax paid                                  (38,000)
         Cash (out flow)                                        (830,000)
Net cash flow from Operating Activities                           50,000


              Note that net income reported on Income Statement Rs.65, 000 and net cash flow from
Operating Activities Rs.50, 000. What are the reasons for difference of Rs.15, 000? Reasons are:
depreciation expense (reduces net income but not cash) and adjustments made to net sales, cost of goods
sold and expenses, and non operating gains & losses (these affect cash flow relating to Investing &
Financing Activities)


                           Copyright© Virtual University of Pakistan                                  62
Financial Statement Analysis-FIN621                                                                VU

                                                                                             Lesson-17
                                    FINANCIAL STATEMENTS
                                             (Continued)

Cash flow from Investing Activities: Much information is obtained from changes in related Asset
Accounts.

 Purchase & Sale of Marketable Securities (AI No: 1) Dr in Marketable Securities A/C shows
Purchases, and hence cash outflow of Rs.65, 000. Cr of Rs.44, 000 in the A/C shows sale and hence
cash inflow. Income Statement shows loss of Rs.4, 000 on these sales. Therefore cash proceeds from
sales = Rs.40, 000 i.e. 44,000 – 4,000 (loss).

Loans made to borrowers (AI No: 2) Dr in Notes Receivable shows Loans given and hence outflow of
Rs.17, 000. Cr in Notes Receivable shows Loans collected and hence cash inflow of Rs.12, 000.

                  It should be re-emphasized that the amount involved here is on account of Principal of
loans. Interest, as already stated is credited to Interest Revenue Account and is included in Operating
Activities.

Cash paid to acquire plants (AI No: 3)

               Cash paid to acquire new plants shows cash outflow (160,000); sale of plant assets with
book value of Rs.44, 000 shows cash Inflow. Income statement shows gain of Rs.31, 000 on this. This
means that cash proceeds from sale of plant assets amounted to Rs.75, 000/-.

Investing Activities’ portion of cash flow statement would be:-

Purchase of Marketable securities            (65,000)
Loans made to borrowers                      (17,000)
Purchase of plant assets                    (160,000)
                                                                    (242,000)
Proceeds from sale of securities              40,000
Collection of Loans                           12,000
Proceeds from sale of plant assets             75,000                127,000
Net cash flow from Investing Activities                             (115,000)

Cash flow from financing Activities (A 1 No.1 to 5)

               Proceeds from short-term borrowings in lieu of Notes Payable show cash inflow of
Rs.45, 000. Payments to settle debts shows cash outflow of Rs.55, 000/-. Proceeds from issuing bonds
show cash inflow of Rs.100,000 and proceeds from issuing capital stock also show cash inflow of
Rs.50,000 (1000 shares x Rs.50/share) Divided paid, of course involves cash    outflow of Rs.40,000.

                Financing Activities’ portion of cash flow statement would be:
                                                                 Rs._____

Proceeds from short-term borrowings              45,000
Proceeds from issuing bonds payable            100,000
Proceeds from issuing capital stock              50,000           195,000
Payment to settle short-term debts              (55,000)
Dividends paid                                 (40,000)            (95,000)
Net cash flow from financing activities                           100,000

Net increase (decrease) in cash

                           Copyright© Virtual University of Pakistan                                 63
Financial Statement Analysis-FIN621                                                              VU

                                                       Rs.____

Net cash flow from Operating Activities                50,000
Net cash flow from Investing Activities              (115,000)
Net cash flow from Financing Activities               100,000
Net increase (decrease) in cash                        35,000
Cash & Cash equivalent beginning of the year           40,000
Cash & Cash equivalent end of the year                 75,000 (tallies with the first item on
                                                      ===== Additional Information Sheet)

Note that net cash flow from Operating Activities is Rs.50, 000 against net income of Rs.65, 000 shown
on Income Statement.


MOOSA CORPORATION
Statement of Cash Flows
For the Year Ended June 30, _____


Cash Flows from operating activities:                                          Rs.
Cash received from customers …………………….…..          870,000
Interest and dividends received …………………..…..         10,000
Cash provided by operating activities ……… ……………………                              880,000
Cash paid to suppliers and operating expenses..…. (764,000)
Interest paid …………………………………………..                    (28,000)
Income taxes paid ………………………………….                    (38,000)
Cash disbursed for operating activities ……………………………….                           (830,000)
Net cash flow from operating activities ………………………………                              50,000
Cash flows from investing activities:

Purchases of marketable securities                 (65,000)
Proceeds from sales of marketable securities ………    40,000
Loans made to borrowers ………………………………… (17,000)
Collections on loans ……………………………………                 12,000
Purchases of plants assets ………………………………. (160,000)
Proceeds from sales of plant assets …………………         75,000
Net cash used by investing activities……………………………                                (115,000)
Cash flows from financing activities:
Proceeds from short-term borrowing ………………..          45,000
Payments to settle short-term debts ………………..        (55,000)
Proceeds from issuing bonds payable ……………..         100,000
Proceeds from issuing capital stock ………………..          50,000
Dividends paid …………………………………………… (40,000)
Net cash provided by financing activities……………………………..                           100,000
Net increase (decrease) in cash ………………………………………..                                 35,000
Cash and cash equivalents, beginning of year …………………….                            40,000
Cash and cash equivalents, end of year …………………………….                               75,000


                          Copyright© Virtual University of Pakistan                                64
Financial Statement Analysis-FIN621                                                                 VU

                                                                                              Lesson-18
                           NOTES TO FINANCIAL STATEMENTS
                                              (Continued)

Notes to Financial Statements:

              These are integral part of the Financial Statements, which provide summary of accounting
policies, adopted by Management in preparation of Accounts and preparing Financial Statements there
from. These also present details about particular accounts (e.g. inventory, investments etc). Notes to
Financial Statements also include other information e.g. leasing arrangements, pending legal
proceedings, income taxes etc.
Information by segment for firms with several lines of business is also given in these Notes.

Notes to the accounts are the explanatory notes of all the items shown in the profit and loss account and
the balance sheet. It is the requirement of the Companies Ordinance and the International Accounting
Standards. Following are explained in Notes to the accounts:
            o Nature of business of the company
            o Accounting Policies of the company
            o Details and explanation of items given in the Profit and Loss Account and Balance
                Sheet.

Accounting Policies

The two major areas of Accounting Policies are Inventory and Depreciation of Plant Assets.

Inventory: This consists of items held for sale or used in manufacture of products that would be sold.
Inventory in merchandising business consists of goods owned and held for sale. This is called
Merchandise. Inventory in manufacturing business consists of three parts i.e. raw material, work-in-
process and finished goods. Inventory is an Asset which is shown at cost in balance sheet.

Inventory Accounting Policies

                Before we discuss Accounting Policies regarding Inventory, let us discuss the following
three types of maintaining and recording inventory:-

    a) Perpetual inventory system. This is most widely used: In this, the transactions are recorded
       as they occur. The flow would be as follows:-

        Purchase of → Dr. Current → Merchandise → Dr. Cost of → Cr. Inventory
        Merchandise     Assets        sold            good sold
                      “Inventory”

                         Cr. Cash or                         Cr. Revenue     Dr. Cash or
                        A/C payable                                        A/C Receivable

In a perpetual inventory system, merchandising transactions are recorded as they occur. The system
draws its name from the fact that the accounting records are kept perpetually up-to-date. Purchase of
merchandise is recorded by debiting an asset account entitled inventory. When merchandise is sold, two
entries are necessary: One to recognize the revenue earned and the second to recognize the related cost
of goods sold. This second entry also reduces the balance of inventory account to reflect the sale of
some of the company’s inventory.
A perpetual inventory system uses an inventory subsidiary ledger. This ledger provides company
personnel with up-to-date information about each type of product that the company buys and sells,
including the per-unit cost and the number of units purchased, sold, and currently on hand.

                           Copyright© Virtual University of Pakistan                                  65
Financial Statement Analysis-FIN621                                                                VU

b)      Periodic inventory system: In this case, accounting records are updated periodically – usually
        at year’s end: “Cost of goods sold” is also determined at year’s end. The flow in this case
        would be as follows:-

Purchase of → Dr. Purchase     →    Merchandise → No entry for “cost of goods sold”
Merchandise      A/C                  sold        or inventory. This is done at years end.


                   Cr. Cash or                        Cr. Revenue    Dr. Cash or A/C
                   A/C Payable                                        Receivable


                Complete physical inventory is taken at year’s end as follows:-
                Opening balance (year’s beginning)                                       12,000
                + Purchases.                                  130,000
                Inventory available.                          142,000
                Less closing balance (year’s end).                                         8,000
                Inventory used/sold.                                   134,000

        This i.e. Rs.134, 000 is “cost of goods sold”, charged to Income Statement, and closing
        inventory is Rs.8, 000 recorded on balance sheet. Both entries are recorded at year’s end.

        Assumptions under this method are that all units of inventory were acquired at the same unit
        costs. “Taking physical inventory” at or near year-end also takes into account Inventory
        Shrinkage (breakage, spoilage, theft), which is written off to Income Statement in the form of
        “losses”.

A periodic inventory system is an alternative to a perpetual inventory system. In a periodic inventory
system, no effort is made to keep up-to-date records of either the inventory or the cost of goods sold.
Instead, these amounts are determined only periodically, usually at the end of each year.

A traditional periodic inventory system operates as follows. When merchandise is purchased, its cost is
debited to an account entitled purchases, rather than to the inventory account. When merchandise is
sold, an entry is made to recognize the sales revenue, but no entry is made to record the sost of goods
sold or to reduce the balance of the inventory account. As the inventory records are not updated as
transactions occur, there is no inventory subsidiary ledger.

The foundation of the periodic inventory system is the taking of a complete physical inventory at year-
end. This physical count determines the amount of inventory appearing in the balance sheet. The cost of
goods sold for the entire year then is determined by a short computation.

c)      Just in time (JIT) Inventory System. In this case, the purchase of merchandise or raw
        materials and component parts is done just in time for sale or for use in manufacture; often a
        few hours, before the manufacture or sale. It involves completing the manufacturing process
        just in time to dispatch finished goods. It reduces money “tied-up” in inventory of raw material
        and finished goods. There is no need to maintain large inventory storage facilities. But the
        disadvantage is that delay in arrival of raw material may halt operations.

Just-in-time (JIT) inventory systems are not a simple method that a company can adopt; it has a whole
philosophy that the company must follow in order to avoid its downsides. The ideas in this philosophy
come from many different disciplines including statistics, industrial engineering, production
management and behavioral science. In the JIT inventory philosophy there are views with respect to
how inventory is looked upon, what it says about the management within the company, and the main
principle behind JIT.

                          Copyright© Virtual University of Pakistan                                  66
Financial Statement Analysis-FIN621                                                                      VU

Inventory is seen as incurring costs, or waste, instead of adding value, contrary to traditional thinking.
This does not mean to say that JIT is unaware that removing inventory exposes manufacturing issues.
Under the philosophy, businesses are encouraged to eliminate inventory that doesn’t compensate for
manufacturing issues, and to constantly improve processes so that inventory can be removed. Secondly,
allowing any stock habituates the management to stock and it can then be a bit like a narcotic.
Management is then tempted to keep stock there to hide problems within the production system. These
problems include backups at work centers, machine reliability, and process variability, lack of flexibility
of employees and equipment, and inadequate capacity among other things.
In short, the just-in-time inventory system is all about having “the right material, at the right time, at the
right place, and in the exact amount” but its implications are broad for the implementors.

Criticisms

Shocks

JIT emphasizes inventory as one of the seven wastes, and as such its practice involves the philosophical
aim of reducing input buffer inventory to zero. Zero buffer inventories means that production is not
protected from exogenous (external) shocks. As a result, exogenous shocks reducing the supply of input
can easily slow or stop production with significant negative consequences.

Transaction Cost Approach

JIT reduces inventory in a firm, however unless it is used throughout the supply chain, then it can be
proposed that firms are simply outsourcing their input inventory to suppliers.

Implementation

Effects

Some of the initial results at vehicle manufacturing company were horrible, but in contrast to that a huge
amount of cash appeared, apparently from nowhere, as in-process inventory was built out and sold. This
by itself generated tremendous enthusiasm in upper management.
Another surprising effect was that the response time of the factory fell to about a day. This improved
customer satisfaction by providing vehicles usually within a day or two of the minimum economic
shipping delay.
Also, many vehicles began to be built to order; completely eliminating the risk they would not be sold.
This dramatically improved the company's return on equity by eliminating a major source of risk.
.

Benefits

As most companies use an inventory system best suited for their company, the Just-In-Time Inventory
System (JIT) can have many benefits resulting from it. The main benefits of JIT are listed below.
1.       Set up times is significantly reduced in the warehouse. Cutting down the set up time to be more
productive will allow the company to improve their bottom line to look more efficient and focus time
spent on other areas that may need improvement.
2.       The flows of goods from warehouse to shelves are improved. Having employees focused on
specific areas of the system will allow them to process goods faster instead of having them vulnerable to
fatigue from doing too many jobs at once and simplifies the tasks at hand.
3.       Employees who possess multiple skills are utilized more efficiently. Having employees trained
to work on different parts of the inventory cycle system will allow companies to use workers in
situations where they are needed when there is a shortage of workers and a high demand for a particular
product.


                            Copyright© Virtual University of Pakistan                                      67
Financial Statement Analysis-FIN621                                                               VU

4.       Better consistency of scheduling and consistency of employee work hours. If there is no
demand for a product at the time, workers don’t have to be working. This can save the company money
by not having to pay workers for a job not completed or could have them focus on other jobs around the
warehouse that would not necessarily be done on a normal day.
5.       Increased emphasis on supplier relationships. No company wants a break in their inventory
system that would create a shortage of supplies while not having inventory sit on shelves. Having a
trusting supplier relationship means that you can rely on goods being there when you need them in order
to satisfy the company and keep the company name in good standing with the public.
6.       Supplies continue around the clock keeping workers productive and businesses focused on
turnover. Having management focused on meeting deadlines will make employees work hard to meet
the company goals to see benefits in terms of job satisfaction, promotion or even higher pay.


                          Copyright© Virtual University of Pakistan                                 68
Financial Statement Analysis-FIN621                                                                  VU

                                                                                               Lesson-19
                            NOTES TO FINANCIAL STATEMENTS
                                              (Continued)

Charging Costs of Inventory to Income Statement

               This is also known as cost flows of inventory. Inventory units may be acquired at
different costs because of different purchase dates or different suppliers. Question is: Which of these
costs are to be used as “cost of goods sold”?

               Purchase/ → Balance sheet → sale of goods → cost of → Income
              Manufacture current assets.                    Good     Statement
              Cost of inventory                              sold
                                                              (?)

             Measuring “cost of goods sold” involves valuation and pricing of Inventory and this is
determined by Inventory Accounting Policies.

              As on example consider that 2 ACs were purchased in January @ Rs.20, 000 each, and 3
@ Rs.25, 000 each in February. One AC was sold in March. What would be the cost of goods sold:
Rs.20, 000 or Rs.25, 000?

             Two approaches can be adopted in this case i.e. specific identification and cost-flow
assumptions. Either is acceptable but an approach once selected, is to be applied consistently.


             In specific identification approach, the Units are identified specifically, which clearly
shows as to which particular unit is being sold and what was its cost, which would be its “cost of goods
sold”.

A Note on the Impact of Inventory Levels on Net Income

Fluctuations in inventory levels can cause profit variations when inventory is valued according to
GAAP standards. GAAP standards require that all manufacturing costs must be capitalized in inventory
regardless of whether the costs are variable or fixed.

The inclusion of fixed costs in the unit cost causes profits to rise as inventory levels raise because the
fixed cost in inventory is stored on the balance sheet instead of being carried over to the income
statement. When the inventory level falls, this fixed cost that has been stored on the balance sheet is
moved over to the income statement thereby causing net profit to fall.

To illustrate this phenomenon I first present a one month income statement constructed using only
variable costs in inventory (in this case, materials only).

        Sales                                                                     $1,837,380
        Cost of materials                                                            458,000
        Margin                                                                    1,379,380

        Expenses
        Labor                                                         224,000
        Overhead                                                      344,288
        Depreciation                                                  270,000

                            Copyright© Virtual University of Pakistan                                  69
Financial Statement Analysis-FIN621                                                              VU

        Administrative                                             210,000
        Marketing                                                  175,000
        Total expenses                                                           1,223,288

        Profit before taxes                                                      156,092
        Income taxes @ 35%                                                         54,632

        Net Profit                                                               $101,460

        Computation of Unit Values
        Sales                                                      Flow
                      Valves             Pumps                     Controllers   Total
        Units         7,500              12,500                    4,000         24,000
        Selling Price $57.78             $81.26                    $97.07        $1,837,380
        Material cost 16.00              20.00                     22.00         458,000
        Unit margin 41.78                61.26                     75.07

        Total margin     $313,350        $765,750                  $300,280      $1,379,380

 Next I show two income statements for two months with the identical sales as in the first income
statement that uses only variable costs in inventory. However, in these two income statements the
inventory levels change; in the Month 1 statement the inventory of Valves rises by 1,000 units, and in
the Month 2 statement Valve inventory falls by 1,000 units.

           Month 1
                                                          Flow
                               Valves      Pumps          Controllers     Total
           Unit Sales          7,500       12,500         4,000           24,000
           Units Produced      8,500       12,500         4,000           25,000
           Ending Inv.         1,000       0              0               1,000
           Unit cost           37.75       48.87          100.57
           Sales Price         $57.78      $81.26         $97.07
           Dollar sales        433,350     1,015,750      388,280         1,837,380

           Income Statement

           Sales                                                          $1,837,380
           Cost of goods sold
           Begin inv.                                     0
           Costs added
           Materials                                      474,000
           Labor                                          155,600
           Overhead                                       682,688
           Total costs added                              1,312,288
           Goods available                                1,312,288
           Ending inv.        1,000                          37,749
           Cost of goods sold                                             1,274,539

           Gross Profit                                                   562,841
                           Copyright© Virtual University of Pakistan                               70
Financial Statement Analysis-FIN621                                                   VU


          Administrative                                 210,000
          Marketing                                      175,000
          Total expenses                                                    385,000

          Profit before taxes                                            177,841
          Income taxes @ 35%                                                62,244
          Net Profit                                                     $115,597


              Month 2

                                                          Flow
                                  Valves     Pumps        Controllers   Total
              Unit Sales          7,500      12,500       4,000         24,000
              Units Produced      6,500      12,500       4,000         23,000
              Unit cost           37.75      48.87        100.57
              Sales Price         $57.78     $81.26       $97.07
              Dollar sales        433,350    1,015,750    388,280       1,837,380

              Income Statement

              Sales                                                     $1,837,380
              Cost of goods sold
              Begin inv.                                  37,749
              Costs added
              Materials                                   442,000
              Labor                                       155,600
              Overhead                                    682,688
              Total costs added                           1,280,288
              Goods available                             1,318,037
              Ending inv.        0                                0
              Cost of goods sold                                        1,318,037

              Gross Profit                                              519,343

              Administrative                              210,000
              Marketing                                   175,000
              Total expenses                                             385,000

              Profit before taxes                                       134,343
              Income taxes @ 35%                                          47,020
              Net Profit                                                $87,323


                           Copyright© Virtual University of Pakistan                  71
Financial Statement Analysis-FIN621                                                               VU

Notice how the net incomes changed from one month to the next even though sales remained the same.
This example used activity based costs for costing the units of product, but any costing method that
assigns fixed costs to units will give the same result.

To more clearly show why the incomes differ, consider the following table that shows variable unit
costs and the unit fixed costs assigned to the units by the ABC costing system.

                                                                          Flow
                                    Valves                 Pumps          Controllers
          ABC unit cost             $37.75                 $48.87         $100.57
          Unit variable cost        16.00                  20.00          22.00
          Fixed cost per unit       21.75                  28.87          78.57
          Times                     x
          Inventory change in units 1,000
          Equals--Difference in pre$21,749
          tax income

          Profit before taxes--unit$156,092
          variable costs
          Profit before taxes--ABC177,841
          unit costs Month 1
          Difference in profit before(21,749)
          taxes

          Profit before taxes--unit$156,092
          variable costs
          Profit before taxes--ABC134,343
          unit costs Month 2
          Difference in profit before$21,749
          taxes

The difference between the net income before taxes for the income statement with variable costs and the
one with the ABC costs is always explained by the unit change in inventory multiplied by the fixed
overhead per unit.

Inventory Errors and Financial Statements

Income statement effects.
An incorrect inventory balance causes an error in the calculation of cost of goods sold and,
therefore, an error in the calculation of gross profit and net income. Left unchanged, the error has
the opposite effect on cost of goods sold, gross profit, and net income in the following accounting
period because the first accounting period's ending inventory is the second period's beginning
inventory. The total cost of goods sold, gross profit, and net income for the two periods will be
correct, but the allocation of these amounts between periods will be incorrect. Since financial
statement users depend upon accurate statements, care must be taken to ensure that the inventory
balance at the end of each accounting period is correct. The chart below identifies the effect that
an incorrect inventory balance has on the income statement


                          Copyright© Virtual University of Pakistan                                 72
Financial Statement Analysis-FIN621                                                           VU


                                      Impact of Error on
               Error in Inventory Cost of Goods Sold Gross Profit Net Income
               Ending Inventory
                Understated           Overstated           Understated   Understated
                Overstated            Understated          Overstated    Overstated
               Beginning Inventory
                Understated           Understated          Overstated    Overstated
                Overstated            Overstated           Understated   Understated

Balance sheet effects.
An incorrect inventory balance causes the reported value of assets and owner's equity on the
balance sheet to be wrong. This error does not affect the balance sheet in the following accounting
period, assuming the company accurately determines the inventory balance for that period.


                                       Impact of Error on
                 Error in Inventory Assets =        Liabilities + Owner's Equity
                 Understated           Understated No Effect      Understated
                 Overstated            Overstated   No Effect     Overstated


Financial Statements with Inventory
The statement of owner's equity and the statement of cash flows are the same for merchandising
and service companies. Except for the inventory account, the balance sheet is also the same. But a
merchandising company's income statement includes categories that service enterprises do not use.
A single-step income statement for a merchandising company lists net sales under revenues and
the cost of goods sold under expenses.


                         Copyright© Virtual University of Pakistan                              73
Financial Statement Analysis-FIN621                                                                     VU

                                                                                                 Lesson-20
                               NOTES TO FINANCIAL STATEMENTS
                                                 (Continued)


In cost-flow assumptions, three methods for measuring “cost of good sold”, under GAAP are used.

              In these three methods, assumptions are made as to the sequence in which units were
withdrawn from inventory. The three flow assumptions are:-

i)         Average cost: Values all merchandise (units sold and in balance) at the
                 Average per-unit cost, under the assumption of random withdrawal of inventory units.


                   Average cost in the above example: Rs.23, 000 per AC. That would be the cost of goods
                   sold. Ending Inventory to be recorded on balance sheet would also take into account this
                   figure of reduction in Inventory.

ii)        First-in-First - out (FIFO): goods sold are assumed to be the first units   that were purchased.

iii)       Last-in-First-Out (LIFO): units sold are assumed to be those which were most recently
                   acquired.

              During Inflation, FIFO shows less expense on income statement and higher inventory
valuation on balance sheet and values ending inventory at current cost, whereas LIFO shows higher
expenses on income statement and lower inventory valuation on balance sheet.

             It should be noted that Inventory valuation significantly affects both b/sheet and income
statements. Each valuation method/cost-assumption produces different results in financial statements
and tax returns.

Valuation of Stock

Any manufacturing organization purchases different material through out the year. The prices of
purchases may be different due to inflationary conditions of the economy. The question is, what item
should be issued first & what item should be issued later for manufacturing. For this purpose, the
organization has to make a policy for issue of stock. All the issues for manufacturing and valuation of
stock are recorded according to the policy of the organization. Mostly these three methods are used for
the valuation of stock:

       •   First in first out (FIFO)
       •   Last in first out (LIFO)
       •   Weighted average

First in first out (FIFO)

The FIFO method is based on the assumption that the first merchandise purchased is the first
merchandised issued. The FIFO uses actual purchase cost. Thus, if merchandise has been purchased at
several different costs, the inventory (stock) will have several different cost prices. The cost of goods
sold for a given sales transaction may involve several different cost prices.

Characteristics

       •   This is widely used method for determining values of cost of goods sold and closing stock.
                               Copyright© Virtual University of Pakistan                                74
Financial Statement Analysis-FIN621                                                                  VU

    •   In the FIFO method, oldest available purchase costs are transferred to cost of goods sold. That
        means the cost if goods sold has a lower value and the profitability of the organization becomes
        higher.
    •   As the current stock is valued at recent most prices, the current assets of the company have the
        latest assessed values.

Last in first out (LIFO)

As the name suggests, the LIFO method is based on the assumption that the recently purchased
merchandise is issued first. The LIFO uses actual purchase cost. Thus, if merchandise has been
purchased at several different costs, the inventory (stock) will have several different cost prices. The
cost of goods sold for a given sales transaction may involve several different cost prices.

Characteristics

    •   This is alternatively used method for determining values of cost of goods sold and closing stock.

    •   In the LIFO method recent available purchase costs are transferred to cost of goods sold. That
        means the cost of goods sold has a higher value and the profitability of the organization
        becomes lower.
    •   As the current stock is valued at oldest prices, the current assets of the company have the oldest
        assessed values.

Weighted average method

When weighted average method is in use, the average cost of all units in inventory, is computed after
every purchase. This average cost is computed by dividing the total cost of goods available for sale by
the number of units in inventory. Under the average cost assumption, all items in inventory are assigned
the same per unit cost. Hence, it does not matter which units are sold; the cost of goods sold is always
based on current average unit cost.

Characteristics

    • Under the average cost assumption, all items in inventory are assigned same per unit cost (the
      average cost). Hence it does not matter which units are sold first. The cost of goods sold is
      always on the current average unit cost.
   • Since all inventories are assigned same cost, this method does not make any effect on the
      profitability and does not increase/decrease any asset in the financial statements.
   • This is the alternatively used method for determining values of cost of goods sold and closing
      stock.
Example
   • Receipts:
              01 Jan 20--,     10 units @ Rs. 150 per unit
              02 Jan 20--,     15 units @ Rs. 200 per unit
              10 Jan 20--,     20 units @ Rs. 210 per unit
   • Issues:
              05 Jan 20--,     05 units
              06 Jan 20--,     10 units
              15 Jan 20--,     15


                           Copyright© Virtual University of Pakistan                                   75
Financial Statement Analysis-FIN621                                                               VU

FIFO Method of Stock Valuation

       Date          Receipts           Issues                       Value of Stock
       01-01-20--    10 @ Rs. 150                                    10 x 150 = 1500
       02-01-20--    15 @ Rs. 200                                    10 x 150 = 1500
                                                                     15 x 200 = 3000
                                                                     4500
       05-01-20--                       5 @ 150 = 750       750       5 x 150 = 750
                                                                     15 x 200          =   3000
                                                                     3750
       06-01-20--                       5 @ 150 = 750                 0 x 150 =    0
                                        5 @ 200 = 1000 1750          10 x 200          =   2000
                                                                     2000
       10-01-20--    20 @ Rs. 210                                    10 x 200 = 2000
                                                                     20 x 210          =   4200
                                                                     6200
       15-01-20--                       10 @ 200 = 2000               0 x 200 =    0
                                        5 @ 210 = 1050 3050          15 x 210          =   3150
                                                                     3150

Weighted Average Method of Stock Valuation

       Date         Receipts        Issues                 Value of Stock       Average Cost
       01-01-20-- 10x150 = 1500                                         1500    1500/10=150
       02-01-20-- 15x200 = 3000                            1500 + 3000 = 4500   4500/25=180


       05-01-20--                       5x180 = 900        4500 – 900 = 3600    3600/20=180


       06-01-20--                   10x180 = 1800          3600 – 1800 = 1800   1800/10=180
       10-01-20-- 20x210 = 4200                            1800 + 4200 = 6000   6000/30=200

       15-01-20--                   15x200 = 3000          6000 – 3000 = 3000   3000/15=200


Effects of valuation method on profit

FIFO Method
   • Cost of Sales     = 750 + 1750 + 3050       = 5,550
      Gross Profit     = 7500 – 5550             = 1,950

Weighted Average Method
   • Cost of Sales = 900 + 1800 + 3000           = 5,700
       Gross Profit  = 7500 – 5700               = 1,300


                         Copyright© Virtual University of Pakistan                                76
Financial Statement Analysis-FIN621                                                                 VU


Illustration

XYZ Company is a manufacturing concern. Following is the receipts & issues record for the month of
May, 2002

        Date                      Receipts                                  Issues
        May 7            200 units @ Rs. 50/unit
        May 9                                                    60 units
        May 13           150 units @ Rs. 75/unit
        May 18           100 units @ Rs. 60/unit
        May 22                                                   150 units
        May 24                                                   100 units
        May 27           100 units @ Rs. 50/unit
        May 30                                                   200 units
Calculate the value of closing stock by
    • FIFO Method
    • Average Method

Solution
Valuation of Stock by FIFO Method

   Date        Receipts    Issues         Value of Stock Total         Remaining      Net Balance
                                                          Amount       No. of units
   May 7       200 units @                200 x 50 = 10,000            200            10,000
               Rs. 50/unit                10,000
   May 9                   60 units @ Rs. 60 x 50 = 3,000 (3,000)      140            7,000
                           50/unit
   May 13      150 units @                75 x 150 = 11,250            290            18,250
               Rs. 75/unit                11,250
   May 18      100 units @                60 x 100 = 6,000             390            24,250
               Rs. 60/unit                6,000
   May 22                  140 units @ 50 x 140 = (7,750)              240            16,500
                           Rs. 50/unit    7,000
                           10 units @ Rs.
                           75/unit          10 x 75 =
                                          750
   May 24                  100 units @ 75       x     100 (7,500)      140            9,000
                           Rs. 75/unit    =7,500
   May 27      100 units @                50 x 100 = 5,000             240            14,000
               Rs. 50/unit                5,000
   May 30                  40 units @ Rs. 75 x 40 = 3,000 (12,000)     40             2,000
                           75/unit
                           100 units @ 60 x 100 =
                           Rs. 60/unit    6,000
                           60 units @ Rs.
                           50/unit        50 x 60 = 3,000


                            Copyright© Virtual University of Pakistan                               77
Financial Statement Analysis-FIN621                                                        VU

    Valuation of Stock by Weighted Average Method:

Date Receipts Issues Value         of Total       Total Units       Average          Net
                     Stock            Amount(Rs.)                   Cost(Rs.)/unit   Balance
                                                                                     (Rs.)
May 200 units         200 x 50      10,000        200               50               10,000
7   @     Rs.         =
    50/unit           10,000
May           60      60 x 50       (3,000)       140                                7,000
9             units   =
                      3,000
May 150 units         150 x 75      7,000+11250         140+150=290 18250/290=62.9 18,250
13 @      Rs.         =             =
    75/unit           11,250        18250
May 100 units         100 x 60      18250+6000    290+100           24250/390        24,250
18 @      Rs.         =             =             =                 =
    60/unit           6,000         24250         390               62.2
May           150     150 x 62.2    (9,330)       390-150                            14,920
22            units   =                           =
                      9330                        240

May           100     100 x 62.2    (6,220)       240-100                            8,700
24            units   =                           =
                      6220                        140
May 100 units         100 x 50      8,700+5,000   140+100           13700/240        13,700
27 @      Rs.         =             =             =                 =
    50/unit           5,000         13,700        240               57.1
May           200     200 x 57.1    (11,420)      240-200                            2,280
30            units   =                           =
                      11,420                      40


                             Copyright© Virtual University of Pakistan                         78
Financial Statement Analysis-FIN621                                                                      VU

                                                                                                  Lesson-21
                             NOTES TO FINANCIAL STATEMENTS
                                                (Continued)


Depreciation Accounting Policies.

             Depreciation is the expired or used portion of a fixed asset during an accounting period.
This is taken into account to achieve the matching principle of matching revenues earned during an
accounting period with the expenses incurred during that period. Since plant assets have useful life
spreading over a number of accounting periods, the portion used in one accounting period is charged to
Income Statement of that accounting period in the form of Depreciation Expense.

             Land is recorded at cost, other fixed assets are recorded at Book Value i.e. cost less
accumulated depreciation. For this, separate Depreciation Expense and Accumulated Depreciation
Accounts for different plant assets are maintained. It must also be noted that depreciation is a process of
cost allocation and not a process of valuation as such.

Computing Depreciation

            Different methods are available for computing depreciation of fixed assets. Different
methods can be used for different assets. However, comparison among firms with different depreciation
methods becomes difficult because of the fact that each firm uses different methods for calculating
depreciation, which ultimately affect its net income and balance sheet.

Methods of Computing Depreciation

        i)       Straight-line method: In this, the depreciation expenses are spread evenly         over
                 periods. Assume that a plant asset is acquired for Rs.17, 000. It is estimated that its
                 useful life is five years and residual value (salvage value) at the end of five years is
                 Rs.2, 000.

Depreciation is a systematic allocation of the cost of a depreciable asset to expense over its useful life. It
is a process of charging the cost of fixed asset to profit & loss account.

Fixed Assets are those assets which are:
    • Of long life
    • To be used in the business to generate revenue
    • Not bought with the main purpose of resale.

Fixed assets are also called “Depreciable Assets”

When an expense is incurred, it is charged to profit & loss account of the same accounting period in
which it has incurred. Fixed assets are used for longer period of time. Now, the question is how to
charge a fixed asset to profit & loss account. For this purpose, estimated life of the asset is determined.
Estimated useful life is the number of years in which a fixed asset is expected to be used efficiently. It is
the life for which a machine is estimated to provide more benefit than the cost to run it. Then, total cost
of the asset is divided by total number of estimated years. The value, so determined, is called
‘depreciation for the year’ and is charged to profit & loss account. The same amount is deducted from
total cost of fixed asset in the financial year in which depreciation is charged. The net amount (after
deducting depreciation) is called ‘Written down Value’.

WDV = Original cost of fixed asset – Accumulated Depreciation

                            Copyright© Virtual University of Pakistan                                      79
Financial Statement Analysis-FIN621                                                                  VU

Accumulated Depreciation is the depreciation that has been charged on a particular asset from the time
of purchase of the asset to the present time. This is the amount that has been charged to profit and loss
account from the year of purchase to the present year.

Depreciation accumulated over the years is called accumulated depreciation.

Useful Life
   • Useful Life or Economic Life is the time period for machine is expected to operate efficiently.
   • It is the life for which a machine is estimated to provide more benefit than the cost to run it.

Grouping of Fixed Assets

Major groups of Fixed Assets:
       • Land
       • Building
       • Plant and Machinery
       • Furniture and Fixtures
       • Office Equipment
       • Vehicles

No depreciation is charged for ‘Land’. In case of ‘Leased Asset/Lease Hold Land’ the amount paid for it
is charged over the life of the lease and is called Amortization.

Journal entries for recording Depreciation

Purchase of fixed asset:

        Debit:             Relevant asset account
        Credit:                   Cash, Bank or Payable Account

For recording of depreciation, following two heads of accounts are used:
    • Depreciation Expense Account
    • Accumulated Depreciation Account

Depreciation expense account contains the depreciation of the current year. Accumulated depreciation
contains the depreciation of the asset from the financial year in which it was bought up to the present
financial year. . Depreciation of the following years in which asset was used is added up in this account.
In other words, this head of account shows the cost of usage of the asset up to the current year.
Depreciation account is charged to profit & loss account under the heading of Administrative Expenses.
In the balance sheet, fixed assets are presented at written down value i.e.

WDV = Actual cost of fixed asset – Accumulated Depreciation.

Journal entry for the depreciation is given below:

        Debit: Depreciation Expenses Account
        Credit:       Accumulated Depreciation Account

Presentation of Depreciation

Charging depreciation to any head in profit & loss account depends upon the nature of work performed
by the asset. Consider an organization has purchased computers. If computers are being used by the
management, this means that administrative work is done by computers. So, depreciation of computers
will be charged to Administrative Expenses. On the other hand, if machines working in the factory are
                             Copyright© Virtual University of Pakistan                                 80
Financial Statement Analysis-FIN621                                                                  VU

computerized. The value of depreciation of the computers attached with the machines will be charged to
cost of goods sold. The reason being, the computers are the part of manufacturing process &
depreciation of computers will be charged to the cost of production. Again consider the selling
department of the business is very large. Depreciation of computers used in selling department will be
charged to selling expenses.
You can see that computer is a single asset and its depreciation is charged in three different heads
depending upon the nature of work done by the computer.
Depreciation for the year is charged to:
        i.       Cost of Goods Sold
        ii.      Administrative Expenses
        iii.     Selling Expenses
In balance sheet Fixed Assets are shown at Cost less Accumulated Depreciation i.e. written Down Value
(WDV).


Methods of calculating Depreciation

There are several methods for calculating depreciation. At this stage, we will discuss only two of them
namely:
   • Straight line method or Original cost method or Fixed installment method
   • Reducing balance method or Diminishing balance method or written down method.


Straight Line Method

Under this method, a fixed amount is calculated by a formula. That fixed amount is charged every year
irrespective of the written down value of the asset. The formula for calculating the depreciation is given
below:

Depreciation = (cost – Residual value) / Expected useful life of the asset

Residual value is the cost of the asset after the expiry of its useful life.
Under this method, at the expiry of asset’s useful life, its written down value will become zero. Consider
the following example:

    •   Cost of the Asset                = Rs.100,000
    •   Life of the Asset                       = 5 years
    •   Annual Depreciation              = 20 % of cost or Rs.20,000

Written down value method

    •   Cost of the Asset                = Rs. 100,000
    •   Annual Depreciation              = 20%
                Year 1 Depreciation      = 20 % of 100,000        = 20,000
                Year 1 WDV               = 100,000 – 20,000       = 80,000
                Year 2 Depreciation      = 20 % of 80,000         = 16,000
                Year 2 WDV               = 80,000 – 16,000        = 64,000

Illustration:

Cost of an asset:      Rs. 120,000
Residual value: Rs. 20,000
Expected life: Rs. 5 years


                           Copyright© Virtual University of Pakistan                                   81
Financial Statement Analysis-FIN621                                                                  VU

Calculate depreciation and the written down value of the asset for five years.

Solution

Straight line method

        Depreciation = (120,000 – 20,000) / 5 = Rs. 20,000

                     Particulars                        Depreciation      Written
                                                        (Rs)              Down
                                                                          Value
                                                                          (Rs.)
                     Depreciable cost                                     100,000
                     Dep. Of the 1st year               (20,000)          80,000
                     Dep. Of the 2nd year               (20,000)          60,000
                     Dep. Of the 3rd year               (20,000)          40,000
                     Dep. Of the 4th year               (20,000)          20,000
                     Dep. Of the 5th year               (20,000)          0


Reducing Balance Method

Under this method, depreciation is calculated on written down value. In the first year, depreciation is
calculated on cost. Afterwards written down value is calculated by deducting accumulated depreciation
from the cost of that asset(cost – accumulated depreciation) and depreciation is charged on that value. In
this method, the value of asset never becomes zero. Consider the following example:
Cost of an asset         Rs. 100,000
Expected life            Rs. 5 years
Depreciation rate        20%

Solution

            Particulars                        Depreciation     Accumulated       Written
                                               (Rs)             Depreciation      Down
                                                                (Rs.)             Value
                                                                                  (Rs.)
            Depreciable cost                                                      100,000
            Dep. Of the 1st year
            100,000 x 20%                      20,000           20,000            80,000
            Dep. Of the 2nd year
            80,000 x 20%                       16,000           36,000            64,000
            Dep. Of the 3rd year
            64,000 x 20%                       12,800           48,800            51,200
            Dep. Of the 4th year
            51,200 x 20%                       10,240           59,040            40,960
            Dep. Of the 5th year
            40,960 x 20%                       8,192            67,232            32,768

You see, at the end of five years, WDV of the asset is Rs. 32,768, not zero. But in case of straight line
method, the WDV, after five years was zero. So, in the opinion of some people, reducing balance


                           Copyright© Virtual University of Pakistan                                   82
Financial Statement Analysis-FIN621                                                                     VU

method is better than that of straight line method, but both methods are effective. It is the management
that has to decide, which method is best suited to their business.
Once an asset has been fully depreciated, no more depreciation should be recorded on it, even though
the property may be in good condition and may be in use. The objective of depreciation is to spread the
cost of an asset over the periods of its usefulness; in no case can depreciation be greater than the amount
paid for the asset. When a fully depreciated asset is in use beyond the original estimate of useful life, the
asset account and the accumulated depreciation account should remain in the accounting records
without further entries until the asset is retired.

Reducing Balance Method

In this method, depreciation is calculated on written down value. In the first year, depreciation is
calculated on cost. Afterwards written down value is calculated by deducting accumulated depreciation
from the cost of that asset (cost – accumulated depreciation) and depreciation is charged on that value.

Cost of Asset – Price at which the asset was initially recorded

Written Down Value / Book Value – Cost minus Accumulated Depreciation.

In reducing balance method, a formula is used for calculation the depreciation rate i.e.

        Rate = 1 –   n RV / C

    Where:
      “RV” = Residual Value
      “C” = Cost
      “n” = Life of Asset

Calculate the rate if:
   Cost                                            = 100,000
   Residual Value (RV)                                    = 20,000
   Life                                                   = 3 years

    Rate =       1–3     20000/100000

         = 42%

Year 1
Cost                                               100,000
Depreciation 100,000 x 42%                          (42,000)
WDV (Closing Balance)                                58,000
Year 2
WDV (Opening Balance)
58,000
Depreciation  58,000 x 42%                         (24,360)
WDV (Closing Balance)                               33,640
Year 3
WDV (Opening Balance)                               33,640
Depreciation  33,640 x 42%                         (14,128)
WDV (Closing Balance)                               19,511


Disposal of Asset


                            Copyright© Virtual University of Pakistan                                     83
Financial Statement Analysis-FIN621                                                                VU

Cost of Asset                                       = 100,000
Life of the Asset                                           = 5 Years
Depreciation Method                                 = Straight Line
Residual Value                                      = Rs.10000
Sale Price after Five Years                         = Rs.15000

Depreciation per year = (100000-10000) / 5
                     = Rs.5000 per year

Total Depreciation in Five Years                           = 18,000 x 5
                                                    = 90,000

Book Value after Five Years                      = 100,000- 90,000
                                                 = 10,000

Profit on Disposal                                  = 15,000 – 10,000
                                                    = Rs.5000

Recording of Disposal
       Debit          Fixed Asset Disposal A/c                              100,000
       Credit                 Fixed Asset Cost A/c                                    100,000
                      (With the cost of asset)

        Debit           Accumulated Dep. A/c                                90,000
        Credit                  Fixed Asset Disposal A/c                              90,000
                        (With the depreciation accumulated to date)

        Debit           Cash / Bank / Receivable A/c                        15,000
        Credit                  Fixed Asset Disposal A/c                              15,000
                        (With the price at which asset is sold)

[Note: one group to appear at a time]

Disposal of Asset Account


      Fixed Asset Disposal Account
      Debit                                             Credit
      Cost Account                        100,000       Acc. Dep. Account                 90,000
                                                        Cash / Bank                       15,000


       P & L Account                      5000
       ( Balancing Figure)
       Total                              105000         Total                            105000


Policy for Depreciation
                              Copyright© Virtual University of Pakistan                            84
Financial Statement Analysis-FIN621                                                                    VU

The management of the business selects the policy for charging depreciation. There is no law binding on
the management. The management is free to choose method of depreciation and policy of charging
depreciation. Normally two policies are commonly used:
    • Depreciation on the basis of use
    • In the year of purchase, full year’s depreciation is charged; where as, in the year of sale no
        depreciation is charged.
Now it is up to the management to decide, what method and what policy is better and effective for their
business.

Disposal of Fixed Asset

When depreciable asset is disposed off at any time during the financial year, an entry should be made to
give effect of the disposal. Since, the residual value of asset is only estimated; it is common for asset to
be sold at price that differs from its book value at the date of disposal. When asset is sold, any profit or
loss is computed by comparing book value with the amount received from sale. As you know, book
value is obtained by deducting accumulated depreciation from original cost of the asset. A sale price in
excess of the book value produces profit; a sale price below the book value produces loss. This profit or
loss should be shown in the profit & loss account.

Entries for Recording Disposal

        Debit            Fixed Asset Disposal A/c
        Credit           Fixed Asset Cost A/c
                         (With the cost of asset)

        Debit           Accumulated Dep. A/c
        Credit           Fixed Asset Disposal A/c
                       (With the depreciation accumulated to date)

        Debit            Cash / Bank / Receivable A/c
        Credit            Fixed Asset Disposal A/c
                         (With the price at which asset is sold)
Example

    •   An asset is purchased for Rs. 500,000 on Nov. 01, 2001.
    •   Depreciation rate is 10% p.a.
    •   The Asset is sold on Apr. 30, 2004.
    •   Financial Year is July 1 to June 30

Question
   • Calculate the WDV For both policies


                           Copyright© Virtual University of Pakistan                                     85
Financial Statement Analysis-FIN621                                           VU


Depreciation is charged on the Basis of Use

                  Year            On the Basis of Use              Rs.
                  1-11-2001       Cost                             500,000
                  2001-2002       Dep. 500,000 x 10% x 8 / 12      (33,333)
                  30-6-2002       WDV                              466,667
                  2002-2003       Dep. 466,666 x 10%               (46,667)
                  30-6-2003       WDV                              420,000
                  2003-2004       Dep. 420,000 x 10% x 10 / 12     (35,000)
                  30-4-2004       WDV                              385,000


Full Depreciation in the Year of Purchase

                 Year            Full Dep. in year of Purchase     Rs.
                 1-11-2001       Cost                              500,000
                 2001-2002       Dep. 500,000 x 10%                (50,000)
                 30-6-2002       WDV                               450,000
                 2002-2003       Dep. 450,000 x 10%                (45,000)
                 30-6-2003       WDV                               405,000
                 2003-2004       Dep. 00 in the year of sale       00
                 30-6-2004       WDV                               405,000


Contents of Fixed Assets Register
   • Different record for each class of assets
   • Date of purchase
   • Detailed particulars of asset
   • Location of asset
   • Record of depreciation

Illustration
        Cost of asset                    Rs. 200,000
        Life of the asset        5 years
        Depreciation method              Straight line
        Residual value                   Rs. 20,000
        Sale price after 5 years 30,000

Calculate profit/Loss on the sale of the asset?


                             Copyright© Virtual University of Pakistan        86
Financial Statement Analysis-FIN621                                                               VU


Solution

Written down value = 200,000 – 20,000 = 180,000
Depreciation/year = 180,000/5 = 36,000 (Straight line method)

Particulars                                         Depreciation (Rs)         Written     Down
                                                                              Value (Rs.)
Depreciable cost                                                              200,000
Dep. Of the 1st year                                (36,000)                  164,000
Dep. Of the 2nd year                                (36,000)                  128,000
Dep. Of the 3rd year                                (36,000)                  92,000
Dep. Of the 4th year                                (36,000)                  56,000
Dep. Of the 5th year                                (36,000)                  20,000


Book value after five years                              Rs. 20,000
Sale price                                               Rs. 30,000
Profit on sale                                           Rs. 10,000 (30,000 – 20,000)

Same illustration is solved by reducing balance method

Cost of asset                                            Rs. 200,000
Residual value                                           Rs. 20,000
Estimated useful life                                    5 years
Calculation of depreciation rate
                                               ____
                                       n
                Depreciation Rate = 1 – √Rv/c
                                               _____________
                                     = 1 - 5√20,000/200,000
                                     = 37%
Allocation of depreciation is given below:

Particulars                                Depreciation (Rs)   Accumulated         Written Down
                                                               Depreciation        Value (Rs.)
                                                               (Rs.)
Depreciable cost                                                                   200,000
Dep. Of the 1st year
200,000 x 37%                              74,000              74,000              126,000
Dep. Of the 2nd year
126,000 x 37%                              46,620              120,620             79,380
Dep. Of the 3rd year
79,380 x 37%                               29,371              149,991             50,009
Dep. Of the 4th year
50,009 x 37%                               18,503              168,494             31,506
Dep. Of the 5th year
31,506 x 37%                               11,657              180,151             19,849

Book value after five years                              Rs. 19,849
Sale price                                               Rs. 30,000

Profit on sale                                           Rs. 10,151 (30,000 – 19,849)

                          Copyright© Virtual University of Pakistan                               87
Financial Statement Analysis-FIN621                                                                    VU


If an asset is not completed at that time when balance sheet is prepared, all costs incurred on that asset
up to the balance sheet date are transferred to an account called Capital Work in Progress Account.
This account is shown separately in the balance sheet below the fixed asset. Capital work in progress
account contains all expenses incurred on the asset until it is converted into working condition. All these
expenses will become part of the cost of that asset. When an asset is completed and it is ready to work,
all costs in the capital work in progress account will transfer to the relevant asset account through the
following entry:

        Debit:                            Relevant asset account
        Credit:                           Capital work in progress account

Illustration # 1

A machine is purchased for Rs. 400,000. Its useful life is estimated to be five years. Its residual value is
Rs. 25,000. After four years, it was sold for Rs. 40,000. For the purpose of WDV, its depreciation rate is
40%.

You are required to show calculation of depreciation for four years. Also calculate profit or loss on
disposal.

Solution

Calculation of depreciation and profit & loss on the basis of straight line method:

Depreciation/year = (400,000 – 25,000)/5 = 75,000 (Straight line method)

As, machine was sold after four years but its useful life was estimated for five years, when we calculate
depreciation of the asset under straight line method, we will divide its WDV over five years, not on four
years.

Particulars                                               Depreciation (Rs)         Written Down Value
                                                                                    (Rs.)
Depreciable cost                                                                    375,000
Dep. Of the 1st year                                      (75,000)                  300,000
Dep. Of the 2nd year                                      (75,000)                  225,000
Dep. Of the 3rd year                                      (75,000)                  150,000
Dep. Of the 4th year                                      (75,000)                  75,000


Book value after four years                                Rs. 75,000
Sale price                                                 Rs. 40,000
Profit/(loss) on sale                                      Rs. (35,000) i-e.(40,000 – 75,000)


                           Copyright© Virtual University of Pakistan                                     88
Financial Statement Analysis-FIN621                                                              VU

Calculation of depreciation and profit & loss on the basis of reducing balance method:

Depreciation rate = 40%

             Particulars                      Depreciation    Accumulated      Written
                                              (Rs)            Depreciation     Down
                                                              (Rs.)            Value (Rs.)
             Depreciable cost                                                  400,000
             Dep. Of the 1st year
             400,000 x 40%                    160,000         160,000          240,000
             Dep. Of the 2nd year
             240,000 x 40%                    96,000          256,000          144,000
             Dep. Of the 3rd year
             144,000 x 40%                    57,600          313,600          86,400
             Dep. Of the 4th year
             86,400 x 40%                     34,560          348,160          51,840


Book value after four years                             Rs. 51,840
Sale price                                              Rs. 40,000
Profit/ (loss) on sale                                  Rs. (11,840) i-e. (40,000 – 51,840)

Illustration # 2

Following information of machinery account is available in Year 2004:
    • Machine # 1 is purchased on September 1, 2000 for Rs. 100,000
    • Machine # 2 is purchased on January 31, 2002 for Rs. 200,000
    • Machine # 3 is purchased on July 1, 2003 for Rs. 50,000
    • Machine # 1 is disposed on March 31, 2004
Depreciation is charged @ 25% reducing balance method. Financial year is closed on June 30 every
year.

Show the calculation of depreciation on machinery for four years using the following policies:
    • Depreciation is charged on the basis of use
    • Full depreciation is charged in the year of purchase and no depreciation is charged in the year
        of disposal.
Solution

Depreciation on the basis of use


Date            Purchase      Depreciation     Accumulated       Total        Written     Total
                of            (Rs.)            depreciation      Accum.       Down Value Written
                machine                        (Rs.)             Dep.         (Rs.)       Down
                (Rs.)                                                                     Value
                                                                                          (Rs.)
01-09-2000      100,000       Machine # 1      Machine # 1       20,833       Machine # 1 79,167
                              100,000 x 25%    20,833                         79,167
                              x10/12=20,833
2001-2002                     Machine # 1      Machine # 1       61,458       Machine # 1     238,542
                              79,167x25%       40,625                         59,375
                              = 19,792
31-01-2002      200,000       Machine # 2      Machine # 2                    Machine # 2
                            Copyright© Virtual University of Pakistan                              89
Financial Statement Analysis-FIN621                                                       VU

                          200,000x25%x5    20,833                      179,167
                          /12=20,833

2002-2003                 Machine # 1      Machine # 1      121,094    Machine # 1    178,906
                          59,375x25%       55,469                      44,531
                          = 14,844
                          Machine # 2      Machine # 2                 Machine # 2
                          179,167x25%      65,625                      134,375
                          =44,792
2003-2004                 Machine # 1      Machine # 1      175,538    Machine # 1    138,281
                          44,531x25%x      63,819                      (36,181)
                          9/12= 8,350                                   (sold)
                          Machine # 2      Machine # 2                 Machine # 2
                          134,375x25%      99,219                      100,781
                          = 33,594
01-07-2003    50,000      Machine # 3      Machine # 3                 Machine # 3
                          50,000x25%       12,500                      37,500
                          = 12,500


Figure in blue color is the written down value of machine # 1, which is disposed of by the management.


                        Copyright© Virtual University of Pakistan                          90
Financial Statement Analysis-FIN621                                                                   VU


Full year depreciation in the year of purchase and no depreciation in the year of sale:

Date           Purchase      Depreciation        Accumulated        Total        Written     Total
               of            (Rs.)               depreciation       Accum.       Down Value Written
               machine                           (Rs.)              Dep.         (Rs.)       Down
               (Rs.)                                                                         Value
                                                                                             (Rs.)
01-09-2000     100,000       Machine # 1         Machine # 1        25,000       Machine # 1 75,000
                             100,000 x 25%       25,000                          75,000
                             =25,000
2001-2002                    Machine # 1         Machine # 1        93,750       Machine # 1      206,250
                             75,000x25%          43,750                          56,250
                             = 18,750
31-01-2002     200,000       Machine # 2         Machine # 2                     Machine # 2
                             200,000x25%         50,000                          150,000
                             =50,000

2002-2003                    Machine # 1         Machine # 1        145,313      Machine # 1      154,687
                             56,250x25%          57,813                          42,187
                             = 14,063
                             Machine # 2         Machine # 2                     Machine # 2
                             150,000x25%         87,500                          112,500
                             =37,500
2003-2004                    Machine # 1         Machine # 1        185,935      Machine # 1      121,875
                             0                   57,813                          42,187
                             Machine sold        (sold)                          (sold)
                             Machine # 2         Machine # 2                     Machine # 2
                             112,500x25%         115,625                         84,375
                             = 28,125
01-07-2003     50,000        Machine # 3         Machine # 3                     Machine # 3
                             50,000x25%          12,500                          37,500
                             = 12,500

If an asset is not completed at that time when balance sheet is prepared, all costs incurred on that asset
up to the balance sheet date are transferred to an account called Capital Work in Progress Account.
This account is shown separately in the balance sheet below the fixed asset. Capital work in progress
account contains all expenses incurred on the asset until it is converted into working condition. All these
expenses will become part of the cost of that asset. When any expense is incurred or paid, it is included
in the Capital Work in Progress Account through the following entry:

        Debit:                           Work in Progress Account
        Credit:                          Cash/Bank/Payable Account

When an asset is completed and it is ready to work, all costs will transfer to the relevant asset account
through the following entry:

        Debit:                           Relevant asset account
        Credit:                          Capital work in progress account

Presentation

It is already mentioned that Work in Progress Account is shown separately in the balance sheet below
the fixed asset. i-e.
                           Copyright© Virtual University of Pakistan                                    91
Financial Statement Analysis-FIN621                                                             VU


                     Name of the Entity
                     Balance Sheet
                     As At……….
                     Particulars                            Amount     Amount Rs.
                                                            Rs.
                     Assets
                     Fixed Assets                                      xyz
                     Capital Work in Progress                          xyz
                     Other Long Term Assets                            xyz
                     Current Assets
                     Total                                             Xyz
                     Liabilities
                     Capital                                xyz
                     Profit                                 xyz        Xyz

                     Long Term Liabilities                             Xyz
                     Current Liabilities
                     Total                                             Xyz


Consider the solved illustration in the previous lecture:

Depreciation on the basis of use
Date          Purchase     Depreciation           Accumulated        Total     Written     Total
              of            (Rs.)                 depreciation       Accum.    Down Value Written
              machine                             (Rs.)              Dep.      (Rs.)       Down
              (Rs.)                                                                        Value
                                                                                           (Rs.)
01-09-2000      100,000       Machine # 1         Machine # 1        20,833    Machine # 1 79,167
                              100,000 x 25%       20,833                       79,167
                              x10/12=20,833
2001-2002                     Machine # 1         Machine # 1        61,458    Machine # 1   238,542
                              79,167x25%          40,625                       59,375
                              = 19,792
31-01-2002      200,000       Machine # 2         Machine # 2                  Machine # 2
                              200,000x25%x5       20,833                       179,167
                              /12=20,833

2002-2003                     Machine # 1         Machine # 1        121,094   Machine # 1   178,906
                              59,375x25%          55,469                       44,531
                              = 14,844
                              Machine # 2         Machine # 2                  Machine # 2
                              179,167x25%         65,625                       134,375
                              =44,792
2003-2004                     Machine # 1         Machine # 1        175,538   Machine # 1   138,281
                              44,531x25%x         63,819                       (36,181)
                              9/12= 8,350                                       (sold)
                              Machine # 2         Machine # 2                  Machine # 2
                              134,375x25%         99,219                       100,781
                              = 33,594
01-07-2003      50,000        Machine # 3         Machine # 3                  Machine # 3
                             Copyright© Virtual University of Pakistan                            92
Financial Statement Analysis-FIN621                                                 VU

                          50,000x25%         12,500                       37,500
                          = 12,500

Presentation in Balance Sheet

             Year           Cost of Machinery   Accumulated          Written Down
                                                Depreciation         Value
             2000-2001      100,000             20,833               79,167
             2001-2002      300,000             61,458               238,542
             2002-2003      300,000             121,094              178,906

Written down Value of the year 2003-2004

       Opening Written Down Value:                             178,906
       Add: Cost of machine purchased:                                    50,000
       Less: Depreciation of Machine # 1 in 2003-2004:                    (8,350)
       Less: Depreciation of other assets:                     (46,094)
       Less: Written Down Value of machine disposed:           (36,181)

       Closing Written Down Value:                             138,281


                         Copyright© Virtual University of Pakistan                  93
Financial Statement Analysis-FIN621                                                            VU

Full year depreciation in the year of purchase and no depreciation in the year of sale:

Date          Purchase     Depreciation       Accumulated        Total        Written     Total
              of           (Rs.)              depreciation       Accum.       Down Value Written
              machine                         (Rs.)              Dep.         (Rs.)       Down
              (Rs.)                                                                       Value
                                                                                          (Rs.)
01-09-2000    100,000      Machine # 1        Machine # 1        25,000       Machine # 1 75,000
                           100,000 x 25%      25,000                          75,000
                           =25,000
2001-2002                  Machine # 1        Machine # 1        93,750       Machine # 1   206,250
                           75,000x25%         43,750                          56,250
                           = 18,750
31-01-2002    200,000      Machine # 2        Machine # 2                     Machine # 2
                           200,000x25%        50,000                          150,000
                           =50,000

2002-2003                  Machine # 1        Machine # 1        145,313      Machine # 1   154,687
                           56,250x25%         57,813                          42,187
                           = 14,063
                           Machine # 2        Machine # 2                     Machine # 2
                           150,000x25%        87,500                          112,500
                           =37,500
2003-2004                  Machine # 1        Machine # 1        185,935      Machine # 1   121,875
                           0                  57,813                          42,187
                           Machine sold       (sold)                          (sold)
                           Machine # 2        Machine # 2                     Machine # 2
                           112,500x25%        115,625                         84,375
                           = 28,125
01-07-2003    50,000       Machine # 3        Machine # 3                     Machine # 3
                           50,000x25%         12,500                          37,500
                           = 12,500

Presentation in the Balance Sheet

              Year           Cost of Machinery    Accumulated             Written Down
                                                  Depreciation            Value
              2000-2001     100,000               25,000                  75,000
              2001-2002     300,000               93,750                  206,250
              2002-2003     300,000               145,313                 154,687

Written down Value of the year 2003-2004

       Opening Written Down Value:                            Rs. 154,687
       Add: Cost of machine purchased:                                Rs. 50,000
       Less: Depreciation of Machine # 1 in 2003-2004:                        0
       Less: Depreciation of other assets:                        (40,625)
       Less: Written Down Value of machine disposed:              (42,187)

       Closing Written Down Value:                            Rs. 121,875


                          Copyright© Virtual University of Pakistan                             94
Financial Statement Analysis-FIN621                                                            VU

Illustration # 2

Following information of machinery account is available in Year 2004:
    • Machine # 1 is purchased on     August 1, 2000 for Rs. 50,000
    • Machine # 2 is purchased on April 1, 2002 for Rs. 100,000
    • Machine # 3 is purchased on March 1, 2004 for Rs. 150,000
    • Machine # 1 is disposed on May 31, 2004
Depreciation is charged @ 20% reducing balance method. Financial year is closed on June 30 every
year.

Show the calculation of depreciation on machinery for four years using the following policies:
   • Depreciation is charged on the basis of use
   • Full depreciation is charged in the year of purchase and no depreciation is charged in the year
        of disposal,

Solution

Depreciation on the basis of use


Date           Purchase    Depreciation       Accumulated      Total       Written     Total
               of          (Rs.)              depreciation     Accum.      Down Value Written
               machine                        (Rs.)            Dep.        (Rs.)       Down
               (Rs.)                                                                   Value
                                                                                       (Rs.)
01-08-2000     50,000      Machine # 1        Machine # 1      9,167       Machine # 1 40,833
                           50,000 x 20%       9,167                        9,167
                           x11/12=9,167
2001-2002                  Machine # 1        Machine # 1      22,334      Machine # 1     127,666
                           40,833x20%         17,334                       32,666
                           = 8,167            Machine # 2
01-04-2002     100,000     Machine # 2        5,000                         Machine # 2
                           100,000x20%x3                                    95,000
                           /12=5,000

2002-2003                  Machine # 1        Machine # 1      47,867      Machine # 1     102,133
                           32,666x20%         23,867                       26,133
                           = 6,533
                           Machine # 2        Machine # 2                   Machine # 2
                           95,000x20%         24,000                        76,000
                           =19,000
2003-2004                  Machine # 1        Machine # 1      77,858      Machine # 1     200,800
                           26,133x20%x        28,658                       (21,342)
                           11/12= 4,791                                     (sold)
                           Machine # 2        Machine # 2                  Machine # 2
                           76,000x20%         39,200                       60,800
                           = 15,200
01-03-2004     150,000     Machine # 3        Machine # 3                   Machine # 3
                           150,000x20%x       10,000                        140,000
                           4/12= 10,000


                          Copyright© Virtual University of Pakistan                              95
Financial Statement Analysis-FIN621                                                            VU

Presentation in the Balance Sheet

              Year           Cost of Machinery    Accumulated             Written Down
                                                  Depreciation            Value
              2000-2001      50,000               9,167                   40,833
              2001-2002      150,000              22,334                  127,666
              2002-2003      150,000              47,867                  102,133

Written Down Value of the year 2003-2004

        Opening Written Down Value:                            Rs. 102,133
        Add: Cost of machine purchased:                                Rs. 150,000
        Less: Depreciation of Machine # 1 in 2003-2004:                     (4,791)
        Less: Depreciation of other assets:                        (25,200)
        Less: Written Down Value of machine disposed:              (21,342)

        Closing Written Down Value:                            Rs. 200,800

Full year depreciation in the year of purchase and no depreciation in the year of sale:

Date           Purchase     Depreciation       Accumulated       Total        Written     Total
               of           (Rs.)              depreciation      Accum.       Down Value Written
               machine                         (Rs.)             Dep.         (Rs.)       Down
               (Rs.)                                                                      Value
                                                                                          (Rs.)
01-08-2000     50,000       Machine # 1        Machine # 1       10,000       Machine # 1 40,000
                            50,000 x 20%       10,000                         40,000
                            =10,000
2001-2002                   Machine # 1        Machine # 1       38,000       Machine # 1   112,000
                            40,000x20%         18,000                         32,000
                            = 8,000
01-04-2002     100,000      Machine # 2        Machine # 2                    Machine # 2
                            100,000x20%        20,000                         80,000
                            =20,000

2002-2003                   Machine # 1        Machine # 1       60,400       Machine # 1   89,600
                            32,000x20%         24,400                         25,600
                            = 6,400
                            Machine # 2        Machine # 2                    Machine # 2
                            80,000x20%         36,000                         64,000
                            =16,000
2003-2004                   Machine # 1        Machine # 1       103,200      Machine # 1   171,200
                            0                  24,400                         (25,600)
                            Machine sold       (sold)                         (sold)
                            Machine # 2        Machine # 2                    Machine # 2
                            64,000x20%         48,800                         51,200
                            = 12,800
01-03-2004     150,000      Machine # 3        Machine # 3                    Machine # 3
                            150,000x20%        30,000                         120,000
                            = 30,000


                          Copyright© Virtual University of Pakistan                             96
Financial Statement Analysis-FIN621                                                                     VU

Presentation in the Balance Sheet

               Year            Cost of Machinery      Accumulated           Written Down
                                                      Depreciation          Value
               2000-2001       50,000                 10,000                40,000
               2001-2002       150,000                38,000                112,000
               2002-2003       150,000                60,400                89,600

Written Down Value of the year 2003-2004

        Opening Written Down Value:                                 Rs. 89,600
        Add: Cost of machine purchased:                                     Rs. 150,000
        Less: Depreciation of Machine # 1 in 2003-2004:                           0
        Less: Depreciation of other assets:                             (42,800)
        Less: Written Down Value of machine disposed:                   (25,600)

        Closing Written Down Value:                                 Rs. 171,200

Revaluation of Fixed Assets

Fixed assets are purchased to be used for longer period. In the subsequent years, the value of asset could
be higher or lower than its present book value due to inflationary condition of the economy. Assets are
valued at Historical Cost in the books of accounts. Historical Cost is the original cost of the asset at
which it was purchased plus additional costs incurred on the asset to bring it in working condition.
Sometimes, the management of the business, if it thinks fit, revalues the asset to present it on current
market value. Once the asset is revalued to its market value, then its value has to be constantly
monitored to reflect the changes in the market value.
If an asset is revalued at higher cost than its original cost, the excess amount will be treated as profit on
revaluation of fixed assets and it is credited to Revaluation Reserve Account.
On the other hand, if an asset is revalued at lower cost than its original cost, the balance amount will be
treated as loss on revaluation of fixed assets and it is shown in the profit & loss account of that year in
which asset was revalued.


                            Copyright© Virtual University of Pakistan                                     97
Financial Statement Analysis-FIN621                                                                    VU

                                                                                                 Lesson-22
                            NOTES TO FINANCIAL STATEMENTS
                                               (Continued)


Depreciation expenses for year would be: =cost-(estimated) Residual value = 17,000-2000 = 3000

                                                                         *(Estimated years of useful life-5)

        ii)     Accelerated-Depreciation method: In this method higher depreciation rate is charged
                in early years and lower rate in later years. Since new plants are most efficient in early
                years, matching principle demands that higher depreciation may be charged in earlier
                years.

                Depreciation = Book Value x Accelerated Dep. Rate

                Example: Taking the above case of plant asset acquired for Rs.17, 000

Year                Depreciation                          Accumulated             Book Value
                                                          Depreciation
1                   17,000 X 40%              6800        6800                    10200
2.                  10,200 X 40%              4080        10880                   6120
3.                  6,120 X 40%               2448        13328                   3672
4.                  3,672 X 40%               1469        14797                   2203
5.                  2,203 X 40%                881        15000                   2000
                                (reduced to 203)

Note that sine total depreciation in five years is Rs.15, 000 (Rs.17, 000 – 2,000), the depreciation for the
last year is reduced from 881 to 203 to bring the total depreciation amount in 5 years to Rs.17, 000.

                Principles of disclosure and Consistency of Accounting Methods. This is the basic
concept underlying reliable financial statements, i.e. consistently following the Inventory valuation/
pricing and Depreciation calculation Methods. Disclosure of the Accounting methods used, in Balance
Sheet or in the Notes is also an essential requirement of Disclosure Principle. If however, Accounting
Method (s) are changed disclosure must be made of reasons for such change, and of the effect of change
upon the company's net income.

Annual Report Generated By Business

              Annual Report is part of Financial Reporting Process which contains Financial
Statements, Notes to financial statements, Auditors’ Report, Five-year summary of key financial and
non-financial data, and Management’s discussion and analysis of operations (MD&A).

Auditor’s Report

               Audit of financial statements is independent of the business issuing these. Financial
Statements preparation is Management’s responsibility, whereas expressing opinion as to their fairness
is the Auditor’s responsibility, Audit Report is issued along with financial statements to persons outside
the business. It provides assurance to outside users about the completeness and reliability (not
necessarily accuracy) of Financial Statements.

                 Auditor is hired by the company being audited. Usually a Management letter is also
issued by Auditors to Company’s management, recommending steps for improving company’s internal
control structures.
                           Copyright© Virtual University of Pakistan                                     98
Financial Statement Analysis-FIN621                                                                       VU


               Fairness’ in the context of Auditor’s Report means that financial statements           are not
misleading. Audit is conducted according to Generally Accepted Auditing Standards. During Audit, the
Auditors obtain reasonable assurance that financial statements are free of “material” misstatements.
Audit is conducted by examining, on a test basis, evidence supporting the amounts and disclosures in
the financial statements. It assesses the accounting principles used and significant estimates made by
management. It must also be noted that Audit‘s purpose is to determine fairness of financial statements
and not to detect frauds, as such. In the context of materiality, it is to be noted that an item is material if
knowledge of this might reasonably be expected to influence user’s decisions. Also to be noted is the
fact an auditor can also make errors like a physician does in diagnosis.

End product of every audit is the auditor’s report. An audit involves collection of audit evidence about
the truth and fairness of financial statements or other proposition under review. By careful examination
of the evidence so called the auditor draws appropriate conclusions and forms his opinion. The auditor’s
report summarizes results of the work conducted by the auditor and formally communicates the
auditor’s opinion.

It is important to note that the auditor’s report simply expresses the auditor’s opinion on truth and
fairness of financial statements as absolutely correct. An auditor’s report is a formal statement that
includes the reporting auditor’s opinion formed after careful examination of books of accounts and
related documents. Where as, a certificate is written conformation of absolute accuracy of the facts
stated therein and does not involve any estimate or opinion.

Types of auditor’s opinion

An auditor’s opinion may be unqualified, qualified or adverse. In certain circumstances the auditor may
disclaim an opinion i.e states his inability to express an opinion.

Unqualified opinion

Opinion of an auditor is termed as unqualified when the auditor concludes that that the financial
statements give a true and fair view in accordance with the identified financial reporting framework.

There is no statuary definition of the words “true and fair”. However, true and fair has been taken to
mean the following: (I) free from prejudice or bias, (II) presentation of an objective picture, (III) in
accordance with generally accepted accounting principles, (IV) consistent and having clarity,(V) not
misleading and understandable by the reader of financial statements,. (V) presented fairly, in all
material respects.

Identified financial reporting framework means the set of statutes, rulers, and standards etc. That apply
to the preparation and presentation and presentation of such financial statements.

According to the companies ordinance 1984, in an unqualified audit report the auditor is required to
make some statutory affirmations without reservations, as prescribed in section 255(3).

In an unqualified opinion the auditor also impliedly undertakes that any changes in accounting
principles or in the method of their application, and the effects thereof, have been properly determined
and disclosed in the financial statements.

Modified opinion

An auditor may not be able to express an unqualified opinion. When either of the following
circumstances exists and, in the auditor’s judgment, the effect of which is or may be material to the
financial statements:-

                            Copyright© Virtual University of Pakistan                                       99
Financial Statement Analysis-FIN621                                                                    VU

(a) There is a limitation on the scope of the auditor’s work; or
(b) There is a disagreement with management regarding the acceptability of the accounting policies
selected, the method of their application or the adequacy of financial statement disclosures.

The circumstances described in (a) could lead to a qualified opinion or a disclaimer of opinion. The
circumstances described in (b) could lead to a qualified opinion or an adverse opinion.

(i) Qualified Opinion

Opinion of an auditor is termed as qualified opinion when the auditor concludes that an unqualified
opinion cannot be expressed but that the effect of any disagreement with management, or limitation on
scope is not so material and pervasive as to require and adverse opinion or a disclaimer of opinion. A
qualified opinion is expressed as being ‘except for’ the effects of the matter to which the qualification
relates.

(ii) Disclaimer of opinion

A disclaimer of opinion should be expressed when possible effect of a limitation on scope of audit is so
material and pervasive that the auditor has not been able to obtain sufficient appropriate audit evidence
an accordingly is unable to express an opinion on the financial statements


(iii) Adverse opinion.
An adverse opinion should be expressed when the effect of a disagreement is so material and pervasive
to the financial statements that the auditor concludes that a qualification of the report is not adequate to
disclose the misleading or incomplete nature of the financial statements.


                             Copyright© Virtual University of Pakistan                                 100
Financial Statement Analysis-FIN621                                                                  VU

                                                                                              Lesson-23
                       ANNUAL REPORT GENERATED BY BUSINESS

Auditor’s Report, Opinion/Certificate: There are four types of Audit certificates.

        i)       Unqualified: It states that Financial Statements present information in conformity with
                 GAAP.

        ii)      Qualified: It qualifies the Report with certain observations.

        iii)     Adverse: It states that financial statements have not been presented fairly in accordance
                 with GAAP.

        iv)      Disclaimer: Auditor expresses his inability to report on Financial Statements for various
                 reasons.

Statements of Audit Reports

              “Un-qualified Audit Certificate/Opinion”: We have examined the accounts/financial
statements of________ up to the year ended 30th June, _____, and other record based on these accounts
and we got all the information required by us. In our opinion the financial statements and the accounts
on which they are based have been prepared in conformity with generally accepted accounting
principles, and present a true and fair position of the affairs of _________________.

             “Qualified Audit Certificate/Opinion”: We have examined the accounts of _________
up to the year ended 30th June, _______ and other record based on these accounts and we got all the
information required by us. In our opinion the financial statements and the accounts on which they are
based have generally been prepared in conformity with the generally accepted accounting principles,
and these present a true and fair position of the affairs of _________ subject to the observations and
findings mentioned in the enclosed report.

               “Adverse Audit Certificate/Opinion”: We have examined the accounts of __________
up to the year ended 30th June, _____ and other record based on these accounts and we got all the
information required by us. In our opinion the financial statements and the accounts on which they are
based have not been prepared in conformity with generally accepted accounting principles, and these do
not present a true and fair position of the affairs of _________ because of the errors mentioned in the
enclosed report.

              Disclaimer of opinion: We are unable to issue an audit certificate on the accounts of
________ for the period _______, as we could not verify the financial statements and the accounts on
which they are based due to non-availability of the necessary information or because of our inability to
visit (Locations) or due to the non-cooperation by the auditee staff in providing the necessary records
(name the documents).


Another form of Audit Report is as follows:-

                   To the Stockholders and Board of Directors of MOOSA & CO.

              We have audited the accompanying balance sheet of Moosa & Co as of June 30, 20 ____,
and the related statements of income, retained earnings, and cash flow for the year then ended.

               We conducted our audit in accordance with generally accepted auditing standards.

                           Copyright© Virtual University of Pakistan                                 101
Financial Statement Analysis-FIN621                                                                 VU

             We believe that our audit provides a reasonable basis for our opinion.

              In our opinion, the financial statements referred to above present fairly, in all material
respects, the financial position of Moosa & Co as of June 30, 20______, and the results of its operations
and its cash flows for the year then ended in conformity with generally accepted accounting principles.

Peshawar                        Signature
September 29, 20____          Certified Chartered Accountant


                           Copyright© Virtual University of Pakistan                                102
Financial Statement Analysis-FIN621                                                                  VU

                                                                                               Lesson-24
                      ANNUAL REPORT GENERATED BY BUSINESS
                                              (Continued)

Five-Year Summary:

 This is also a very important part of Annual Report prepared by the management of a corporation. It
offers quick look at some overall trends, and it includes net sales or operating revenues, income/loss
from continuing operations, total assets, long-term obligations and cash dividend per common share.

Management Discussion & Analyses (MD&A)

                 This last part of the Annual Report is also labeled as’ Financial Review’. It contains
information that cannot be found in the financial data e.g. internal/external sources of liquidity, any
material deficiencies in liquidity and suggested remedial measures, commitments for capital expenditure
and sources of funding, and anticipated changes in the mix and cost of financing resources.

              MD&A records events causing material changes in cost/revenue relationships e.g. future
price increase. It also gives breakdown of sales increases in price and volume components, and also
gives explanation about why changes have occurred in profitability and liquidity.

Quality of Financial Reporting

             Ideally, financial statements should reflect an accurate picture of the financial position
and performance of a business, and should convey information useful to assess the past and predict the
future. However discretion/potential exists within GAAP to “manipulate/window-dress” the financial
statements.

               Opportunities for management to affect the quality of financial statements are available in
the form of Accounting Policies, Estimates i.e. choices, (of Accounting Policies) and changes (of
Accounting Policies and Estimates). There is also opportunity to Management for timing of Revenues
and Expenses. Since Matching process requires matching revenues and expenses of a particular
accounting period, it gives the management, discretion regarding timing of expenses. For example,
management may postpone expenditures for many items like Advertisement/marketing,
Repairs/Maintenance, and Research & Development and Capital expansion; in order to             “window-
dress” its financial statements.

Limitations of Financial Statements.

               Financial Statements assume constant real-value of money. It should be noted that net
income is not absolutely accurate and precise, since assumptions, estimations & approximations are
involved as regards estimated useful life of plant assets, their residual value etc. Events not measurable
objectively are not reflected in Income Statement. Also the Financial Statements give no “valuation” as
such of the enterprise because assets are valued on “going-concern assumption”, and the fixed assets are
valued at Book Value which may be more or less than realizable market value.

                Financial Statements have the limitation that assessment of future profitability is not
possible by reading these. Future profitability depends on a number of factors e.g. quality of products,
activities of competitors, general economic situation etc., a picture of which cannot emerge from
financial statements.

              Financial Statements thus give limited picture of an enterprise in monetary terms, without
taking into account outside non-monetary factors.


                           Copyright© Virtual University of Pakistan                                 103
Financial Statement Analysis-FIN621                                                                  VU

              One other limitation of Financial Statements is that information is not available in
financial statements about employees’ relations with management, morale/efficiency of employees,
reputation/public perception of the enterprise, effectiveness of management team and potential exposure
to regulatory changes. These impact operational results but are difficult to quantify from Financial
Statements.

Different accounting practices can distort comparisons. As noted earlier, inventory valuation and
depreciation methods can affect financial statements and thus distort comparisons among firms. Also, if
one firm leases a substantial amount of its productive equipment, its assets may appear low relative to
sales because leased assets often do not appear on the balance sheet, at the same time, the liability
associated with the lease obligation may not be shown as a debt. Therefore leasing can artificially
improve both the turnover and the debt ratios. However accounting professional has taken steps to
reduce this problem.


Financial accounting deals with the preparation of financial statements, namely, Income statement,
Statement of changes in owner's equity, Balance sheet and Statement of Cash flows.

These financial statements enable users of accounting information to make informed decisions about a
company's performance. In order to make decisions, the information presented must be

Relevant (useful for the purpose of decision making)

Reliable (verifiable)

However, some people argue that due to the rules that accountants use, financial statements are not as
useful as they could be.

Limitations of Financial Statements.

Limitation # 1

Assets on the balance sheet are always shown at the original purchase price (historical cost) even
though the current value may be different.

Example: XYZ Company started their business five years ago and at that time; they purchased some
land for Rs. 200,000. Today, the same land is worth Rs. 500,000. However, the land will be shown on
the balance sheet at Rs. 200,000.

Implication: The value of the land is not realistic.

Limitation # 2

Some figures on the financial statements are based on subjective estimates and assumptions.
Management could possibly change net income by changing these estimates.

Depreciation is one example where estimates and assumptions are used.

Definition of Depreciation

Depreciation is the loss in value of assets as the assets are used to generate revenue. Depreciation is an
expense.

                             Copyright© Virtual University of Pakistan                               104
Financial Statement Analysis-FIN621                                                                   VU

Example: XYZ Company is in the business of manufacturing 'ball-point' pens. It needs a special
machine to make these pens. This machine is used continuously for 20 hours everyday.

The cost of this machine is Rs. 100,000. It is expected to last for 5 years after which it needs to be
replaced.

The machine will lose value each year as it is used to produce pens. These pens are sold to generate
revenue for the company.

Therefore, this loss in value or depreciation is considered to be an expense of the business.

Different depreciation methods

Calculation of depreciation is an estimate. There are many methods used to calculate depreciation.

Two most common examples are:

Straight line method

Declining/Reducing balance method

Straight line depreciation method.

In this method, the "amount of depreciation" (loss in value) is the same every year.

The reasoning behind this is that the firm gets equal benefits over the useful life of the asset.

How to calculate?

Depreciation=Original cost - salvage value
              Number of years of useful life

Salvage value is the amount of money that you would receive if you sold the asset at the end of its
useful life. The useful life is the length of time that you expect to use the asset.

Both the salvage value and the number of years of useful life are estimates.

Example:

A firm has purchased a machine for Rs.100, 000. It is expected to last for 5 years. At the end of its life,
it has zero salvage value.

Rs.100, 000 – Rs.0

Depreciation = --------------- = Rs. 20,000

Therefore, each year the firm shows depreciation ( loss in value) of this machine as Rs. 20,000 .

Implications:

1. Different depreciation methods and estimates will give different net income figures.

                            Copyright© Virtual University of Pakistan                                 105
Financial Statement Analysis-FIN621                                                                 VU

2. The value of assets shown in the balance sheet will also differ depending on the depreciation
method and the estimates used.

Limitation # 3

There are certain other items which are not reported in the balance sheet even though the firm may
consider them to be of considerable value.

Examples

Image/reputation of the firm

The value of its human resources (people)

                                                  Summary

Financial statements have always been prepared with the emphasis of being

Relevant & reliable to the various users of accounting information.

In spite of trying to be relevant and reliable, there are certain limitations:

1. Historical accounting methods have a tendency to undervalue the assets of the firm.

2. Different depreciation methods and estimates will report different net income figures in the income
statement and different value of assets in the balance sheet.

3. There are certain assets which are not reported in the balance sheet such as the image / reputation of
the firm or the value of a firm's human resources causing the value of the company to appear to be
lower than it actually is.


                            Copyright© Virtual University of Pakistan                               106
Financial Statement Analysis-FIN621                                                                    VU

                                                                                                Lesson-25

                                       TYPES OF BUSINESS

              There are usually three types of Business: service enterprise, merchandise (sale and
purchase) enterprise, and manufacturing enterprises.

TYPES OF BUSINESS ORGANIZATIONS:

              Corresponding to three types of business, there are three types of business organizations
viz Sole Proprietorship, Partnership firm and Public Limited Companies or Corporations.

                Different combinations of businesses and business organizations can occur. For
example, a sole proprietor can have a manufacturing business or a big corporation can indulge in service
enterprise.

                 GAAP apply to financial statements of all the three types of business and business
organizations.

Sole Proprietorship:

It is owned by one person (often acting as manager as well). Examples would be small retail stores,
farms, service business and professional practices (law, medicine etc). Accounts of business are
however separate from personal accounts of the owner. Legally, the business and owner are not
separate. It is unincorporated business in which there is personal liability of owner for debts of business.
Creditors look to solvency of owner, rather than financial position of business.
Owner is personally liable for all business obligations. If the organization is sued , the proprietor as an
individual is sued and has unlimited liability, which means that much of his or her personal property, as
well as the assets of the business, may be seized to settle claims. Another problem with a sole
proprietorship is the difficulty in raising capital. Because life and success of the business is so
dependent on a single individual, a sole proprietorship may not be as attractive to lenders as another
form of organization. More over the proprietorship has certain tax disadvantages.. In addition to these
drawbacks the proprietorship form makes the transfer of ownership more difficult than does the
corporate form. No portion of the enterprise can be transferred to members of the family during the
proprietor’s lifetime. For these reasons, this form of organization does not afford the flexibility that
other forms do.

Partnership:

It is unincorporated business owned by two or more persons. Owners voluntarily act as partners.
Accounts of firm are separate from personal accounts of owners/partners, which mean there is personal
liability of owners for debts of firm. Partnership dissolves on the death or retirements of any of its
members/partners.

Disadvantages of a Partnership Firm

The Local Law restricts the number of partners in a partnership firm to twenty. If the firm needs more
capital for its business, the partners may not be in a position to invest more money in the business.

Secondly, if the business of the partnership firm is very large and twenty persons can not manage it,
they cannot admit new partners in the business. However, there is one exception. The partnership firm
of professionals can have more than twenty partners.

At this point, need for forming a COMPANY arises.
                           Copyright© Virtual University of Pakistan                                   107
Financial Statement Analysis-FIN621                                                                     VU


Public Limited Companies/Corporations:

Ownership of public limited companies vests in individuals, Labour unions, banks, universities and
other organizations like mutual funds etc. Ownership is through shareholding by shareholders or
stockholders.

                 A corporation is a legal entity having existence separate and distinct from that of its
owners. It is an artificial and legal person which can be sued and be sued.

              Assets of the company or corporation belong to the company itself, not to owners.
Creditors of the company thus have a claim against assets of the company, not against the personal
property of stockholders. In other words, there is “limited” liability of shareholders; limited to the extent
of their shareholding. This is because stockholders own the company but not its assets, which belong to
the company itself. It is the corporation which is responsible for its debts, being a legal person.

Advantages Of A Limited Company

A Limited company enjoys the following benefits:
   • It can have more than twenty partners, so problem of extra capital is reduced to minimum.
   • The liabilities of the members of a company is limited to the extent of capital invested by them
       in the company
   • There are certain tax benefits to the company, which a partnership firm can not enjoy.
   • In Pakistan, affairs of limited companies are controlled by COMPANIES ORDINANCE issued
       in 1984.
   • The formation of a company and other matters related to companies are governed by
       SECURITIES AND EXCHANGE COMMISSION OF PAKISTAN (SECP).

Types of Companies

There are two major types of the companies:
   • Private limited companies
   • Public limited companies

Private Limited Companies

Following are the main characteristics of private limited companies:
    • Number of members in a private limited company ranges from two to fifty.
    • Words and parentheses “(Private) Limited” are added at the end of the name of a private limited
       company. Example: ABC (Private) Limited.
    • Private limited company can not offer its shares to general public at large.
    • In case a shareholder decides to sell his shares, his shares are first offered to existing
       shareholders. If all existing shareholders decide not to purchase these shares, only then, an
       outsider can buy them.
    • The shareholders of the private limited company elect two members of the company as
       Directors.
    • These directors form a board of directors to run the affairs of the company.
    • The head of board of directors is called “chief executive”.

Public Limited Company

Following are the main characteristics of public limited companies:
    • Minimum number of members in a public limited company is seven

                            Copyright© Virtual University of Pakistan                                   108
Financial Statement Analysis-FIN621                                                           VU

   •   There is no restriction on the maximum number of members in a public limited company.
   •   Word “Limited” is added at the end of the name of a public limited company. Example: ABC
       Limited.
   •   Public limited company can offer its shares to general public at large.
   •   The shareholders of the public limited company elect seven members of the company as
       Directors.
   •   These directors form a board of directors to run the affairs of the company.
   •   The head of board of directors is called “chief executive”.

There are two types of public limited company:
   • Listed Company
   • Non Listed Company

Listed Company

Listed company is that company whose shares are quoted on stock exchange. i.e. whose shares are
traded in stock exchange. It is also called quoted company.

Non Listed Company

Non listed company is that company whose shares are not quoted on stock exchange. i.e. whose shares
are not traded in stock exchange.


                          Copyright© Virtual University of Pakistan                            109
Financial Statement Analysis-FIN621                                                                    VU

                                                                                                Lesson-26
                           TYPES OF BUSINESS ORGANIZATIONS
                                               (Continued)

              There are also certain closely held companies which are small businesses, restricting
ownership to a limited group of stockholders (private). They are not publicly owned.

                A public limited company has perpetual existence and continuous life (through issue of
transferable shares). Unlike partnerships, corporations do not dissolve at the death of any of its
directors/shareholders.

              Board of directors is elected by stockholders of the Corporation. Managers of business are
hired and appointed by the Board. Individual stockholders can be hired for management of the business.
Ownership and management of public limited companies are however separate. There can be outside
directors as well.

               Costs of incorporating a business as public limited company are charged to an assets
account called organization or incorporation costs. These appear in balance sheets under the caption
“other Assets”. These are written-off over a five year period.

Incorporation of business

               Approval of competent authority and listing on Stock Exchange is the first step. Approval
of Corporate Law Authority under Companies Ordinance, 1984 for issue of Prospectus is also a pre-
requisite to incorporation of a business as public limited company. Clearance of Prospectus by Stock
Exchange is the next step. However, approval and clearance is no guarantee of correctness of Prospectus
contents. Filing of Prospectus and related documents with Registrar of Companies follows. Prospectus
gives interalia, objectives and operations of the entity, capital structure, Basis of Allotment of Shares
etc.

Example of Capital Structure:

               Authorized share capital Rs.300 m divided into 30 m shares of Rs.10 each. Capital
initially proposed to be raised: initial equity capital Rs.200 m. Initial subscription by Sponsors and First
Subscribers: Rs.150 m divided into 15 m share of Rs.10 each. Capital offered to public: Rs.50 m
divided into 2 m shares of Rs.10 each.

Formation of a Company

In case of private limited company, any two members and in case of public limited company, any seven
members can subscribe their names in Memorandum and Articles of association along with other
requirements of the Companies Ordinance 1984; can apply to Security and Exchange Commission for
registration of the company.

Memorandum of association:

Memorandum of association contains the following clauses:
  • Name of the company with the word “Limited” as the last word of the name, in case of public
      limited and the parenthesis and the word “(Private Limited)” as the last word of the name, in
      case of private limited company.
  • Place of registered office of the company.
  • Objective of the company.
  • Amount of share capital with which company proposes to be registered and division in to
      number of shares.
                           Copyright© Virtual University of Pakistan                                   110
Financial Statement Analysis-FIN621                                                                   VU

    •   No subscriber of the company shall take less than one share.
    •   Each subscriber of the memorandum shall write opposite to his name, the number of shares held
        by him.

Articles Of Association

    •   Article of association is a document that contains all the policies and other matters which are
        necessary to run the business of the company.
    •   This is also signed by all the members of the company.

When Security and Exchange Commission is satisfied that all the requirements of the Companies
Ordinance have been complied with, it issued certificate of incorporation to the company. This
certificate is evidence that a separate legal entity has come in to existence.

Certificate of Incorporation/Registration

When Security and Exchange Commission of Pakistan receives application for registration of a
company, the registrar of SECP makes investigation in respect of compliance with legal requirements.
When he is satisfied that all legal requirements are complied with. He issues a Certificate of
Incorporation/registration to the company. This certificate is evidence that a separate legal entity has
formed. The company, after incorporation/Registration has the right to sue and to be sued in its own
name.

 Two types of stock/shareholders:

The two types of stockholders or shareholders are common and preferred shareholders.

              Common stockholders have right to vote in election of directors and in other important
actions e.g. mergers, acquisitions, selection of auditors, raising capital etc. They have right to receive
dividends if authorized or declared by Board of Directors. No dividend is given on profit on sale of
assets, or if the business goes into loss. No interest is given on unpaid dividend. Dividends are declared
in General Meeting, but these should not exceed the amount recommended by Board of Directors.

                 Common shareholders have right over assets if company is liquidated, only after
creditors and preferred shareholders are paid in full. They are therefore called residual claimants.
Preferred shares have priority or preference over common stock in receiving dividends and in the event
of liquidation. Dividend is fixed in this case, and does not increase with increase in earnings. Conditions
of declaration of dividends by Board of Directors, however exists in this case also. Preferred
stockholders have no voting rights. Preferred shares are callable or redeemable at higher price by the
company issuing these. Thus these have characteristics of both debt and equity’s, and are sometimes
referred to as Hybrid Securities.


                           Copyright© Virtual University of Pakistan                                  111
Financial Statement Analysis-FIN621                                                                   VU

                                                                                                Lesson-27
                           TYPES OF BUSINESS ORGANIZATIONS
                                              (Continued)
Authorized Share Capital

The maximum amount with which a company gets registration/incorporation is called authorized share
capital of that company.
This capital can be increased with the prior approval of security and exchange commission. This capital
is further divided in to smaller denominations called shares. Each share usually has a face value equal to
Rs. 10. According to Companies Ordinance, this face value can be increased but can not be decreased.
The value of share written on its face is called face value or par value or nominal value

Issued Share Capital

When a company issues its shares to general public at large, the amount raised by the company with
such an issue is called issued share capital. This is also called Paid up Share Capital.( total amount
received by the company). Accounting entry is recorded for issued share capital; no such entry is
recorded for authorized share capital.

Preliminary Expenses

All expenses incurred up to the stage of incorporation of the company are called Preliminary Expenses.
All these expenses are incurred by subscribers of the company.

 The maximum amount with which a company gets registration/incorporation is called authorized share
capital of that company. This capital can be increased with the prior approval of security and exchange
commission. This capital is further divided in to smaller denominations called shares. Each share
usually has a face value equal to Rs. 10. According to Companies Ordinance, this face value can be
increased but can not be decreased. The value of share written on its face is called face value.
Shares are issued for cash as well as for any asset. For example, if any member of the company sell
his/her land to the company. In return, company issue him/her fully paid shares instead of paying cash.
Those shares are also part of paid up capital because company has received the benefit of that amount.

Share Certificate

Share Certificate is the evidence of ownership of the number of shares held by a member of the
company. When a company issue more than one share to its member, it does not issue that number of
shares to him/her. Instead, it issues a certificate under the stamp of the company that a particular number
of shares are issued to members of the company.

Shares Issued At Premium

When a company has a good reputation and earns huge profits, the demand of its shares increases in the
market. In that case, the company is allowed by the Companies Ordinance 1984, to issue shares at a
higher price than their face value. Such an issue is called Shares Issued at Premium. The amount
received in excess of the face value of the shares is transferred to an account called “Share Premium
Account”. This account is used to:
    • Write off Preliminary Expenses of the company.
    • Write off the balance amount, in issuing shares on discount.
    • Issue fully paid Bonus Shares.


                           Copyright© Virtual University of Pakistan                                  112
Financial Statement Analysis-FIN621                                                                 VU


Shares Issued On Discount

When a company is not making huge profits, rather it is sustaining loss, the demand of its shares
decreases in the market. If the company needs extra funds, then it is allowed by the Companies
Ordinance 1984, to issue shares at lesser price than their face value. Such an issue is called Shares
Issued on discount.

The difference of face value and the amount received is met by share premium account, if available. If
there is no share premium account available, this difference is shown in the profit and loss account of
that period, in which shares are issued as loss on issue of shares at discount.

Capital stock: This signifies ownership of a corporation in the form of shares issued or sold for cash
and sometimes in exchange of assets like land, buildings etc., and services (e.g. legal), using market
value of shares issued in exchange. It includes common and preferred stock. When only one type of
stock is issued, the words “common stock” is used. It is the amount invested by stockholders i.e. paid-
in-capital. It is also called “Outstanding Shares” i.e. shares in the hands of stockholders.

Stockholders’ equity
                                                                         Rs.
  Cumulative 8% preferred stock, convertible
  Rs.100 par value callable or redeemable
  at Rs.110, authorized 20,000 shares;
  Issued 10,000 shares.                                                  1,000,000

  Common stock Rs.10
  Par/stated value, authorized 100,000 shares,
  Issued and outstanding 50,000 shares.
                                                                            500,000
  Paid-in-capital                                                         1,500,000
  Plus additional paid-in-capital+ donated
  Capital/assets at market value + Retained
  Earning (or minus accumulated losses).

 Retained earning transferred to B/Sheet= Opening balance + Net Profit for the year – Dividends.

                Additional paid-in-capital: shows excess amount received, when stock is sold for more
than par value. Underwriters, (banks, investment companies etc) make profit by selling share at higher
prices. Retained earnings is an element of stockholders equity, does not indicate the form in which these
resources are currently held. These may have been invested in land, building, equipment or any other
assets, or might have been used in liquidating debts.

Balance Sheet as on June 30
Assets                                           Rs. _____
Current assets.                                  1,000,000
Fixed assets.                                    1,692,000
  Total assets.                                  2,692,000

Liabilities & Stockholders’ equity
Liabilities
Current.                                           112,000
12% long-term Notes payable                        200,000
  Outside liabilities.                             312,000
Paid-in-capital (from previous slide)            1,500,000

                           Copyright© Virtual University of Pakistan                                113
Financial Statement Analysis-FIN621                                                                 VU

Additional Paid-in-Capital, Common stock.          750,000
Retained earnings                                  130,000
Total Stockholders’ equity.                      2,380,000
Total Liabilities & Stockholder equity.          2,692,000


Dividend

Profit distributed to the share holders for their investment in the company is called Dividend. Dividend
is approved by the share holders in the annual general meeting at the recommendation of the directors.
Dividend is paid out of profits. If, in any year, company could not make any profit. No dividend will be
paid to share holders. Dividend is paid to registered share holders of the company. Registered share
holders are those members of the company, who are enlisted in the register of share holders of the
company.

Subscribers / Sponsors Of The Company

Subscribers / Sponsors are the persons who sign articles and memorandum of the company and
contribute in the initial share capital of the company.

Issuance Of Further Capital

Where a company wants to issue further capital (called raising the capital), shares are first offered to
current shareholders. The issuance of further capital to Present Shareholders is called Right Issue. This
issue is in proportion to current shares held by the shareholders. The shareholders can accept or reject
the offer. If shareholders refuse to accept these shares then these are offered to other people.

Journal Entries

    •   Shares issued against cash

                Debit:           Cash / Bank Account
                Credit:                          Share Capital Account
    •   Shares issued against transfer of asset:

                 Debit:          Asset Account
                 Credit:                          Share Capital Account
        This is called issuance of asset in kind.

Bonus Shares
This is another way of distributing dividend. When a company decides, not to give cash to the share
holders as dividend, it issued shares called bonus shares, to the share holders for which it receives no
cash. These are fully paid shares.

Financial Statements Of Limited Companies

In Pakistan, Financial Statements of limited companies are prepared in accordance with:
    • International accounting standards adopted in Pakistan.
    • Companies Ordinance 1984.
In case of conflict the requirements of Companies Ordinance would prevail over Accounting Standards.

Components Of Financial Statements

Components of companies’ financial statements are as follows:
                           Copyright© Virtual University of Pakistan                                114
Financial Statement Analysis-FIN621                                                               VU

    •    Balance Sheet
    •    Profit and Loss Account
    •    Cash Flow Statement
    •    Statement of Changes in Equity
    •    Notes to the Accounts
    •    Comparative figures of Previous Period

Equity

Equity is the total of capital, reserves and undistributed profit. That means the amount contributed by
share holders plus accumulated profits of the company. Equity, therefore, represents the total of
shareholders fund in the company.

Statement Of Changes In Equity

The statement of changes in equity shows the movement in the shareholders equity (capital and
reserves) during the year. We can say that it replaces profit and loss appropriation account of
partnership business.

FORMAT OF STATEMENT OF CHANGES IN EQUITY

        Name of the Company
        Statement of Changes in Equity
        For Year Ended June 30, 2002
                                     Share        Share       Reserves     Profit & Total
                                     Capital      Premium                  Loss A/c
                                                  Account
        Balance On Jun 30, 2000        X          X           X            X         X

        Movements During the Year                                          X         X

        Balance On Jun 30, 2001        X          X           X            X         X

        Movements During the Year                                          X         X

        Balance On June 30, 2002       X          X           X            X         X


                          Copyright© Virtual University of Pakistan                               115
Financial Statement Analysis-FIN621                                                                VU

                                                                                             Lesson-28
                          TYPES OF BUSINESS ORGANIZATIONS
                                             (Continued)

Book Values of equity/share

                  Common stockholders equity (for calculating book value) = Total stockholders equity –
call price or redemption value of preferred stock-dividends in arrears on cumulative preferred stock.
  = 2,380,000 – (10,000x110) – 80,000 (dividend arrears)
  = 2,380,000 -1,100,000 – 80,000 = 1,200,000
 Book value per share common stock = common stockholders equity=1,200,000 =Rs.24
                                           Number of common share         50,000
 Book value/share: preferred stock

                                     = call price/redemption value = 1,100,000 = Rs.110
                                         Number of preferred share 10,000

                 Par value or stated value: It is the amount below which stockholders’ equity cannot be
reduced (except by losses or special legal action). A dividend cannot be declared if it would cause the
stockholders’ equity to fall below the par value. Par value therefore provides minimum cushion of
equity capital for protection of creditors. It is therefore called legal capital.

                 Par value, Book value and Market value of Shares are different. Par and Book values of
stock are no indication of its market value. In the case of common stock, it is the investors’
expectations, as to the profitability of future operations, which greatly affects the market value of
common shares, although other factors also play part. Market value of common stock thus shows the
investors’ confidence in the management. On the other hand, market price of preferred share varies
inversely with interest rate.

In financial markets, stock is the capital raised by a corporation or joint-stock company through the
issuance and distribution of shares. A person or organization which holds at least a partial share of
stocks is called a shareholder. The aggregate value of a corporation's issued shares is its market
capitalization.

Types of stock

Common stock

Common stock also referred to as common or ordinary shares, are, as the name implies, the most usual
and commonly held form of stock in a corporation. The other type of shares that the public can hold in a
corporation is known as preferred stock. Common stock that has been re-purchased by the corporation is
known as treasury stock and is available for a variety of corporate uses.

Common stock typically has voting rights in corporate decision matters, though perhaps different rights
from preferred stock. In order of priority in a liquidation of a corporation, the owners of common stock
are near the last. Dividends paid to the stockholders must be paid to preferred shares before being paid
to common stock shareholders.

Preferred stock

Preferred stock, sometimes called preferred shares, have priority over common stock in the distribution
of dividends and assets.


                          Copyright© Virtual University of Pakistan                                116
Financial Statement Analysis-FIN621                                                                      VU

Most preferred shares provide no voting rights in corporate decision matters. However, some preferred
shares have special voting rights to approve certain extraordinary events (such as the issuance of new
shares, or the approval of the acquisition of the company), or to elect directors.

Dual class stock

Dual class stock is shares issued for a single company with varying classes indicating different rights on
voting and dividend payments. Each kind of shares has its own class of shareholders entitling different
rights.

Treasury stock

Treasury stock is shares that have been bought back from public. Treasury Stock is considered issued,
but not outstanding.

Stock Derivatives


A stock derivative is any financial claim which has a value that is dependent on the price of the
underlying stock. Futures and options are the main types of derivatives on stocks. The underlying
security may be a stock index or an individual firm's stock, e.g. single-

stock futures.

Stock futures are contracts where the buyer, or long, takes on the obligation to buy on the contract
maturity date, and the seller, or short takes on the obligation to sell. Stock index futures are generally
not delivered in the usual manner, but by cash settlement.
A stock option is a class of option. Specifically, a call option is the right (not obligation) to buy stock in
the future at a fixed price and a put option is the right (not obligation) to sell stock in the future at a
fixed price. Thus, the value of a stock option changes in reaction to the underlying stock of which it is a
derivative. The most popular method of valuing stock options is the Black Scholes model
Apart from call options granted to employees, most stock options are transferable.

Shareholder

A shareholder (or stockholder) is an individual or company (including a corporation) that legally owns
one or more shares of stock in a joint stock company. Companies listed at the stock market are expected
to strive to enhance shareholder value.
Shareholders are granted special privileges depending on the class of stock, including the right to vote
(usually one vote per share owned) on matters such as elections to the board of directors, the right to
share in distributions of the company's income, the right to purchase new shares issued by the company,
and the right to a company's assets during a liquidation of the company. However, shareholder's rights
to a company's assets are subordinate to the rights of the company's creditors. This means that
shareholders typically receive nothing if a company is liquidated after bankruptcy (if the company had
had enough to pay its creditors, it would not have entered bankruptcy), although a stock may have value
after a bankruptcy if there is the possibility that the debts of the company will be restructured.

Shareholders are considered by some to be a partial subset of stakeholders, which may include anyone
who has a direct or indirect equity interest in the business entity or someone with even a non-pecuniary
interest in a non-profit organization. Thus it might be common to call volunteer contributors to an
association stakeholders, even though they are not shareholders.

Although directors and officers of a company are bound by fiduciary duties to act in the best interest of
the shareholders, the shareholders themselves normally do not have such duties towards each other.

                            Copyright© Virtual University of Pakistan                                    117
Financial Statement Analysis-FIN621                                                                   VU


However, in a few unusual cases, some courts have been willing to imply such a duty between
shareholders. For example, in California, majority shareholders of closely held corporations have a duty
to not destroy the value of the shares held by minority shareholders.

The largest shareholders (in terms of percentages of companies owned) are often mutual funds, and
especially passively managed exchange-traded funds.

Application

The owners of a company may want additional capital to invest in new projects within the company.
They may also simply wish to reduce their holding, freeing up capital for their own private use.

By selling shares they can sell part or all of the company to many part-owners. The purchase of one
share entitles the owner of that share to literally share in the ownership of the company a fraction of the
decision-making power, and potentially a fraction of the profits, which the company may issue as
dividends.

In the common case of a publicly traded corporation, where there may be thousands of shareholders, it
is impractical to have all of them making the daily decisions required to run a company. Thus, the
shareholders will use their shares as votes in the election of members of the board of directors of the
company.

In a typical case, each share constitutes one vote. Corporations may, however, issue different classes of
shares, which may have different voting rights. Owning the majority of the shares allows other
shareholders to be out-voted - effective control rests with the majority shareholder (or shareholders
acting in concert). In this way the original owners of the company often still have control of the
company.

Shareholder rights

Although ownership of 51% of shares does result in 51% ownership of a company, it does not give the
shareholder the right to use a company's building, equipment, materials, or other property. This is
because the company is considered a legal person, thus it owns all its assets itself. This is important in
areas such as insurance, which must be in the name of the company and not the main shareholder.

Even though the board of directors runs the company, the shareholder has some impact on the
company's policy, as the shareholders elect the board of directors. Each shareholder typically has a
percentage of votes equal to the percentage of shares he or she owns. So as long as the shareholders
agree that the management (agent) are performing poorly they can elect a new board of directors which
can then hire a new management team. In practice, however, genuinely contested board elections are
rare. Board candidates are usually nominated by insiders or by the board of the directors themselves,
and a considerable amount of stock is held and voted by insiders.

Owning shares does not mean responsibility for liabilities. If a company goes broke and has to default
on loans, the shareholders are not liable in any way. However, all money obtained by converting assets
into cash will be used to repay loans and other debts first, so that shareholders cannot receive any
money unless and until creditors have been paid (most often the shareholders end up with nothing).

Means of financing

Financing a company through the sale of stock in a company is known as equity financing.
Alternatively, debt financing (for example issuing bonds) can be done to avoid giving up shares of
ownership of the company. Unofficial financing known as trade financing usually provides the major

                           Copyright© Virtual University of Pakistan                                  118
Financial Statement Analysis-FIN621                                                                    VU

part of a company's working capital (day-to-day operational needs). Trade financing is provided by
vendors and suppliers who sell their products to the company at short-term, unsecured credit terms,
usually 30 days. Equity and debt financing are usually used for longer-term investment projects such as
investments in a new factory or a new foreign market. Customer provided financing exists when a
customer pays for services before they are delivered, e.g. subscriptions and insurance.

Trading

A stock exchange is an organization that provides a marketplace for either physical or virtual trading
shares, bonds and warrants and other financial products where investors (represented by stock brokers)
may buy and sell shares of a wide range of companies. A company will usually list its shares by meeting
and maintaining the listing requirements of a particular stock exchange and the different.

Arbitrage Trading

Although it makes sense for some companies to raise capital by offering stock on more than one
exchange, in today's era of electronic trading, there is limited opportunity for private investors to make
profit on pricing discrepancies between one stock exchange and another. As such, arbitrage
opportunities disappear quickly due to the efficient nature of the market.

Buying

There are various methods of buying and financing stocks. The most common means is through a stock
broker. Whether they are a full service or discount broker, they arrange the transfer of stock from a
seller to a buyer. Most trades are actually done through brokers listed with a stock exchange.

There are many different stock brokers from which to choose, such as full service brokers or discount
brokers. The full service brokers usually charge more per trade, but give investment advice or more
personal service; the discount brokers offer little or no investment advice but charge less for trades.
Another type of broker would be a bank or credit union that may have a deal set up with either a full
service or discount broker.
There are other ways of buying stock besides through a broker. One way is directly from the company
itself. If at least one share is owned, most companies will allow the purchase of shares directly from the
company through their investor relations departments. However, the initial share of stock in the
company will have to be obtained through a regular stock broker. Another way to buy stock in
companies is through Direct Public Offerings which are usually sold by the company itself. A direct
public offering is an initial public offering in which the stock is purchased directly from the company,
usually without the aid of brokers.

When it comes to financing a purchase of stocks there are two ways: purchasing stock with money that
is currently in the buyers ownership, or by buying stock on margin. Buying stock on margin means
buying stock with money borrowed against the stocks in the same account. These stocks, or collateral,
guarantee that the buyer can repay the loan; otherwise, the stockbroker has the right to sell the stock
(collateral) to repay the borrowed money. He can sell if the share price drops below the margin
requirement, at least 50% of the value of the stocks in the account. Buying on margin works the same
way as borrowing money to buy a car or a house, using the car or house as collateral. Moreover,
borrowing is not free; the broker usually charges 8-10% interest.

Selling

Selling stock is procedurally similar to buying stock. Generally, the investor wants to buy low and sell
high, if not in that order (short selling); although a number of reasons may induce an investor to sell at a
loss, e.g., to avoid further loss.


                           Copyright© Virtual University of Pakistan                                   119
Financial Statement Analysis-FIN621                                                                     VU

As with buying a stock, there is a transaction fee for the broker's efforts in arranging the transfer of
stock from a seller to a buyer. This fee can be high or low depending on which type of brokerage,
discount or full service, handles the transaction.

After the transaction has been made, the seller is then entitled to all of the money. An important part of
selling is keeping track of the earnings. Importantly, on selling the stock, in jurisdictions that have them,
capital gains taxes will have to be paid on the additional proceeds, if any, that are in excess of the cost
basis.

==Stock price fluctuations The price of a stock fluctuates fundamentally due to the theory of supply and
demand. Like all commodities in the market, the price of a stock is directly proportional to the demand.
However, there are many factors on basis of which the demand for a particular stock may increase or
decrease. These factors are studied using methods of fundamental analysis and technical analysis to
predict the changes in the stock price.


                            Copyright© Virtual University of Pakistan                                   120
Financial Statement Analysis-FIN621                                                               VU

                                                                                            Lesson-29
                                           SUMMARY
                                        (Previous Lectures)
   Example

   •  Which of the following are based upon the realization principle and the matching principle
      (indicate all correct answers).
          – Adjusting Entries (Matching Principle)
          – Closing Entries (Matching Principle)
          – Accrual Basis of Accounting
          – Measurement of Net Income under GAAP (Matching Principle)
Example

   •   Which of the following explains the debit and credit rules relating to recording of Revenues and
       Expenses:
          – Expenses appear on the left side of the balance sheet and are recorded by debits.
              Revenues appear on the right side of the balance sheet and are recorded by credits. (X)
          – Expenses appear on the left side of the income statement and are recorded by debits.
              Revenues appear on the right side of the income statement and are recorded by credits.
              (X)
          – The effect of revenues and expenses in the owner’s equity. (Tick Correct)
          – Realization and Matching Principle. (X)

Example

   •   The entry to recognize Depreciation expenses (indicate all correct answers):
          – Is an application of Matching Principle? (Correct)
          – Is a closing entry. (X)
          – Usually includes an offsetting credit either to cash or to Accounts payable. (X)
          – Is an adjusting entry. (Correct)

Example

   •   Indicate all correct answers:
           – In the accounting cycle, closing entries are made before adjusting entries. (X)
           – Financial Statements may be prepare as soon as adjusted trial balance is completed.
               (Correct)
           – The owner’s equity is not up to date until the closing entries have been posted. (Correct)
           – Adjusting entries are prepared before financial statements are prepared. (Correct)


                         Copyright© Virtual University of Pakistan                                121
Financial Statement Analysis-FIN621                                                               VU

                                                                                            Lesson-30
                                            SUMMARY
                                         (Previous Lectures)

Example

    •   When a business is organized as a corporation:
          – Stock holders are liable for the debt of the business only in proportion to their
               percentage ownership in stock. (X)
          – Stock holders do not have to pay personal income tax on dividends received because the
               corporation is subject to income tax on its earnings. (X)
          – Fluctuations in the market value of outstanding shares of capital stock do not affect the
               amount of stock holders’ equity shown in the balance sheet. (Correct)
          – Each stock holder has the right to bind the corporation to contracts and to make other
               managerial decisions. (X)


Example
Choose the correct answer.
   • Moosa Corporation was organized with authorization to issue 100,000 shares of Re. 1 par value
       common stock. 40,000 were issued to Moosa, the company’s founder, but at a price of Rs. 5 per
       share. No other shares have yet been issued.
           – Moosa owns 40% of the stock holders’ equity of the corporation. (X)
           – The corporation should recognize Rs. 160,000 gain in the issuance of these shares. (X)
           – If the balance sheet includes retained earnings of Rs. 50,000, total paid in capital
               amounts to Rs. 250,000. (X)
           – In the balance sheet, additional paid in capital account will have Rs. 160,000 balance,
               regardless of the profit earned or losses incurred since the organization was organized.
               (Correct)

Example
Choose the correct answer.
   • The statement of cash flows is designed to assist users in assessing each of the following except:
           – The ability of the company to remain solvent. (X)
           – In assessing the company’s profitability. (Correct)
           – Major source of cash receipt during the period. (X)
           – The reason why net cash flows from operating activities differ from net income. (X)


                          Copyright© Virtual University of Pakistan                               122
Financial Statement Analysis-FIN621                                                                     VU

                                                                                                 Lesson-31
                             FINANCIAL STATEMENT ANALYSIS

Analysis of income statement and balance sheet:

Financial Statements are like the Instrument panels of a business. There are different needs of different
users of these statements. Users can be outside users and internal users. Identity of user is important, so
as to provide him/her with relevant information.

Financial statement analysis is the process of examining relationships among financial statement
elements and making comparisons with relevant information. It is a valuable tool used by investors and
creditors, financial analysts, and others in their decision-making processes related to stocks, bonds, and
other financial instruments. The goal in analyzing financial statements is to assess past performance and
current financial position and to make predictions about the future performance of a company. Investors
who buy stock are primarily interested in a company's profitability and their prospects for earning a
return on their investment by receiving dividends and/or increasing the market value of their stock
holdings. Creditors and investors who buy debt securities, such as bonds, are more interested in liquidity
and solvency: the company's short-and long-run ability to pay its debts. Financial analysts, who
frequently specialize in following certain industries, routinely assess the profitability, liquidity, and
solvency of companies in order to make recommendations about the purchase or sale of securities, such
as stocks and bonds.

Analysts can obtain useful information by comparing a company's most recent financial statements with
its results in previous years and with the results of other companies in the same industry. Three primary
types of financial statement analysis are commonly known as horizontal analysis, vertical analysis, and
ratio analysis.

Fundamental Analysis

Fundamental analysis at company level involves analyzing basic financial variables in order to estimate
intrinsic value. These variables include sales, profit margins, depreciation, the tax rate, sources of
financing, asset utilization, and other factors. Additional analysis could involve the firm’s competitive
position in its industry, labor relations, technological changes, management, foreign competition, and so
on. The end result of fundamental analysis at the company level is an estimate of the two factors that
determine a security’s value: cash flow stream and a required rate of return (alternatively, a P/E ratio)

Industry analysis

Industries as well as the market and companies, are analyzed through the study of a wide range of data,
including sales, earnings, dividends, capital structure, product lines, regulations, innovations, and so on.
Such analysis requires considerable expertise and is usually performed by industry analysts employed
by brokerage firms and other institutional investors.

A useful first step is to analyze industries in terms of their stage in the life cycle. The idea is to assess
the industry’s general health and current position. A second step is to assess the position of the industry
in relation to the business cycle and macro economic conditions. A third step involves qualitative
analysis of industry characteristics designed to assist investors in assessing the industry’s future
prospects.

Uses and limitations of financial analysis

Ratio analysis is used by three main groups: (1) managers, who employ ratios to help analyze, control,
and thus improve their firms’ operations; (2) credit analyst, including bank loan officers and bond rating

                            Copyright© Virtual University of Pakistan                                   123
Financial Statement Analysis-FIN621                                                                    VU

analysts, who analyze ratios to help ascertain a company’s ability to pay its debts; and (3) stock analyst,
who are interested in a company’s efficiency, risk, and growth prospects.

        Many large firms operate different divisions in different industries, and for such companies it is
        difficult to develop a meaningful set of industry averages. Therefore, ratio analysis is more
        useful for small, narrowly focused firms than for large, multidivisional ones.
        Most firms want to be better than average, so merely attaining average performance is not
        necessarily good. As a target for high-level performance, it is best to focus on the industry
        leaders’ ratios. Benchmarking helps in this regard.
        Inflation may have badly distorted firms’ balance sheet- recorded values are often substantially
        different from “true” values. Further, because inflation affects both depreciation charges and
        inventory costs, profits are also affected. Thus, a ratio analysis for one firm over time, or a
        comparative analysis of firms of different ages, must be interpreted with judgment.
        Seasonal factors can also distort a ratio analysis. For example, the inventory turnover ratio for a
        food processor will be radically different if the balance sheet figure used for inventory is the one
        just before versus just after the close of the canning season. This problem can be minimized by
        using monthly averages for inventory (and receivables) when calculating turnover ratios.
        Firms can employ “window dressing” techniques to make their financial statements look
        stronger.
        Different accounting practices can distort comparisons. As noted earlier, inventory valuation
        and depreciation methods can affect financial statements and thus distort comparisons among
        firms. Also, if one firm leases a substantial amount of its productive equipment, its assets may
        appear low relative to sales because leased assets often do not appear on the balance sheet, at
        the same time, the liability associated with the lease obligation may not be shown as a debt.
        Therefore leasing can artificially improve both the turnover and the debt ratios. However
        accounting professional has taken steps to reduce this problem.
        It is difficult to generalize about whether a particular ratio is “good” or “bad”. For example, a
        high current ratio may indicate a strong liquidity position, which is good or excessive cash,
        which is bad (because excess cash in the bank is a non-earning asset). Similarly, a high fixed
        assets turnover ratio may denote either that a firm uses its assets efficiently or that is
        undercapitalized and can not afford to buy enough assets.
        A firm may have some ratios that look “good” and others that look “bad,” making it difficult to
        tell whether the company is, on balance, stronger or weak. However statistical procedures can
        be used to analyze the net effects of a set of ratios. Many banks and other lending organizations
        use discriminant analysis, a statistical technique, to analyze firms’ financial ratios, and then
        classify the firms according to their probability of getting into financial trouble.

Accounting Information

        Different Accounting Policies

The choices of accounting policies may distort inter company comparisons. Example IAS 16 allows
valuation of assets to be based on either revalued amount or at depreciated historical cost. The business
may opt not to revalue its asset because by doing so the depreciation charge is going to be high and will
result in lower profit.

        Creative accounting

The businesses apply creative accounting in trying to show the better financial performance or position
which can be misleading to the users of financial accounting. Like the IAS 16 mentioned above,
requires that if an asset is revalued and there is a revaluation deficit, it has to be charged as an expense
in income statement, but if it results in revaluation surplus the surplus should be credited to revaluation
reserve. So in order to improve on its profitability level the company may select in its revaluation


                           Copyright© Virtual University of Pakistan                                   124
Financial Statement Analysis-FIN621                                                                     VU

programme to revalue only those assets which will result in revaluation surplus leaving those with
revaluation deficits still at depreciated historical cost.

Information problems

        Ratios are not definitive measures

Ratios need to be interpreted carefully. They can provide clues to the company’s performance or
financial situation. But on their own, they cannot show whether

Performance is good or bad.

Ratios require some quantitative information for an informed analysis to be made.

        Outdated information in financial statement

The figures in a set of accounts are likely to be at least several months out of date, and so might not give
a proper indication of the company’s current financial position.

        Historical costs not suitable for decision making

IASB Conceptual framework recommends businesses to use historical cost of accounting. Where
historical cost convention is used, asset valuations in the balance sheet could be misleading. Ratios
based on this information will not be very useful for decision making.

        Financial statements certain summarized information

Ratios are based on financial statements which are summaries of the accounting records. Through the
summarization some important information may be left out which could have been of relevance to the
users of accounts. The ratios are based on the summarized year end information which may not be a true
reflection of the overall year’s results.

        Interpretation of the ratio

It is difficult to generalize about whether a particular ratio is ‘good’ or ‘bad’. For example a high current
ratio may indicate a strong liquidity position, which is good or excessive cash which is bad. Similarly
Non current assets turnover ratio may denote either a firm that uses its assets efficiently or one that is
under capitalized and cannot afford to buy enough assets.

Comparison of performance over time

        Price changes

Inflation renders comparisons of results over time misleading as financial figures will not be within the
same levels of purchasing power. Changes in results over time may show as if the enterprise has
improved its performance and position when in fact after adjusting for inflationary changes it will show
the different picture.

        Technology changes

When comparing performance over time, there is need to consider the changes in technology. The
movement in performance should be in line with the changes in technology. For ratios to be more
meaningful the enterprise should compare its results with another of the same level of technology as this
will be a good basis measurement of efficiency.

                            Copyright© Virtual University of Pakistan                                   125
Financial Statement Analysis-FIN621                                                                  VU


        Changes in Accounting policy

Changes in accounting policy may affect the comparison of results between different accounting years
as misleading. The problem with this situation is that the directors may be able to manipulate the results
through the changes in accounting policy. This would be done to avoid the effects of an old accounting
policy or gain the effects of a new one. It is likely to be done in a sensitive period, perhaps when the
business’s profits are low.

        Changes in Accounting standard

Accounting standards offers standard ways of recognizing, measuring and presenting financial
transactions. Any change in standards will affect the reporting of an enterprise and its comparison of
results over a number of years.

        Impact of seasons on trading

As stated above, the financial statements are based on year end results which may not be true reflection
of results year round. Businesses which are affected by seasons can choose the best time to produce
financial statements so as to show better results. For example, a tobacco growing company will be able
to show good results if accounts are produced in the selling season. This time the business will have
good inventory levels, receivables and bank balances will be at its highest. While as in planting seasons
the company will have a lot of liabilities through the purchase of farm inputs, low cash balances and
even nil receivables.

Inter-firm comparison

        Different financial and business risk profile

No two companies are the same, even when they are competitors in the same industry or market. Using
ratios to compare one company with another could provide misleading information. Businesses may be
within the same industry but having different financial and business risk. One company may be able to
obtain bank loans at reduced rates and may show high gearing levels while as another may not be
successful in obtaining cheap rates and it may show that it is operating at low gearing level. To un
informed analyst he may feel like company two is better when in fact its low gearing level is because it
can not be able to secure further funding.

        Different capital structures and size

Companies may have different capital structures and to make comparison of performance when one is
all equity financed and another is a geared company it may not be a good analysis.

        Impact of Government influence

Selective application of government incentives to various companies may also distort intercompany
comparison. One company may be given a tax holiday while the other within the same line of business
not, comparing the performance of these two enterprises may be misleading.

        Window dressing

These are techniques applied by an entity in order to show a strong financial position. For example,
ABC Trucking can borrow on a two year basis, K10 Million on 28th December 2006, holding the
proceeds as cash, then pay off the loan ahead of time on 3rd January 2007. This can improve the current


                           Copyright© Virtual University of Pakistan                                 126
Financial Statement Analysis-FIN621                                                                   VU

and quick ratios and make the 2006 balance sheet look good. However the improvement was strictly
window dressing as a week later the balance sheet is at its old position.
Ratio analysis is useful, but analysts should be aware of these problems and make adjustments as
necessary. Ratios analysis conducted in a mechanical, unthinking manner is dangerous, but if used
intelligently and with good judgment, it can provide useful insights into the firm’s operations.

Three broad areas of evaluating a business are its solvency, stability and profitability, which are studied
through analysis of financial statements. There are four techniques of Financial Statements Analysis.

ANALYSIS TECHNIQUES

1.      Rupee and percentage changes: figures of Financial Statements from one year to the next i.e.
year-to-year are considered.

Income Statement for the year ending June, 30

                                 2001             2002            2003
Net sales                        400              500             600
Cost of Good Sold.               235              300             370
Gross profit.                    165              200             230
Other expenses.          115             160              194
Net income.                       50               40               36

                Percentage change cannot be computed for negative amount or zero amount in base
year. Mere figure of rising sales are not sufficient. We have to look at the volume of sales vis-à-vis sale
price. Quarterly or monthly measurement is also done. It compares results of current quarter or month
with those of the same quarter or month in the previous year in order to take care of distortion by
seasonal fluctuations. Size of base amount has to be reasonable (Example: 90% decline to be followed
by 900% increase just to get back to the starting point). Percentage become misleading when base is
small:

                          1st year       2nd year              3rd year
  Income                  100,000        10,000        100,000
                                         (90% decline)         (900% increase)


                           Copyright© Virtual University of Pakistan                                  127
Financial Statement Analysis-FIN621                                                                    VU

                                                                                                Lesson-32
                           COMMON –SIZE AND INDEX ANALYSIS

Method used by interested parties such as investors, creditors, and management to evaluate the past,
current, and projected conditions and performance of the firm. Ratio analysis is the most common form
of financial analysis. It provides relative measures of the firm's conditions and performance. Horizontal
Analysis and Vertical Analysis are also popular forms. Horizontal analysis is used to evaluate the trend
in the accounts over the years, while vertical analysis, also called a Common Size Financial Statement
discloses the internal structure of the firm. It indicates the existing relationship between sales and each
income statement account. It shows the mix of assets that produce income and the mix of the sources of
capital, whether by current or long-term debt or by equity funding. When using the financial ratios, a
financial analyst makes two types of comparisons:

(a) Industry comparison. The ratios of a firm are compared with those of similar firms or with industry
averages or norms to determine how the company is faring relative to its competitors. Industry average
ratios are available from a number of sources

 (b) Trend analysis. A firm's present ratio is compared with its past and expected future ratios to
determine whether the company's financial condition is improving or deteriorating over time.

After completing the financial statement analysis, the firm's financial analyst will consult with
management to discuss plans and prospects, any problem areas identified in the analysis, and possible
solutions. Given below is a list of widely used financial ratios.

2.      Trend percentages/ Horizontal Analysis/ Index Analysis: This analysis considers changes in
items of financial statement from a base year to the following years to show the direction of change.
This is also called horizontal analysis. In this, the figures of various years are placed side by side in
adjacent columns in the form of comparative financial statements.

3. Component percentages/ Vertical Analysis/ Common- Size Analysis: This type of analysis
   indicates the relative size of each item in the Financial Statements as a percentage of the total of that
   Statement i.e. Total Assets or total Liabilities & Shareholders equity in Balance Sheet and Sales in
   Income Statement. Such a statement is then called common-size Financial Statement. This type of
   analysis technique is also called Vertical Analysis.

Vertical Analysis

When using vertical analysis, the analyst calculates each item on a single financial statement as a
percentage of a total. The term vertical analysis applies because each year's figures are listed vertically
on a financial statement. The total used by the analyst on the income statement is net sales revenue,
while on the balance sheet it is total assets. This approach to financial statement analysis, also known as
component percentages, produces common-size financial statements. Common-size balance sheets and
income statements can be more easily compared, whether across the years for a single company or
across different companies

Financial statement item that is used as a base value. All other accounts on the financial statement are
compared to it. In the balance sheet, for example, total assets equals 100%. Each asset is stated as a
percentage of total assets. Similarly, total liabilities and stockholders' equity are assigned 100% with a
given liability or equity account stated as a percentage of the total liabilities and stockholders' equity.
For the income statement, 100% is assigned to net sales with all revenue and expense accounts related to
it. Under vertical analysis, the statements showing the percentages are referred to as Common Size
Financial Statements. Common size percentages can be compared from one period to another to identify
areas needing attention. An illustration follows:

                           Copyright© Virtual University of Pakistan                                   128
Financial Statement Analysis-FIN621                                                                  VU


Horizontal Analysis

When an analyst compares financial information for two or more years for a single company, the
process is referred to as horizontal analysis, since the analyst is reading across the page to compare any
single line item, such as sales revenues. In addition to comparing dollar amounts, the analyst computes
percentage changes from year to year for all financial statement balances, such as cash and inventory.
Alternatively, in comparing financial statements for a number of years, the analyst may prefer to use a
variation of horizontal analysis called trend analysis. Trend analysis involves calculating each year's
financial statement balances as percentages of the first year, also known as the base year. When
expressed as percentages, the base year figures are always 100 percent, and percentage changes from the
base year can be determined.

Time series analysis of financial statements covering more than one accounting period; also called
Trend Analysis. It looks at the percentage change in an account over time. The percentage change
equals the change over the prior year. For example, if sales in 20X0 are $100,000 and in 20X1 are
$300,000, there is a 200% increase ($200,000/$100,000). By examining the magnitude of direction of a
financial statement item over time, the analyst can evaluate its reasonableness.

Common Size Financial Statement

A company financial statement that displays all items as percentages of a common base figure. This
type of financial statement allows for easy analysis between companies or between time periods of a
company.


                           Copyright© Virtual University of Pakistan                                 129
Financial Statement Analysis-FIN621                                                                        VU

                                                                                                    Lesson-33

                                           RATIOS ANALYSIS

              4. ANALYSIS BY RATIOS:

    Financial Ratios are like financial temperatures, which give the state of the health of a business.
    This analysis technique is most widely used. In these inter-linkages of Income Statement and
    Balance Sheet items are established and inferences are drawn there from.

        The analysis technique by Ratios would broadly consist of the following:-

              a)       Analysis by short-term creditors: Interest of short-term creditors is to watch the
                       ability of business to meet its debts as these become due; i.e. Short-term solvency.
                       They want to see whether business has the ability to meet its current liabilities out
                       of its current assets. I the entity can not maintain a short-term debt paying ability, it
                       will not be able to maintain a long-term debt-paying ability, nor will it be able to
                       satisfy its stockholders. Even a very profitable entity will find itself bankrupt if it
                       fails to meet its obligations to short-term creditors. The ability to pay current
                       obligations when due is also related to the cash-generating ability of the firm. While
                       analyzing the short-term debt-paying ability of the firm, we find a close relationship
                       between the current assets and the current liabilities. Generally the current liabilities
                       will be paid with cash generated from the current assets. Profitability of the firm
                       does not determine the short-term debt paying ability. Indicators of this ability are
                       the short-term solvency ratios, which are:-

        Liquidity Ratios
                    Liquidity Ratios are used to measure a firm’s ability to meet short-term obligations.
    They compare short-term obligations to short-term (or current) resources available to meet these
    obligations. From these ratios, much insight can be obtained into the present cash solvency of the
    firm and the firm’s ability to remain solvent in the event of adversity.
        i)       Current ratio = Current assets
                                  Current liabilities                  (Normal ratio for this is 2:1)

                Current assets divided by current liabilities. It shows a firm’s ability to cover its current
liabilities with its current assets. Higher the current Ratio, the greater the ability of the firm to pay its
bills; however, the ratio must be regarded as a crude measure because it does not take into account the
liquidity of the individual components of the current assets composed principally of cash and non-
overdue receivables is generally regarded as more liquid than a firm whose current assets consist
primarily of inventories. Consequently, we turn to a more critical, or sever, test of the firm’s liquidity-
the acid test ratio
                  i.e. Current assets should be twice the current liabilities. It should however be noted
                  that too high ratio may indicate that capital is not being used productively and
                  efficiently. Such a situation calls for financial reorganization.

        ii)        Quick ratio. This is also called acid-test ratio. In this, inventories and pre-paid
                   expenses are excluded from current assets. Only cash, marketable securities and
                   Receivables (called Quick Assets) are considered. For Quick Ratio, the normal ratio is
                   1:1 i.e. quick assets should be equal to current liabilities. It should be noted that current
                   ratio measures “general liquidity”, whereas quick ratio measures “immediate liquidity”.

                   Acid Test Ratio = Current assets- Inventories/ Current Liabilities
                   This ratio serves as a supplement to the current ratio in analyzing liquidity. This ratio is
                   the same as the current ratio except that it excludes inventories. Presumably the least
                              Copyright© Virtual University of Pakistan                                    130
Financial Statement Analysis-FIN621                                                                  VU

              liquid portion of current-assets-from the numerator. The ratio concentrates primarily on
              the more liquid current assets, cash, marketable securities, and receivables, in relation to
              current obligations. Thus, this ratio provides a more penetrating measure of liquidity
              than does the current ratio.

      Cash Ratio = Cash Equivalents + Marketable Securities/ Current Liabilities

      The cash ratio indicates the immediate liquidity of the firm. A high cash ratio indicates that the
      firm is not using its cash to its best advantages; cash should be put to work in the operations of
      the company


                         Copyright© Virtual University of Pakistan                                   131
Financial Statement Analysis-FIN621                                                                 VU

                                                                                               Lesson-34
                                            ACTIVITY RATIOS

       Activity Ratios also known as efficiency or turn over ratios, measure how effectively the firm is
       using its assets. Some aspects of activity analysis are closely related to liquidity analysis. Our
       focus is to attention on how effectively the firm is managing two specific asset groups-
       receivables and inventories- and its total assets in general.

       iii)    Working capital: It depends upon the size and nature of business. Arithmetically it is
               the difference of Current Assets and Current Liabilities. Two companies with same
               working capital can have different current ratios. Similarly two companies may have
               same current ratio but different working capital.

       iv)     Quality of Working Capital:

       (A) Liquidity of inventory:
       To help determined how effectively the firm is managing inventory (and also to gain an
       indication of the liquidity of inventory) we compute the inventory turn over ratio. This ratio,
       like other ratios, must be judged in relation to ratios of similar firms, the industry average or
       both
       Generally the higher the inventory turn-over , the more efficient the inventory management of
       the firm and the “fresher” more liquid, the inventory and vice versa.
        It shows how quickly inventory is sold and is determined by Inventory Turnover Ratio
       (ITO). It is the number of times the company sells (turns over) it inventory during the year.

       Inventory Turnover Ratio (ITO) = Cost of good sold for the year____          = 60 = 3
                                        Average inventory during the year            20

The higher the rate, the more quickly the company sells its inventory. However, companies selling high
markup items e.g. Jewelry Stores, F-16 can operate successfully with much lower ITO.

               Days required to sell inventory: i.e.

               Converting inventory into Receivables = 365 or 300 = 365 or 300 = 122 or 100
                                                           ITO       3      3


                          Copyright© Virtual University of Pakistan                                 132
Financial Statement Analysis-FIN621                                                                      VU

                                                                                                  Lesson-35

                                                ACTIVITY RATIOS
                                                  (Continued)

        (B)        Liquidity of Receivables: It shows have quickly Accounts Receivables are
                   collected i.e. converted into cash. It is determined by Receivable Turnover Ratio
                   (RTO). It is number of times “Receivables” are converted into cash during the year.

                   =   net sale for the year               = 100 = 10
                       Average Receivables during the year. 10

                   Ideally RTO = net credit sales______________
                                Monthly average of Receivables

                   The higher the RTO, the more liquid the company’s Receivables.

                   Days required to collect Receivables i.e.

                   Converting “Receivable” into cash = 365 or 300 = 36 or 30

                   Normal credit terms: 30 to 60 days.

                   Length of operating cycle: A+ B (158, 130) days.


                                                  RATIOS

                                                   Gross Profit     x 100
Gross profit ratio
                                                   Net sales

                                                   Net Profit     x 100
Net Profit ratio
                                                   Net sales

                                                   Operating Profit x 100
Operating Profit ratio
                                                   Net sales

                                                   Individual Expenses      x 100
Expenses ratios
                                                   Net sales

                                                   Operating cost
Operating (Cost) Ratio                                                 x 100
                                                   Net sales

                                                   Net Profit after inteerest and tax   x 100
Net Profit to net worth ratio
                                                   Net sales

                                                   Net Profit before interest, tax               x 100
Return on capital employed (ROI)
                                                   Capital employed

                                                   Net profit avaiable for equity shareholders
Earning per share
                                                   Number of equity shares

Dividends per share                                ______Dividend amunt______
                              Copyright© Virtual University of Pakistan                                  133
Financial Statement Analysis-FIN621                                                   VU

                                                Number of equity shares

                                                ___Cost or sales ___
Capital employed turnover ratio
                                                Capital employed

                                                Cost of sales or sales
Fixed assets turnover ratio
                                                Fixed assets

                                                Cost of sales or Net sales
Working capital turnover ratio
                                                Net working capital

                                                _____Cost of goods and sold______
Inventory turnover ration
                                                Average accounts receivables

                                                ______Annual net credit sales______
Debtors (receivables) turnover ratio
                                                Average accounts receivables

                                                _______Accounts receivables______
Debtors (receivables) collection period
                                                Average accounts receivables

                                                ____Net credit pruchases ___
Creditors turnover ratio
                                                Average creditors

                                                ____Average accounts payables ___
Average credit period
                                                Net credit purchase per day

                                                _____Current aeests ____
Current ratio
                                                Current liabilities

                                                _______Quick assets______
Quick ratio/Acid test ratio
                                                Current liabilities

Debt-equity ratio:

                                                ____Total long term debt____
(i)     Debt to net worth
                                                Shareholder’s funds

                                                ______External equity____
(ii)    External-internal equity
                                                Internal equity

                                                ____Total long term debts ___
(iii)   Debt vs. funds
                                                Total long term funds

                                                Earnings before interest and taxes
        Debt service ratio
                                                Fixed interest charges

                                                ____Net fixed assets ___
        Fixed assets ratio
                                                Long-term funds

        Solvency (Debt to total funds)          ____Total liabiities ___
        ratio                                   Total assets

                                                ____________ Equity _____________
        Capital gearing ratio
                                                fixed interest bearing securities

                              Copyright© Virtual University of Pakistan               134
Financial Statement Analysis-FIN621                                   VU


                                            Proprietor’s funds
      Proprietary ratio
                                            Total assets


                          Copyright© Virtual University of Pakistan   135
Financial Statement Analysis-FIN621                                                                          VU

                                                                                                     Lesson-36

                                     LEVERAGE/DEBT RATIOS

          (b)     Analysis by long-term creditors: Interest of long-term creditors is to see the long-term
                  solvency of the business and rate of return on their loans. Solvency is the ability to meet
                  outside liabilities from total assets. Indicators of solvency are the Long-term Solvency,
                  which are as follows:-

          i)      Debt –To-Total-Assets: The debt-to-total assets ratio is derived by dividing a firm’s

                  total debt by its total assets: It indicates percentage of total assets financed by debt

                  = Total outside liabilities /Debt                           = 75 = 37.5%
                    Total assets (total liabilities +shareholders funds)        200

                From creditors’ point of view, the lower the debt ratio, the better it is because it means
that shareholders have contributed the bulk of funds and margin of protection to creditors is high.

In addition to the previous ratio, we may wish to compute the following ratio, which deals with only
the long-term capitalization of the firm:

*Long Term debt/ Total Capitalization (Share capital + Fixed Liabilities)

Where total capitalization represents all long-term debt and shareholder’s equity. This tells us the
relative importance of long term debt to the capital structure (long-term financing) of the firm.

                Leverage: It means operating a business with borrowed money. It should be used to
earn a return (on assets or equity) greater than cost of borrowing i.e. interest. Alternate term for this is
“Gearing”.

ii)       Equity ratio: Total stockholders equity (including preferred stock) = 125 = 62.5%
                       Total assets (total liabilities + shareholders funds)     200

                  This is opposite of Debt ratio. Low equity ratio indicates extensive use of leverage i.e.
borrowings.

iii) Debt-To- Equity: Ratio of borrowed capital to Shareholders’ funds is called Debt – Equity Ratio.
The debt-to-equity ratio is computed by simply dividing the total debt of the firm (including current
liabilities) by its shareholders’ equity:

 = 75 = 0.6 i.e. Debt is 0.6 of Equity =Debt Ratio = 37.5: 62.5 (Debt equity Ratio)
  125                                   Equity Ratio

      Creditors would generally like this ratio to be low. The lower the ratio, the higher the level of firm’s
      that is being provided by shareholders and the larger the creditor cushion (margin of protection) in
      the event of shrinking asset values or outright losses.
      Depending on the purpose for which the ratio is used, preferred stock is sometimes included as debt
      rather than as equity when debt ratios are calculated. Preferred stock represents a prior claim from
      the stand point of the investors in common stock: consequently, investors might include preferred
      stock as debt when analyzing a firm. The ratio of debt to equity will vary according to the nature of
      the business and the variability of cash flows. A comparison of the debt to equity ratio for a given
      company with those of similar firms gives us a general indication of the credit worthiness and
      financial risk of the firm.
                             Copyright© Virtual University of Pakistan                                       136
Financial Statement Analysis-FIN621                                                                  VU


    Coverage Ratio

    Coverage ratios are designed to relate the financial charges of a firm to its ability to service, or
    cover, them. One of the most traditional coverage ratios is the interest coverage ratio, or times
    interest earned

iv) Interest coverage ratio = operating income available for interest payment = 25 = 5
annual interest expenses.                    5
                                                                            (Normal ratio 3:5)

This ratio serves as one measure of the firm’s ability to meet its interest payments and thus avoid
bankruptcy. In general, the higher the ratio, the greater the likelihood that the company could cover its
interest payments without difficulty. It also sheds some light on the firm’s capacity to take on new debt.

               Changes in Solvency Ratios indicate changes in enterprise activities; its expansion or
contraction.


                            Copyright© Virtual University of Pakistan                                137
Financial Statement Analysis-FIN621                                                                      VU

                                                                                                  Lesson-37
                                         PROFITABILITY RATIOS

        (C)      Analysis by common stockholders:

        Common Stockholders are the investors whose objective is to determine whether investment is
        sound, how the business performed and what has are future expectations. Their interest is to
        watch Return on their investment (ROI).

        i)       Return on Common Stockholder’s equity =

                Net income applicable to common stock x 100 =20 x100=16% or 10.4%
                Common stockholder’s equity                 125 (excluding other income)

        It is another summary measure of overall firm performance is return on equity. Return on equity
(ROE) compares net profit after taxes (minus preferred stock dividends, if any) to the equity that
shareholders have invested in the firm.

         The ratio tells us the earning power on shareholders ‘ book value investment and is frequently
used in comparing two or more firms in an industry. A high return on equity often reflects the firm’s
acceptance of strong investment opportunities and effective expensive management.However, if the
firm has chosen to employ a level of debt that is high by industry standards, a high ROE might simply
be the result of assuming excessive financial risk.

          With all of the profitability ratios discussed, comparing one company to similar companies and
industry standards is extremely valuable. Only by comparisons are we able to judge whether the
profitability of a particular company is good or bad, and why? Absolute figures provide some insight,
but it is relative performance that is most revealing.

               If there are two types of Shareholders, the net income applicable to common stock = net
income – preferred dividend requirement; and common Stockholders’ equity = total stockholders’
equity – preferred stock equity at issue price – dividend arrears, if any.

                 The shareholders would like to see if this rate is higher than rate of interest paid to long-
term creditors or rate of dividend paid to preferred stockholders? If return on equity falls below the rate
of interest, it is unfavorable from the viewpoint of common stockholders.

ii) Earning per share of common stock =Net income applicable to common shareholders
                                          Number of common shares outstanding

= 20                          =Rs.16 or 13 = Rs.10.4 (excluding other income)
  1.25 (each share of Rs.100)         1.25

                Decline in EPS is generally followed by decline in market value of common shares
though not necessarily to the same extent or percentage. EPS is applied to common stock. Preferred
shares have fixed dividends.

Before we move on, you should note that there are three types of EPS numbers:

Trailing EPS – last year’s numbers and the only actual EPS
Current EPS – this year’s numbers, which are still projections
Forward EPS – future numbers, which are obviously projections


                            Copyright© Virtual University of Pakistan                                    138
Financial Statement Analysis-FIN621                                                                      VU

        iv)      Price-earning ratio (P/E) = Market price/share
                                            Earning/share

Companies with record of rapid growth have P/E           ratio of 20 to 1 or even higher.

What does P/E tell you? The P/E gives you an idea of what the market is willing to pay for the
company’s earnings. The higher the P/E the more the market is willing to pay for the company’s
earnings. Some investors read a high P/E as an overpriced stock and that may be the case, however it
can also indicate the market has high hopes for this stock’s future and has bid up the price.

Conversely, a low P/E may indicate a “vote of no confidence” by the market or it could mean this is a
sleeper that the market has overlooked. Known as value stocks, many investors made their fortunes
spotting these “diamonds in the rough” before the rest of the market discovered their true worth.

What is the “right” P/E? There is no correct answer to this question, because part of the answer depends
on your willingness to pay for earnings. The more you are willing to pay, which means you believe the
company has good long term prospects over and above its current position, the higher the “right” P/E is
for that particular stock in your decision-making process. Another investor may not see the same value
and think your “right” P/E is all wrong.

        iv)   Dividend Yield

            Some stockholders invest primarily to receive regular cash income in the form of dividends.
Others do so to secure capital gains through rising market price of common stock.

        Dividend yield = Dividend per share x 100) %
                         Market price per share

Dividend Yield is anticipated annual dividend divided by the market price of the stock.

Date              Market price     EPS    P/E       Dividend       Dividend
                 per share                          ratio    per share    yield

----             ---------------   ------- ------    ------------ -----------

31.12.93       160                          20.25    8              5           3.1

31.12.94       132                          13.2    10              4.8         3.6


The dividend yield on a company stock is the company's annual dividend payments divided by its
market cap, or the dividend per share divided by the price per share. It's often expressed as a percentage.

Preferred share dividend yield

Since payment of the dividend is stipulated by the prospectus, owners of preferred shares calculate
multiple yields to reflect the different possible outcomes over the life of the security. Be aware that
these yields will be different from the company's point of view. The company will continue to call their
security (e.g.) a 6%--- when the stated dividend is 6% of the issue price of the share.
•       Current yield is the $Dividend / Pfd share current price.
•       Since the share may be purchased at a lower (higher) cost than its final redemption value,
holding it to maturity will result in a capital gain (loss). The annualized rate of gain is calculated using
the Present value of a dollar calculation. ('PV' is the current stock price. 'FV' is the redemption value. 'n'


                             Copyright© Virtual University of Pakistan                                   139
Financial Statement Analysis-FIN621                                                                     VU

is the number of years to redemption. Solve for the interest rate 'r'.) The yield to maturity is the sum of
this annualized gain (loss) and the current yield.

Common share dividend yield

Unlike preferred stock, there is no stipulated dividend for common stock. Instead, dividends paid to
holders of common stock are set by management, usually in relation to the company's earnings. There is
no guarantee that future dividends will match past dividends or even be paid at all. Due to the difficulty
in accurately forecasting future dividends, the most commonly-cited figure for dividend yield is the
current yield which is calculated using the following formula:

Current dividend yield = most recent full -year dividend
                              Current share price

For example, take a company which paid dividends totaling $1 last year and whose shares currently sell
for $20. Its dividend yield would be calculated as follows

                                  = $1/$20
                                  =0.05
                                  =5%

Rather than use last year's dividend, some try to estimate what the next year's dividend will be and use
this as the basis of a future dividend yield. It should be noted that estimates of future dividend yields are
by definition uncertain

Dividend Pay out Ratio:

Annual cash dividends divided by annual earnings: or alternatively, dividends per share divided by
earning per share. The ratio indicates the percentage of a company’s earnings that is paid out to
shareholders in cash.

Understanding Dividend Payout Ratio

The Dividend Payout Ratio (DPR) is one of those numbers. It almost seems like a measurement
invented because it looked like it was important, but nobody can really agree on why.

The DPR (it usually doesn’t even warrant a capitalized abbreviation) measures what a company’s pays
out to investors in the form of dividends.

You calculate the DPR by dividing the annual dividends per share by the Earnings Per Share.

DPR = Dividends per Share / EPS

For example, if a company paid out $1 per share in annual dividends and had $3 in EPS, the DPR would
be 33%. ($1 / $3 = 33%)

The real question is whether 33% is good or bad and that is subject to interpretation.

Growing companies will typically retain more profits to fund growth and pay lower or no dividends.
Companies that pay higher dividends may be in mature industries where there is little room for growth
and paying higher dividends is the best use of profits (utilities used to fall into this group, although in
recent years many of them have been diversifying).


                            Copyright© Virtual University of Pakistan                                   140
Financial Statement Analysis-FIN621                                                        VU

Either way, you must view the whole DPR issue in the context of the company and its industry. By
itself, it tells you very little.


                        Copyright© Virtual University of Pakistan                           141
Financial Statement Analysis-FIN621                                                                    VU

                                                                                                Lesson-38
                                          PROFITABILITY RATIOS
                                                (Continued)

        d)      Analysis by Preferred Stockholders

                  If convertible, interest of preferred stockholders is similar to those of common one. If
not, then their interest is similar to that of long-term creditors.

Dividend Coverage Ratio: =        Net income                       .
                                  Amount of annual preferred dividend

                                                                              Normal Ratio: 5 to 10

Note:     Ratios should be used with other elements of financial analysis. Most important is to use
common sense and judgments. Also study the industrial sector in which the company operates and relate
“Industry Sector” climate to current and projected economic developments.

Analysis by management:

 The main concern of management is to watch the interest of all those who have provided capital to the
business. For this, it has to ensure efficient use of capital and resources employed. To watch the interests
and needs of customers and clients, the management has to take care of profitability, solvency and long-
term stability of the business. It would see as to which operating areas have contributed to success and
which have not? It would also determine strengths and weaknesses and reasons thereof. It would also
take appropriate measures for improvement and correction.

Indicators of profitability:

                   Difference between Profit and Profitability. Profit is an absolute figure whereas
profitability is ratio of profit to some other item like sales.

   (i) Return on total assets = Operating income x 100        = 25 x 10 = 12.5 %
                                  Average assets                    200

                Operating income is used, since interest and income taxes are factors beyond control of
management. Also since operating income is earned throughout the year, we relate it to average
investment in assets.

Return on Total Assets (ROTA). A measure of how effectively a company uses its assets. Calculated
by (income before interest and tax) / (fixed assets + current assets).

Importance of Return on Total Assets:

Smart companies strictly control major purchases, attempting to limit those that will best bring a return
in greater revenue to the company. The Return on Total Assets is a useful way to measure how well the
company is actually able to make intelligent choices on how to spend its money on new assets.

        ii) Return on Investment = Operating income                            = 25 x 100 = 14.3%
                 (Total Assets) Stockholders equity + fixed liabilities (1)    175

    Measures overall effectiveness in generating profits with available assets ; earning power of
invested capital


                           Copyright© Virtual University of Pakistan                                   142
Financial Statement Analysis-FIN621                                                                 VU

Return on Investment (ROI) analysis is one of several approaches to building a financial business case.
The term means that decision makers evaluate the investment by comparing the magnitude and timing
of expected gains to the investment costs.

Decision makers will also look for ways to improve ROI by reducing costs, increasing gains, or
accelerating gains.

In the last few decades, this approach has been applied to asset purchase decisions (computer systems or
a fleet of vehicles, for example), "go/no-go" decisions for programs of all kinds (including marketing
programs, recruiting programs, and training programs), and to more traditional investment decisions
(such as the management of stock portfolios or the use of venture capital

The Simple Return on Investment

Return on investment is frequently derived as the “return” (incremental gain) from an action divided by
the cost of that action. That is “simple ROI”. For example, what is the ROI for a new marketing
program that is expected to cost $500,000 over the next five years and deliver an additional $700,000 in
increased profits during the same time?


Simple ROI = Gains – Investments costs
               Investments Costs

Simple ROI works well in situations where both the gains and the costs of an investment are easily
known and where they clearly result from the action. Other things being equal, the investment with the
higher ROI is the better investment. The return on investment metric itself, however, says nothing about
the magnitude of returns or risks in the investment.

In complex business settings, however, it is not always easy to match specific returns (such as increased
profits) with the specific costs that bring them, and this makes ROI less trustworthy as a guide for
decision support. Simple ROI also becomes less trustworthy as a useful metric when the cost figures
include allocated or indirect costs, which are probably not caused directly by the action or the
investment.

Business investments typically involve financial consequences extending several years or more. In such
cases, the metric has meaning only when the time period is clearly stated. Shorter or longer time periods
may produce quite different ROI figures for the same investment. When financial impacts extend across
several years, moreover, the analyst must decide whether to use discounted (net present value) figures or
non discounted values.


                           Copyright© Virtual University of Pakistan                                143
Financial Statement Analysis-FIN621                                                                       VU

Return on Sales Ratio

What it is?

This ratio compares after tax profit to sales. It can help you determine if you are making enough of a
return on your sales effort.

When to use it?

If your company is experiencing a cash flow crunch, it could be because its mark-up is not enough to
cover expenses. Return on sales can help point this out, and allow you to adjust prices for an adequate
profit. Also, be sure to look for trends in this figure. If it appears to be dropping over time, it could be a
signal that you will soon be experiencing financial problems.


         iii)Return on Sales = Net income x 100 = 20% or 13%
                           Net sales

A ratio widely used to evaluate a company's operational efficiency. ROS is also known as a firm's
"operating profit margin".

This measure is helpful to management, providing insight into how much profit is being produced per
dollar of sales. As with many ratios, it is best to compare a company's ROS over time to look for trends,
and compare it to other companies in the industry. An increasing ROS indicates the company is growing
more efficient, while a decreasing ROS could signal looming financial troubles.

 iv)    Assets turn over ratio:

It shows relative effectiveness of assets utilization =    Net Sales      = 50%
                                                             Average assets

Measures relative Efficiency of total assets to generate sales.

Asset turnover measures how effectively a business is using assets to generate sales. It is:

Sales ÷assets

There are a few variations on this, depending on what measure of assets is used. The most obvious is
total assets, i.e., fixed assets + current assets. This measures how many pounds in sales is generated for
each pound invested in assets.

From an investor's point of view, it can be argued that current liabilities should be deducted from the
amount of assets used. Investors are concerned with returns on their investment; therefore the funding of
current assets from current liabilities can be ignored.

Note: Current liabilities are excluded while calculating Return on Investment, since these are not
“investments”. As such ROI is a measure of management’s skill in exploiting moneys invested in the
business. Hence “Operating Income” is taken i.e. Income before non-operating expenses and taxes.


                            Copyright© Virtual University of Pakistan                                      144
Financial Statement Analysis-FIN621                                                                     VU

                                                                                               Lesson-39
                                                 OPERATING CYCLE

Efficiency of operating cycle/process:        It is determined by activity ratios, keeping in view the
conversion process, which is as follows:-

     Cash/assets ---- → Inventory ----→ Receivables ---- → Cash
                  Processing       Sales,         collection

     Operating Cycle=Inventory sale days (average) +Receivable Collection days (average).


 The shorter the operating cycle, the higher the quality of current assets and the greater the efficiency of
management.

             Managing Accounts Receivable: The business offers cash discount (2/10, n/30) to
encourage early payment or “factors” Receivables i.e. selling Receivables to a financial institution
(factor).

Cash Cycle

The length of time from the actual outlay of cash for purchases until the collection of receivables
resulting from the sale of goods or services

Current assets (1) are in the form of cash, (2) will be realized in cash, or (3) conserve the use of cash
with in the operating cycle of a business or one year, whichever is longer.
The five categories of assets usually found in current assets, listed in their order of liquidity, include
cash, marketable securities, receivables, inventories, and prepayments.

The operating cycle for a company is the time period between the acquisition of goods and the final cash
realization resulting from sales and subsequent collections. For example, a food store purchases
inventory and then sells the inventory for cash. The relatively short time that the inventory remains an
asset of the food store represents a very short operating cycle. In another example, a car manufacturer
purchases materials and then uses Labour and overhead to convert these materials into a finished car. A
dealer buys the car on credit and then pays the manufacturer. Compared to the food store, the car
manufacturer has a much longer operating cycle, but it is still less than a year. Only a few businesses
have an operating cycle longer than a year.

Cash is a medium of exchange that a bank will accept for deposit and a creditor will accept for
payment. To be classified as a current asset, cash must be free from any restrictions that would prevent
its deposit or use to pay creditors classified as current. If restricted for specific-short term creditors,
many firms still classify this cash under current assets, but they disclose the restrictions. Cash restricted
for short-term creditors should be eliminated along with the related amount of short-term debt when
determining the short term debt-paying ability. Cash should be available to pay general short-term
creditors to be considered as part of the firm’s short-term debt-paying ability.

Marketable securities

The business entity has varying cash needs throughout the year. Because an inferred cost arises from
keeping money available, management does not want to keep all of the entity’s cash need s in the form
of cash through the year. The available alternative turns some of the cash into productive use through
short-term investments (marketable securities) which can be converted into cash as the need arises.


                            Copyright© Virtual University of Pakistan                                   145
Financial Statement Analysis-FIN621                                                                     VU

To qualify as a marketable security, the investment must be readily marketable, and it must be the intent
of management to convert the investment to cash within the operating cycle or one year, whichever is
longer. The key element of this test is managerial intent.

It is to management advantage to show investments under marketable securities, instead of long-term
investments, because this classification improves the liquidity appearance of the firm. When the same
securities are carried as marketable securities year after year, they are likely held for a business purpose.
For example, the other company may be a major supplier or customer of the firm being analyzed. The
firm would not want to sell these securities to pay short-term creditors. Therefore, to be conservative, it
is better to reclassify them as investments for analysis purposes.

Investments classified as marketable securities should be temporary. Examples of market able securities
include treasury bills, short-term notes of corporations, government bonds, corporate bonds, preferred
stock, and common stock. Investments in preferred stock and common stock are referred to as
marketable equity securities.

Receivables

An entity usually has a number of claims to future inflows of cash. These claims are usually classified
as accounts receivable and notes receivable on the financial statements. the primary claim that that most
entities have comes from the selling of merchandise or services on account to customers, referred to as
trade receivables, with the customer promising to pay within a limited period of time, such as 30 days.
The common characteristic of receivables is that the company expects to receive cash some time in the
future. This causes two valuation problems. First, a period of time must pass before the receivable can
be collected, so the entity incurs costs for the use of these funds. Second collection may not be made.

Inventories

Inventor is often the most significant asset in determining the short-term debt paying ability of an entity.
Often the inventory account is more than half of the total current assets. Because of the significance of
inventories, a special effort should be made to analyze properly this important area.

To be classified as inventory, the asset should be for sale in the ordinary course of business, or used or
consumed in the production of goods. A trading concern purchases merchandise in a form to sell to
customers. Inventories of a trading concern, whether wholesale or retail, usually appear in one inventory
account (merchandise inventory). A manufacturing concern produces goods to be sold. Inventories of a
manufacturing concern are normally classified in three distinct inventory accounts, inventory available
to use in production (raw materials), Inventory in production ( work in process), and inventory
completed (Finished goods)

Determining Valuation and liquidity is a fairly complicated problem when analyzing inventories. The
basic approach to the valuation of inventory uses cost. The cost figure is often difficult to determine,
especially when dealing with manufacturing inventory. because of the concept of conservatism, the cost
figure may not be acceptable if it can not be recovered. Therefore if the market figure is below cost the
inventory is reduced to market. Inventory is stated at lower of cost or market on the financial statements

Example No.1

Balance sheet of a business.

Assets                                    Liabilities & stockholders’ equity.

Current Assets.                           Current liabilities
(37%) 31,629,714                                            15,387,428          (18%)

                            Copyright© Virtual University of Pakistan                                   146
Financial Statement Analysis-FIN621                                              VU

(Includes subscription receivable               long-term liabilities   (12%)
 Rs.7, 200,000                                          10,258,286

Fixed Assets                                Stockholders’ equity
                                                       59,840,000        (70%)

(63%)    53,856,000

Total:    85,485,714                Total            85,485,714
          ========                                    =======


                          Copyright© Virtual University of Pakistan              147
Financial Statement Analysis-FIN621                                                                  VU

                                                                                               Lesson-40

            STOCKHOLDERS’ EQUITY SECTION OF THE BALANCE SHEET

Stockholders’ equity

Rs.6 preferred stock, Rs.100 par value, callable at 102,                           Rs.102, 200,000
    Shared authorized                                                              Rs. 12, 000,000

Common stock Rs.5 par value, 5,000,000 shares authorized:
       Issued                                               Rs.10, 000,000
      Subscribed                                          Rs. 4,000,000

                                                                                    Rs. 14,000,000

Additional paid-in-capital:

       Preferred                                          Rs.360, 000
       Common (including subscribed shares)            30,800,000
                                                                               Rs. 31,160,000
Retained earnings                                                              Rs. 2,680,000
    Total stockholders’ equity                                                 Rs.59, 840,000

I) No of preferred shares issued

                                              = Rs.12, 000,000(total par value) = 120,000 shares
                                                Rs.100 (par value per share)

II) Annual divided requirement on outstanding preferred stock =

                                                   120,000 (no of shares) x 6(dividend per share)
                                                    = Rs.720, 000


III) Common shares issued and subscribed

          = Rs.14, 000,000 (total par value) = 2,800,000 shares.
            Rs.5 (par value per share)

IV) Average price per common share received by the business

          = 14,000,000(total par value)+ 30,800,000 (additional paid-in-capital)
            2,800,000 (shares issued and subscribed)

          = 44,800,000 = Rs.16
             2,800,000

v)        Amount per common share due from subscribes
          = 7,200,000 (subscription receivable) = Rs.9
              800,000 shares subscribed

i.e.      4,000,000 per value of subscribed shares = 800,000
                  5, par value of share

                            Copyright© Virtual University of Pakistan                                148
Financial Statement Analysis-FIN621                                                          VU

  v)    Total legal capital = 12,000,000 (preferred) +14,000,000 (common) = Rs.26, 000,000

vii)    Total paid-in-capital = Total legal capital + additional paid-in-capital.

                      = 26,000,000 + 31,160,000

                               = 57,160,000

viii)   Book value per common share = Common stock equity
                                        Total common share

        = Total stockholders’ equity – claim of preferred stockholders at callable price
                                        2,800,000

        = 59,840,000 – (120,000 shares x 102 callable price)
                           2,800,000

        = 59,840,000 – 12,240,000
            2,800,000

        = 47,600,000/2,800,000

        = Rs.17


                           Copyright© Virtual University of Pakistan                         149
Financial Statement Analysis-FIN621                                                                      VU

                                                                                                 Lesson-41

           STOCKHOLDERS’ EQUITY SECTION OF THE BALANCE SHEET
                                             (Continued)


Example No:2


MOOSA CORPORATION
Balance Sheet as on June 30, ________

                                                                2006                            2005
Cash                                                           35,000                 25,000
Accounts receivable (net)                                      91,000                 90,000
Inventory                                                   160,000                     140,000
Short-term prepayments                                 4,000                 5,000
Investment in land                                            90,000                     100,000
Equipment                                                   880,000                     640,000
Less: Accumulated depreciation                           (260,000)                   (200,000)
Total assets                                            Rs.1, 000,000                 Rs.800, 000
                                                              ======                     =======


                                                               2005-06          2004-05


Accounts payable                                           Rs.105, 000         Rs.46, 000

Income taxes payable and
Other accrued liabilities                             40,000                          25,000

Bonds payable – 8%                                             280,000               280,000

Premium on bonds payable                                         3,600                 4,000

Capital stock Rs.5 par                                         165,000                         110,000

Retained earnings                                              406,400               335,000

Total liabilities and stockholders’ equity
                                                       Rs.1, 000,000           Rs.800, 000


MOOSA CORPORATION
Income Statement for the year

                                                                   2005-06                  2004-05

                            Copyright© Virtual University of Pakistan                                    150
Financial Statement Analysis-FIN621                                                         VU


Sales (net of discount and allowances)                Rs.2, 200,000     Rs.1, 600,000
Cost of goods sold                                           1,606,000           1,120,000
Gross profit on sales                                     Rs. 594,000         Rs. 480,000
Expenses (including Rs.22, 400 Interest expense)           (336,600)                (352,000)
Income taxes                                                   (91,000)              (48,000)
                                                              ________              ________
Net income                                                  Rs.166, 400             Rs.80, 000
                                                             ========               =======


                                                          2005-06                     2004-05
1. Quick ratio:
  Rs.126, 000 ÷Rs.145, 000                                0.9 to 1
       Rs.115, 000 ÷ Rs.71, 000                                                       1.6 to 1

2.     Current ratio:
       Rs.290, 000 ÷Rs.145, 000                             2 to 1
       Rs.260, 000 ÷Rs.71, 000                                                        3.7 to 1

3.     Equity ratio:
       Rs.571,400 ÷ Rs.1,000,000                            57%
       Rs.445,000 ÷ Rs.800,000                                                           56%

4.     Debt ratio:
       Rs.428,600 ÷ Rs.1,000,000                             43%
       Rs.355,000 ÷ Rs.800,000                                                           44%


                          Copyright© Virtual University of Pakistan                         151
Financial Statement Analysis-FIN621                                                                      VU

                                                                                                    Lesson-42
                 BALANCE SHEET AND INCOME STATEMENT RATIOS

                                                                  2005-06                           2004-05


5.      Gross profit percentage:
        Rs.594, 000 ÷ Rs.2, 200,000                                         27%
        Rs.480, 000 ÷Rs.1, 600,000                                                                    30%

6.      Operating expense ratio:
        Rs.336, 600 – Rs.22, 400 ÷Rs.2, 200,000                   14%
        Rs.352, 000 – Rs.22, 400 ÷Rs.1.600, 000                                                      20.6%

7.      Net income as a percentage of net sales:
        Rs.166, 400 ÷ Rs.2, 200,000                                         7.6%
        Rs.80, 000 ÷ Rs.1, 600,000                                                                     5%

8.      Inventory turnover (Assume arrange inventory of Rs.150, 000 for both years)

        = 1,606,000 ÷ 150,000                                  10.7 times

          1,120,000 ÷ 150,000                                                           7.5 times


9.       Accounts Receivable turnover
        (Assume average accounts receivable Rs.90, 000 for       (2004-05)

        = 2,200,000 ÷90,500                               24.3 times
          1,600,000 ÷90,000                               17.8 times

10. Length of operating cycle (Assume 360 working days)

     = 360 + 360 = 34+15                                  49
       10.7 24.3

       360 + 360 = 48 + 20                                68
       7.5 17.8

                                          Summary of Ratios

1. Percentage Gross Profit on Turnover = (Gross Profit) / (Sales) x 100.

2. Percentage Gross Profit on Cost of Sales = (Gross Profit) / (Cost of Sales) x 100.

3. Percentage Net Income on Turnover = (Net Income) / (Sales) x 100.

4. Percentage Total Expenses on Turnover = (Total Expenses) / (Sales) x 100.

5. Percentage Operating Profit on Turnover = (Operating profit) / (Sales) x 100.

6. Percentage Operating Profit on Cost of Sales = (Operating Profit) / (Cost of Sales) x 100.

                             Copyright© Virtual University of Pakistan                                   152
Financial Statement Analysis-FIN621                                                                   VU

7. Net Assets = (Total Assets) - (Total Liabilities).

8. Solvency Ratio = (Total Assets) / (Total Liabilities).

9. Net Current Assets = (Current Assets) - (Current Liabilities).

10. Current Ratio = (Current Assets) / (Current Liabilities).

11. Acid-Test Ratio = (Liquid Assets) / (Current Liabilities).

12. Rate of Stock Turnover = (Cost of Sales) / (Average Stock).

13. Period for which Ample Stock is on Hand = (Average Stock) / (Cost of Sales) x (365 days or 12
months).

14. Debtors Average Collection Period = (Average Debtors) / (Credit Sales) x (365 days or 12 months).

15. Creditors Average Payment Period = (Average Creditors) / (Credit Purchases) x (365 days or 12
months).

16. Debt/Equity Ratio = (Total Liabilities) / (Shareholders Equity). This is also known as Risk or
Gearing, the extent to which a company is financed by borrowed funds; for example, if a company is
highly geared, it borrows a lot.

17. Return on Total Capital Employed = ((Net Profit before Tax)+(Interest on Loan)) / (Average Capital
Employed) x 100.

18. Return on Shareholders' Equity = (Net Profit after Tax) / (Average Shareholders' Equity) x 100.

19. Earnings per Share = (Net Profit after Tax) / (Number of Shares Issued) x 100.

20. Dividends per Share = (Dividends on Ordinary Shares) / (Number of Shares Issued) x 100.

21. Net Asset Value per Share = (Shareholders' Equity) / (Number of Shares Issued) x 100.

22. Net Profit before Tax on Turnover = (Net Profit before Tax) / (Turnover) x 100.


                            Copyright© Virtual University of Pakistan                                 153
Financial Statement Analysis-FIN621                                                                   VU

                                                                                                Lesson-43
                                            CASE STUDY
Assumption

                 The company you have chosen has hired you as a financial consultant.

Assignment

               Based on your analysis of the firm’s financial statements and any relevant
supplementary information you can obtain about the firm and its operating environment, identify areas
in which the company is performing well (strengths) and problem areas (weaknesses); Also advise
management of corrective measures for improvement.

Data

                 The time period for the analysis should include five full years or four years plus interim
statements for the most recent year. In addition to the financial statements and other material in the
annual reports, you should review relevant materials from outside sources such as newspapers,
periodicals and investment resources.

Outline

                 The following outline is provided for guidance, but the analysis should be adjusted, as
appropriate, to conform to the individual characteristics of the firm.

                 Suggested Outline for the Financial Statement Analysis

          I.     Introduction
                 A.       Objective of paper
                 B.       Summary of Findings

          II.    Firm, Industry, and Environment

                 A.      Description of firm and its management
                 B.      Discussion of competitive environment
                 C.      Economic climate and outlook
                 D.      Other factors, e.g. governmental regulations, Labour relations,
                         Litigations.

          III.   Evaluation of Financial Statements
                 A.      Overview
                 B.      Short-term liquidity
                 C.      Operating efficiency
                 D.      Capital structure and long-term solvency
                 E.      Profitability
                 F.      Market measures

          IV.    Outlook, Summary, and Conclusions
                 A.     Outlook for performance, earnings projection
                 B.     Summary and Conclusions

Table-1
                                     XYZ                          SUGAR                            MILLS


                           Copyright© Virtual University of Pakistan                                  154
Financial Statement Analysis-FIN621                                                                     VU

                       BALANCE          SHEET            AS        ON   JUNE        30,                      .

                                                                                    Rs. in million
Year                                   1977                             1978         1979       1980
CAPITAL & LIABILITIES
Owners’ equity
Original Investment by the Controlling 10                               10           10          10
Corporation (CC)
Current A/C with CC                    55                               59           65          71
Total equity                           65                               69           75          81
Less accumulated losses                66                               82           94          114
Net equity                             (1)                              (13)         (19)        (33)

Current Liabilities

                                   1977               1978                   1979           1980
Short-term borrowing                    25            26                     29             37
Trade creditors (liabilities for          7           12                     11             4
expenses)
Liabilities for other finances 8                      17                     13             10

                                   40                 55                     53             51
Fixed Liabilities
Long-term loans                    10                 13                     15             20
Total capital & Liabilities        49                 55                     49             38

Assets

Fixed assets                                  16              15             14             14
Current assets
- Cash                                        5               4              3              2
-Receivable from Bibo                         12              13             15             17
-Other Receivables                            2               2              3              3
-Pre-paid                                     1               1              1              1
- Inventory                                   13              20             13             1
Total current assets                          33              40             35             24
Total Assets                                  49              55             49             38


ANALYSIS OF BALANCE SHEET

No.      Table Data/Facts                          Findings

                            Copyright© Virtual University of Pakistan                                   155
Financial Statement Analysis-FIN621                                                              VU

1      1     Balance Sheets for the      •      Accumulated losses (Rs.114 million as at   June
             year 1976-80                      30, 1980)
                                         •     Constantly losing enterprise.
2      2     Accumulated        losses   •     Losses increasing over the years.
             over the period.

3      1     Balance Sheet               a) Capital cost of the project was Rs.26     million,
                                             met through:
                                         - Equity Fund from CC Rs.10 million.
                                         - Loans from CC: Rs.16 million
                                         b) “Current account with “CC” comprises, funds
                                             given by CC over the years as working capital.
                                         c) Total equity as on 30.06.1980
                                           = Rs.81 million.
                                         d) Equity completely eroded by accumulated loss of
                                             Rs.114 million.
                                         e) Equity eroded since 1976-77


 4     1      Borrowing      (short-         a) Increased from Rs.35 million in 1976-77 to
              term & long term)                 Rs.57 million in 1979-80.
                                             b) Debt burden increasing because of unit’s
                                                inability to repay the principal owing to
                                                persistent losses.
                                             c) Vicious circle.
                                             d) Huge financial charges (Rs.8 million during
                                                1979-80)


                       Copyright© Virtual University of Pakistan                                  156
Financial Statement Analysis-FIN621                                                                VU

                                                                                            Lesson-44
              ANALYSIS OF BALANCE SHEET & INCOME STATEMENT


 5       1      Fixed Assets                 a) Decreasing.
                                             b) No depreciation reserve (unable to replace old
                                                assets out of its own resources).

 6       1      Current Assets:              •   Bibo had made counter claims
                                             •   These are doubtful debts.
              m Bibo:Rs.17 m                 •   No provision for bad debts.
                                             •   Liquidity overstated.
                -Book debt            =      •   Interest      treated     as      miscellaneous
                Rs.6.71 m                        Income.
                 on 30.06.72                 •   Treating interest as misc. income understated
                                                 operating losses by Rs.10.29 million.
                -Interest over the=          •   Accumulated loss rises from 114 million to 124
                Rs.10.29 m                       million.
                 period 1972-80

                ____
                                 17
                m
 7       1      Other Receivables            •   Loans given to cane growers.
                                             •   Aging detail.
                                             •   Loans of Rs.0.5 million outstanding for 6-10
                                                 years.
                                             •   Doubtful/bad loans.
                                             •   No provision.
                                             •   Liquidity overstated.

 8       3      Liquidity                    •   Current and quick ratios.
                                             •   Poor liquidity.
                                             •   Actual ratios much lower in view of doubtful
                                                 debts.
                                             •   Cannot repay its current obligations.


                                               Table-2
                                          ACCUMULATED LOSS
                                                                                 Rs. in million

At the end of year                   1976-77          1977-78       1978-79       1979-80
Loss for the year                    9.5              16.0          12.03         19.8
Accumulated loss                     66.0             82.0          94.3          114.1
% increase in accumulated loss                        24%           43%           73%
over base year (1976-77)


                            Copyright© Virtual University of Pakistan                              157
Financial Statement Analysis-FIN621                                                                          VU

                                                  Table-3
                                         CURRENT AND QUICK RATIOS
                                                                                            Rs. in million
Year end June 30                           1977      1978            1979                 1980
Current assets                             33        40              35                   24
Current assets less inventory & pre- 19              19              21                   22
paid
Current liabilities                  40              55              53                   51

Current ratio                              0.8:1     0.7:1           0.6:1                0.5:1
Quick ratio                                0.5:1     0.3:1           0.3:1                0.4:1

Table-4

                                             XYZ SUGAR MILLS
                                         PROFIT AND LOSS ACCOUNT

                                                                                Rs. in thousands
Year               1976-77                 1977-78           1978-79                1979-80
Sales              58,000           %      52,000    %       42,000       %        20,000         %
Cost of Sales
Cane, carriage & 35,000             60     38,000    73      24,000       57       16,000         80
incidentals
Salaries & Wages 6,000              10     7,000     13      6,000        14       6,000          30

Excise duty        15,000           26     11,000    21      11,000       26       2,000          10
Depreciation       1,000            2      1,000     2       800          2        800            4
Others             3,000            5      3,400     7       3,000        7        2,000          10
Total:             60,000           103    60,400    116     44,800       106      26,800         134
Gross Profit (loss) (2,000)         3      (8,400)   16      (2,800)      6        (6,800)        34


Operating & non-operating expenses


Admin & selling    3,000        5         3,000      5     4,000          10      5,000               25
Financial          4,500        8         4,600      9     5,500          13      8,000        40
Total:             7,500        13        7,600      14    9,500          23      13,000       65
Operating (loss)   (9,500)      16        (16,000)   30    (12,300)       29      (19,800)     99


                              Copyright© Virtual University of Pakistan                                      158
Financial Statement Analysis-FIN621                                                                     VU


‘Others’ consist of:

        -       Cloth & packing material

        -       Stores & Spares

        -       Insurance


ANALYSIS OF PROFIT & LOSS ACCOUNT


No.    DATA/FACTS/DOCUMENTS                          FINDING
1.    Table-4 Profit & Loss Accounts                   •    Bottom line figures: operating losses.
                                                       •    Never made profit.
2.    Table-4          -do-                            •    Various costs as % of sales.
                                                       •    Constantly reducing sales.
3.    Table-5 Production and capacity                  •    Reduced sugar production.
              Utilization.                             •    Below capacity utilization.
4.    Non availability of cane; feasibility report     •    Erroneous assumption in PC 1

5.    Table-6 Sugarcane procured locally               •    Only 5 to 44% of plant’s requirement (of
                                                            185,000 tons) met locally.
6.    Table-7 Total procurement of cane.               •    Cane crushing capacity = 1500 tons/day
                                                            normal crushing season = 120 days.
                                                       •    Full requirement of cane never met.
                                                       •    During 1979-80, growers switched to
                                                            turmeric, they also preferred gurmaking
                                                            due to its high price.

7     Table-8 Area-wise           procurement of       •     Between 42% to 60% cane brought from
      sugar-cane                                            far-off places.
                                                       •    Result     was    excessive  cost    of
                                                            transportation, drying up of cane (less
                                                            recovery percentage).

8     Table-9 Cost of transportation                       9% to 14% of cost of cane.

9     Table-10 Per ton cost of                         •    Between Rs.15 to 21.
               transportation.                         •    Double the cost of other factories.
10    Table-4 P&L Account                              •    High percentage of sale revenues.
              Cane, Chemical and                       •    Include increased cost of transportation.
              incidentals.

11    Table-4 Salaries, Wages and                      •    Constantly increasing as % of sales.
              benefits.                                •    Heavy fixed cost due to:
                                                            - normal increases.
                                                            - increase in employee strength.

                            Copyright© Virtual University of Pakistan                                   159
Financial Statement Analysis-FIN621                                                                  VU


12     Table-11 Employees strength                     •   53-73% over PC1 strength/seasonal staff
                                                           as routine.

13     Table-12 Cost of establishment                  • Very high due to:-
                per ton of sugar produced             - excess employees.
                                                      - reduced production.


14     Table-13 Productivity per employee              •   Decreasing.


15     Table-4 Administrative expenses                 •   Increasing as % of sales.
                                                       •   Excess employee strength.


16     Table-4 Financial expenses                      •    Increasing as % of sales
       Table-14                                            (range: 8% to 40%)
                                                       •    Why? Because of increased debt burden,
                                                            and Unit’s inability to pay owing to
                                                            persisting losses: vicious circle.


                                         Table-5
                               PRODUCTION AND CAPACITY UTILISATION
                                                                                       TONS

                            1976-77         1977-78        1978-79        1979-80


Cane crushing capacity      185,000         185,000        185,000             185,000


Cane crushed                140,292         166,271        93,931         14,375


Capacity utilization        76%             90%            51%            8%


Sugar produced              11.344          14,015         8,007          1,206


% recovery                  8.08%           8.43%          8.55%          8.38%


Table-6
             PROCUREMENT OF SUGAR CANE LOCALLY

                                      1976-77              1977-78       1978-79       1979-80


                          Copyright© Virtual University of Pakistan                                  160
Financial Statement Analysis-FIN621                                                              VU

Quality procured (Tons)               81,444           81,367      37,857         8,392


Procurement as        %    of     total 44%            44%         20%            5%
requirements.


                                            Table-7
                                TOTAL PROCUREMENT OF SUGAR-CANE

                                        1976-77    1977-78         1978-79        1979-80
   •      Cane procured (tons)          140,292    166,271         93,731         14,375
   •      % of requirement
                                        76%     90%      51%                      8%
                                          Table-8
                           AREA-WISE PROCUREMENT OF SUGAR-CANE
                                                                                       TONS
                   1976-77              1977-78          1978-79            1979-80
                   Qty           %      Qty        % Qty               %    Qty            %
 Sugar-cane
produced from

 • Local area      81444        58%     81367     49% 37857        40%      8392          58%

 •A      Distt. 28316           20%     44415     27% 15976        17%      801            6%
  (200km
  North)
                12395            9%     18361     11% 19164        20%       2439         17%
 •B      Distt.
  (150km
  South)        16707           12%     18268     11% 12870        14%      2627          18%

 •C       Area
  (150km East) 1430             1%      3860      2%     7864      9%       116           1%

 •D      Area
  (300km
  West)       140,292 100%              166,271   100% 93,731      100%     14,375        100%

 Total:


                           Copyright© Virtual University of Pakistan                             161
Financial Statement Analysis-FIN621                                                                         VU

                                                                                                       Lesson-45

                                      SUMMARY OF FINDGINS

                                               Table-9
                                      COST OF TRANSPORTATION
                                                                                  Rs. in million
                                      1976-77         1977-78             1978-79      1979-80
Cost of cane purchased                22.26           24.51               13.81            2.60
Carriage & incidentals                2.15            3.48                1.95             0.23
Carriage as % of cost                 10%             14%                 14%              9%

                                              Table-10
                                       PER TON COST OF TRANSPORTATION

                                      1976-77         1977-78             1978-79          1979-80

Carriage and incidentals (Rs. in 2.15                 3.48                1.95             0.23
million)

Cane procured (Tons)                  140,292         166,271             93,731           14,375

Average per ton cost (Rs)             15.32           20.92               20.80            16.00


                                             Table-11
                                        EMPLOYEE STRENGTH
                                             Actual strength during the years

                                As per PC1      1976-77         1977-78          1978-79        1979-80

Permanent                       185             605             625              615            495
Seasonal                        556             639             655              590            638
Total                           741             1244            1280             1205           1133
% increase                                      68%             73%              63 %           53%

Table-12
                         COST OF ESTABLISHMENT

                                       1976-77         1977-78         1978-79             1979-80

Cost (Rs. in million)                  7.72            9.11            8.90                8.51

Sugar produced (tons)                  11344           14015           8007                1206

Cost per ton of sugar (Rs)             681             650             1112                7053


                             Copyright© Virtual University of Pakistan                                      162
Financial Statement Analysis-FIN621                                                          VU

Table-13
                     PRODUCTIVITY PER EMPLOYEE

                                    1976-77        1977-78       1978-79           1979-80
Sugar produced (Tons)               11344          14015         8007              1206
Employee-strength                   1244           1280          1205              1133
Productivity per person (Tons)      9.1            10.9          6.6               1.1

                                         Table-14
                                    FINANCIAL EXPENSES
                                                                     Rs. in million
                                    1976-77        1977-78       1978-79        1979-80
Financial expenses                  4.5            4.6           5.5            8.0
Sales                               58             52            42                20
Financial expenses as % of sales    8%             9%            13%               40%

                                   SUMMARY OF FINDGINS

No.     Area                        Findings
1.      Finance:                        •    Financial position poor
                                        •    Equity eroded
                                        •    Debt burden: Rs.57 m
                                        •    Financial Charges: Rs.8 m
                                        •    Poor Liquidity

2.      Profitability:                 •    Constantly losing.
                                       •    Losses understand.
                                    Reasons:
                                       •    not enough cane
                                       •    high transportation cost.
                                       •    heavy fixed costs.
                                       •    vicious circle of financial charges

3.      Raw Material:                     •   Requires 185,000 tons cane.
                                          •   Cane from local area: 5-44% only.
                                          •   Bringing cane from far off places.
                                          •   erroneous PC1

4.      Production:                       •   sugar production capacity: 15,000 ton
                                          •   Never met target.
                                          •   High fixed cost of production.
5.      Administration:                   •   Excess employees.
                                          •   Excess per ton cost of establishment.
                                          •   Low productivity.


                          Copyright© Virtual University of Pakistan                          163
Financial Statement Analysis-FIN621                                                                 VU


OVERALL ASSESSMENT

1.             The unit has been a losing concern over since 1965 when it became operational.
Accumulated loss as on June 30, 1980 was over Rs.114 million as against equity of Rs.81 million.
Equity thus stood completely eroded. The unit is consequently dependent entirely on debt, which
amounted to Rs.57 million as on June 30, 1980. This involved annual financial charges of Rs.8 million.

2.               The feasibility of this unit had been projected on the clear assurance that abundant
sugar-cane will be available in the vicinity. These assurances proved entirely erroneous. Supplies of
sugar-cane from the vicinity were very inadequate. The company has had to supplement procurement by
additional purchases from distant areas. This involved excessive cost of transportation. Even then the
unit could not manage to procure the required quantity of cane. Below capacity operations of the plant
has, therefore, been a crippling constraint.

3.               A number of steps are being taken at unit and government level to improve sugar-cane
availability. This includes loans to growers for seeds and fertilizers, and award of a higher purchase
price for sugar-cane above the controlled rate. These measures are expected to aid the project but it may
not, however, still be able to overcome its financial difficulties.

4.               The unit could in fact procure only 8% of its cane requirement during 1979-80, of
which only 5% was procured locally, despite award of a higher purchase price for sugar-cane above the
controlled rate. Inadequate cane availability and heavy fixed costs (due to excessive employee-strength
and increasing burden of financial charges) remain serious constraints.

5.               The project therefore does not seem to be a viable one. Prospects of its dis-investment
and privatization may be seriously looked into.


                           Copyright© Virtual University of Pakistan                                164

Financial statement analysis

  • 1.
    Financial Statement Analysis-FIN621 VU Lesson-1 ACCOUNTING & ACCOUNTING PRINCIPLES Accounting Almost every organization and individual maintains accounts and deals with accounting. In simple terms, it can be described as a record of Income and expenditure of a business organization, or budget vs. utilization, in the case of a government non-commercial organization. In the case of the business entity, accounting would deal with measuring, recording and communicating the results of business activities. That is why; Accounting is often called “Language of Business”. Purpose of Accounting Accounting provides decision-makers with sufficient, relevant information to make prudent and intelligent business decisions. This information is provided through accounting reports called financial statements. The whole process is called “financial reporting” • The purpose of accounting is to organize the financial details of business. • To identify the financial transactions. • To organize the financial data into useful information • To measure the value of these information in terms of money • To analyze, interpret, and communicate the information to persons or groups, both inside or outside the business. Financial Statements Generated by a Business A business generates four financial statements at the end of its accounting period:- i) Income statement: shows operational results of business during/over the accounting period. ii) Statement of owners’ equity: showing changes in owner’s equity through profit/additional investment or through losses/drawl by owner. iii) Balance sheet showing financial position at the end of the accounting period i.e. a picture of what the business owns and what it owes. iv) Statement of cash flows giving a picture of cash inflows (receipts) and cash outflows (payments) over/during the accounting period. It is prepared from the two major financial statements viz Income Statement and Balance Sheet. Notes to Financial Statements: In addition to above, notes containing additional information (financial & non- financial) about the business are also attached to financial statements. Accounting Period Accounting period is the period of time covered by an Income Statement. It is usually one year. It can either be calendar year (Jan to Dec) or financial year (July to June). Financial Statements are prepared at the end of accounting period and are the end product of accounting process/cycle. Copyright© Virtual University of Pakistan 1
  • 2.
    Financial Statement Analysis-FIN621 VU Different Types of Business Organizations 1. Sole Proprietorship According to D.W.T. Stafford, “It is the simplest form of business organization, which is owned and controlled by one man” Sole proprietorship is the oldest form of business organization which is owned and controlled by one person. In this business, one man invests his capital himself. He is all in all in doing his business. He enjoys the whole of the profit. The features of sole proprietorship are: • Easy Formation • Unlimited Liability • Ownership • Profit • Management • Easy Dissolution 2. Partnership According to Partnership Act, 1932, “Partnership is the relation between persons who have agreed to share the profits of a business carried on by all or any of them acting for all.” Partnership means a lawful business owned by two or more persons. The profit of the business shared by the partners in agreed ratio. The liability of each partner is unlimited. Small and medium size business activities are performed under this organization. It has the following features: • Legal Entity • Profit and Loss Distribution • Unlimited Liability • Transfer of Rights • Management • Number of Partners 3. Joint Stock Company According to S. E. Thomas, “A company is an incorporated association of persons formed usually for the pursuit of some commercial purposes” A joint stock company is a voluntary association of persons created by law. It has a separate legal entity apart from its members. It can sue and be sued in its name. In the joint stock company, the work of organization begins before its incorporation by promoters and it continues after incorporation. The joint stock company has the following feature: • Creation of Law • Separate Legal Entity • Limited Liability • Transferability of shares • Number of Members • Common Seal Copyright© Virtual University of Pakistan 2
  • 3.
    Financial Statement Analysis-FIN621 VU Generally Accepted Accounting Principles (GAAP) These are ‘Ground rules’ i.e. Principles for preparing financial statements. These are constantly evolving. These embody accounting concepts, measurement techniques and standards of presentation of financial statements. These Accounting Principles enable comparability between various enterprises and of the operational performance of the same enterprise over many years. These give reliability to Financial Statements. Following are some of the Generally Accepted Accounting Principles: i) Entity principle: specific business entity separate from personal affairs of the owner(s). ii) Cost principle: valuation and recording of assets at cost. iii) Going-concern assumption: connected with cost principle, assets acquired for use and not for resale. iv) Objectivity principle: definite, factual basis for assets valuation; measuring transactions objectively. v) Stable currency principle. The currency remains more or less stable and rate of inflation is almost zero. vi) Adequate disclosure concept: facts necessary for proper interpretation of statements; “subsequent events”, lawsuits against the business, assets pledged as securities/collaterals, contingent liabilities etc; reflected in Notes. ACCOUNTING EQUATION ASSETS = LIABILITIES + OWNER’S EQUITY Balance Sheet is based on Accounting Equation. It is in fact, a detailed statement of the Equation. The Equation in a way shows, utilization of Funds and Sources of Funds. In other words, it shows what a business OWNS and what it OWES. Alternately, the Accounting Equation or Balance Sheet is a description of Total Assets of a business against the claimants of these Assets. Therefore, this Equation shows financial position on a specific date. The three titles in the Equation are Elements of Balance Sheet. Similarly Elements of Income Statement would be Revenues & Expenses and their net affects Owner’s equity. Within the Elements, there would be sub-elements, for example, the Element or Account “Assets” would consist of cash, Accounts Receivable, Land, and Building etc. Each financial transaction affects two or more elements or sub-elements of the Accounting Equation. Therefore, we can say that each financial transaction affects Balance Sheet i.e. financial position of the business. This would be clear from the following illustration. Khizr property dealer: The proprietor starts business with deposit of Rs.180, 000. On July 1, 2006 Copyright© Virtual University of Pakistan 3
  • 4.
    Financial Statement Analysis-FIN621 VU Financial Position as on July 1, 2006 Assets (Rs) Owner’s equity (Rs) i) Deposit in business by proprietor/ Cash 180,000 Khizr, Capital 180,000 owner. Jul 3, 06 Land Valuing Rs. 141, 000 is purchased for cash on July 3. Financial Position on that date would be II) Purchase of land for cash Cash 39,000 Khizr, Capital 180, 000 (Rs.141,000) Land 141,000 Total assets 180,000 Total owner's equity 180,000 (Cash is reduced by Rs.141, 000, but correspondingly a new asset land has come up) Jul 5, 06 III) Purchase of building for Cash 24,000 Liabilities & Owner's equity (Rs.36,000) partly on cash Land 141,000 Accounts/Notespayable21,000 Rs.15,000) and partly on credit Building 36,000 Owner's equity 180,000 (Rs.21,000) Total assets 2,01,000 Total 201,000 Rs.15, 000 is paid in cash for the building which further reduces cash from Rs.39, 000 to Rs.24, 000. For remaining amount of Rs.21, 000, a liability in the form of accounts or notes payable involve interest, where as accounts payable are without interest. July 10, 2006: A part of land valuing Rs.11, 000 was sold on credit. A new asset “Accounts Receivable” has been introduced. The new financial position as a result of this transaction would be: iv) Sale of part of Cash 24,000 Accounts Payable 21,000 land on credit for Accounts Receivable 11,000 Owner’s equity 180,000 Rs.11,000 Land 130,000 Building 36,000 _______ Total 201,000 201,000 July 14, 2006: Office equipment for Rs.5400/- was purchased on credit. A new liability of Rs.5400 has accrued, raising Accounts Payable from Rs.21, 000 to Rs.26, 400. v) Purchase of Office Cash 24,000 A/C Payable 26,400 Equipment for A/Cs Receivable 11,000 Owner’s equity 180,000 Rs.5400 on credit. Land 130,000 Building 36,000 Office equipment 5,400 Total 206,400 206,400 Copyright© Virtual University of Pakistan 4
  • 5.
    Financial Statement Analysis-FIN621 VU July 20, 2006. Accounts receivable which were Rs.11, 000 on July 14, have been converted into cash to the extent of Rs.1, 500. Cash has therefore increased from Rs.24, 000 to Rs.25, 500 and accounts receivable have correspondingly decreased to Rs.9, 500 (VI) Partial collection of Cash 25,500 A/Cs payable 26,400 Accounts (Rs.15,00) A/C receivable 9,500 owner's equity 180,000 Land 130,000 Building 36,000 Office equipment 5,400 Total 206,400 Total 206400 July 31, 2006 (VII) Payment of liability Cash 22,500 A/Cs payable 23,400 (A/C payable) Rs.3,000 A/C receivable 9,500 owner's equity 180,000 Land 130,000 Building 36,000 Office equipment 5,400 Total 203,400 Total 2,03,400 It is thus clear from the above illustration that each financial transaction affects financial position, (which in effect is the balance sheet). Accounting period in the example was one month. It must also be noted no business activity (commissions/ fees/ Revenues & Expenses) was involved in above example. Only setting up of business was involved and therefore owner’s equity remains the same. Copyright© Virtual University of Pakistan 5
  • 6.
    Financial Statement Analysis-FIN621 VU Lesson-2 ACCOUNT AND ACCOUNTING CYCLE/PROCESS Account An accounting system keeps separate record of each item like assets, liabilities, etc. For example, a separate record is kept for cash that shows increase and decrease in it. This record that summarizes movement in an individual item is called an Account. Each element/sub-element of the balance sheet is named as “Account”, having three parts viz title, left side (Debit or Dr) and a right side (Credit or Cr). Technically, these are also called ‘Ledger Accounts’. The same is true of Income Statement, which would be discussed later. The Ledger Accounts are also called T-account, because these are in the shape of the alphabet ‘T’ as shown below:- Dr Title Cr ! ! ! ! ! Account Payable:An amount owed to a supplier for good or services purchased on credit; payment is due within a short time period, usually 30 days or less. Notes Payable: A liability expressed by a written promise to make a future payment at a specific time, OR are obligations (short term debt) evidenced by a promissory note? The proceeds of the note are used to purchase current assets (inventory & receivables). Dual Aspect of Transactions For every debit there is an equal credit. This is also called the dual aspect of the transaction i.e. every transaction has two aspects, debit and credit and they are always equal. This means that every transaction should have two-sided effect. For example Mr. A starts his business and he initially invests Rupees 100,000/- in cash for his business. Out of this cash following items are purchased in cash; o A building for Rupees 50,000/-; o Furniture for Rupees 10,000/-; and o A vehicle for Rupees 15,000/- This means that he has spent a total of Rupees 75,000/- and has left with Rupees 25,000 cash. We will apply the Dual Aspect Concept on these events from the viewpoint of business. When Mr. A invested Rupees 100,000/-, the cash account benefited from him. The event will be recorded in the books of business as, Debit Cash Rs.100, 000 Credit Mr. A Rs.100, 000 Analyse the transaction. The account that received the benefit, in this case is the cash account, and the account that provided the benefit is that of Mr. A. • Building purchased – The building account benefited from cash account Debit Building Rs.50, 000 Credit Cash Rs.50, 000 Copyright© Virtual University of Pakistan 6
  • 7.
    Financial Statement Analysis-FIN621 VU • Furniture purchased – The furniture account benefited from cash account Debit Furniture Rs.10, 000 Credit Cash Rs.10, 000 • Vehicle purchased – The vehicle account benefited from cash account Debit Vehicle Rs.15, 000 Credit Cash Rs.15, 000 Basic Principle of Double Entry We can devise the basic principle of double entry book-keeping from our discussion to this point “Every Debit has a Credit” which means that “All Debits are always equal to All Credits”. Assets Assets are the properties and possessions of the business. Properties and possessions can be of two types: o Tangible Assets that have physical existence ( are further divided into Fixed Assets and Current Assets) o Intangible Assets that have no physical existence Examples of both are as follows: o Tangible Assets – Furniture, Vehicle etc. o Intangible Assets – Right to receive money, Good will etc. Accounting Equation From the above example, if the debits and credits are added up, the situation will be as follows: Debits Cash Rs.100, 000/- Building 50,000/- Furniture 10,000/- Vehicle 15,000/- Credits Mr. A Rs.100, 000/- Cash 75,000/- The total Equation becomes: • DEBITS = CREDITS Cash + Building + Furniture + Vehicle = Cash + Mr. A 100000 + 50000 + 10000 + 15000 = 75000 + 75000 Cash on Left Hand Side is Rupees 100,000/- and on Right Hand Side it is Rs.75, 000/-. If it is gathered on the Left Hand Side it will give a positive figure of Rupees 25,000/- (which you will notice is our balance of cash in hand). Now the equation becomes: Copyright© Virtual University of Pakistan 7
  • 8.
    Financial Statement Analysis-FIN621 VU DEBITS = CREDITS Cash + Building + Furniture+ Vehicle = Mr. A 25,000+ 50,000 + 10,000 + 15,000 = 100,000 Keeping the entity concept in mind we can see that the business owns the building, furniture, vehicle and cash and will obtain benefit from these things in future. Any thing that provides benefit to the business in future is called ‘Asset’. Similarly the business had obtained the money from Mr. A and this money will have to be returned in form of either cash or benefits. Any thing for which the business has to repay in any form is called ‘Liability’. So cash, building, furniture and vehicle are the assets of the business and the amount received from Mr. A for which the business will have to provide a return or benefit is the liability of the business. Therefore, our equation becomes: Assets = Liabilities The liabilities of the business can be classified into two major classes i.e. the amounts payable to ‘outsiders’ and those payable to the ‘owners’. The liability of the business towards its owners is called ‘Capital’ and amount payable to outsiders is called liability. Therefore, our accounting equation finally becomes: Assets = Capital + Liabilities Business or Commercial Accounts are based upon Double entry accounting involving Debit and credit entries. Rule for Dr. & Cr entries to record changes in balance sheet Accounts or Accounting Equation is: increase in assets are debited (since Assets are on left side of Accounting Equation) and increase in liabilities and Owner’s Equity are credited because these are on the right side of Accounting Equation. Correspondingly, decrease in Assets is credited and decrease in liabilities and Owners Equity are debited. Dr+ ↑ Assets = Liabilities + Owner’s equity Cr↓_ Cr ↑ + ↓ _ Dr ↑+Cr ↓_ Dr. Rule for Income Statement items is that Revenues are credited and expenses are debited. The basis of this rule is that income statement shows the effect of Revenues & Expenses on owner’s equity. Difference of Revenues and Expenses causes difference in owner’s equity. Since Revenues increase owner’s equity, these are credited. Correspondingly, since expenses ultimately reduce owner’s equity, these are debited. It would thus be seen that normal balances in Assets Accounts would be debit and those in Liability and Owner’s Equity Accounts would be credit. Orderly arrangement of Accounts is to be maintained. Numbering of Accounts is also done to facilitate proper record-keeping and cross- references. When the business is large, a Chart of Accounts is maintained which lists the various Accounts giving details of their titles and numbers. Compound Entry. A journal entry that has more than one debit or credit entry. General Journal Date Account Title and explanation LP Dr. Cr. Cash 1 180,000 Khizr, Capital 50 180,000 July, 2006 (1) (Owner invested cash in business) July, 2006 (5) Building 36,000 Cash 15,000 Copyright© Virtual University of Pakistan 8
  • 9.
    Financial Statement Analysis-FIN621 VU Accounts payable 21,000 (Purchase building partly for cash and Partly on credit) “LP” is reference account No: of the particular ledger accounts. For example cash account has been assigned number 1 in ledger and capital account is given number 50. C) Posting in ledger which mean transferring debits and credits from journal to ledger account. This is also called ledgerising or classification Date Explanation Ref Dr. Cr. Jul 1 1 180,000 Khizr 1 Capital Account No:50 Jul 1 180,000 “Ref” is reference to the page of journal i.e. page 1. This shows that there is cross-reference between journal and ledger through “LP” and “ref” columns in journal and ledger respectively. Copyright© Virtual University of Pakistan 9
  • 10.
    Financial Statement Analysis-FIN621 VU Lesson-3 ACCOUNTING CYCLE/PROCESS (Continued) *Rules of Debit and Credit From our discussion up to this point, we have established following rules for Debit and Credit: Any account that obtains a benefit is Debit. OR Anything that will provide benefit to the business is Debit. Both these statements may look different but in fact if we consider that whenever an account benefits as a result of a transaction, it will have to return that benefit to the business then both the statements will look like different sides of the same picture. For credit, Any account that provides a benefit is Credit. OR Anything to which the business has a responsibility to return a benefit in future is Credit. As explained in the case of Debit, whenever an account provides benefit to the business the business will have a responsibility to return that benefit at some time in future and so it is Credit. *Rules of Debit and Credit for Assets Similarly we have established that whenever a business transfers a value / benefit to an account and as a result creates some thing that will provide future benefit; the ‘thing’ is termed as Asset. By combining both these rules we can devise following rules of Debit and Credit for Assets: o When an asset is created or purchased, value / benefit is transferred to that account, so it is Debited I. Increase in Asset is Debit o Reversing the above situation if the asset is sold, which is termed as disposing off, for say cash, the asset account provides benefit to the cash account. Therefore, the asset account is Credited II. Decrease in Asset is Credit *Rules of Debit and Credit for Liabilities Anything that transfers value to the business, and in turn creates a responsibility on part of the business to return a benefit, is a Liability. Therefore, liabilities are the exact opposite of the assets. o When a liability is created the benefit is provided to business by that account so it is Credited III. Increase in Liability is Credit o When the business returns the benefit or repays the liability, the liability account benefits from the business. So it is Debited Copyright© Virtual University of Pakistan 10
  • 11.
    Financial Statement Analysis-FIN621 VU IV. Decrease in Liability is Debit *Rules of Debit and Credit for Expenses Just like assets, we have to pay for expenses. From assets, we draw benefit for a long time whereas the benefit from expenses is for a short run. Therefore, Expenditure is just like Asset but for a short run. Using our rule for Debit and Credit, when we pay cash for any expense that expense account benefits from cash, therefore, it is debited. o Now we can lay down our rule for Expenditure: V. Increase in Expenditure is Debit o Reversing the above situation, if we return any item that we had purchased, we will receive cash in return. Cash account will receive benefit from that Expenditure account. Therefore, Expenditure account will be credited VI. Decrease in Expenditure is Credit *Rules of Debit and Credit for Income Income accounts are exactly opposite to expense accounts just as liabilities are opposite to that of assets. Therefore, using the same principle we can draw our rules of Debit and Credit for Income VII. Increase in Income is Credit VIII. Decrease in Income is Debit Khizr introduced a capital of Rs.180,000 in his business Date Explanation Ref Dr. Cr. 2006 1-Jul Cash Account 1 180,000 Khizr, Capital 1 180,000 Purchased land for cash for Rs.141,000 Date Explanation Ref Dr. Cr. 3-Jul Land Account 141,000 Cash Account 141,000 Purchased Land for Rs. 141,000 Purchase of building partly on cash (Rs.15,000) and partly on credit (Rs.21,000) Date Explanation Ref Dr. Cr. 5-Jul Building Account 36,000 Copyright© Virtual University of Pakistan 11
  • 12.
    Financial Statement Analysis-FIN621 VU Cash Account 15,000 Accounts Payables 21,000 Sale of part of land on credit for Rs.11,000 Date Explanation Ref Dr. Cr. 10-Jul Accounts receivables 11,000 11,000 Land Account Sold a portion of land for Rs. 11,000. Purchase of Office Equipment for Rs.5400 on credit Date Explanation Ref Dr. Cr. 14-Jul Office equipment 5,400 Accounts Payables 5,400 Purchased Equipment on credit Partial collection of Accounts Rs.1500 Date Explanation Ref Dr. Cr. 20-Jul Cash account 1,500 Accounts receivables 1,500 Collection of accounts receivables Payment of liability (A/C Payable) Rs.3, 000. Date Explanation Ref Dr. Cr. 31-Jul Accounts payables 3,000 Cash account 3,000 Payment of liability Khizr Limited General Journal For the month of July 2006 Date Description L/F Dr. Cr. 1-Jul Cash Account 180,000 Khizr, Capital 180,000 Capital Invested by owner 3-Jul Land Account 141,000 Cash Account 141,000 Purchased Land for Rs. 141,000 5-Jul Building Account 36,000 Cash Account 15,000 Copyright© Virtual University of Pakistan 12
  • 13.
    Financial Statement Analysis-FIN621 VU Accounts Payables 21,000 Purchased Building partly for cash and partly on credit 10-Jul Accounts receivables 11,000 Land Account 11,000 Sold a portion of land for Rs. 11,000. 14-Jul Office equipment 5,400 Accounts Payables 5,400 Purchased Equipment on credit 20-Jul Cash account 1,500 Accounts receivables 1,500 Collection of accounts receivables 31-Jul Accounts payables 3,000 Cash account 3,000 Payment of liability Copyright© Virtual University of Pakistan 13
  • 14.
    Financial Statement Analysis-FIN621 VU Lesson-4 ACCOUNTING CYCLE/PROCESS (Continued) ACCOUNTING CYCLE/PROCESS It mainly consists of Recording, Classifying and Summarizing financial transactions over an accounting period. Steps in Accounting Cycle a) Analyzing financial transaction. The purpose is to see which two (or more) Accounts (or sub-Accounts) are affected by a particular financial transaction. b) Recording (chronologically) in journal which is called “book of original entry”. this step is also called journalizing. Its practical illustration is given below. c) Posting in ledger which means transferring debits and credits from journal to ledger account. This is also called ledgerising or classification. d) Preparing trial balance, this is done to prove the equality of debits and credits in the ledger e) Making adjusting Entries Compound Entry. A journal entry that has more than one debit or credit entry. General Journal Date Account Title and explanation LP Dr. Cr. Cash 1 180,000 Khizr, Capital 50 180,000 July, 2006 (1) (Owner invested cash in business) Building 36,000 Cash 15,000 July, 2006 (5) Accounts payable 21,000 (Purchase building partly for cash and Partly on credit) “LP” is reference account No: of the particular ledger accounts. For example cash account has been assigned number 1 in ledger and capital account is given number 50. C) Posting in ledger which mean transferring debits and credits from journal to ledger account. This is also called ledgerising or classification Date Explanation Ref Dr. Cr. 1-Jul 1 180,000 Khizr 1 Capital Account No:50 1-Jul 180,000 “Ref” is reference to the page of journal i.e. page 1. This shows that there is cross-reference between journal and ledger through “LP” and “ref” columns in journal and ledger respectively. Copyright© Virtual University of Pakistan 14
  • 15.
    Financial Statement Analysis-FIN621 VU Cash Ledger Account Date Particulars L/F Debit Date Particulars L/F Credit 1stJuly Owners 180,000 3rd Land 141,000 Equity July Accounts 5th 20th July Receivables 1,500 July Building 15,000 31st Jul A/P 3,000 31st July Balance c/f 22,500 Total 181,500 Total 181,500 Building Account Date Particulars L/F Debit Date Particulars L/F Credit 5th July Cash Account 15,000 5th July A/P 21,000 31st July Balance c/f 36,000 Total 36,000 Total 36,000 Office Equipment Account Date Particulars L/F Debit Date Particulars L/F Credit 14-Jul A/P 5,400 31st July Balance c/f 5,400 Total 5,400 Total 5,400 Accounts Payable Date Particulars L/F Debit Date Particulars L/F Credit 31st July Cash 3,000 5thJul Building 21,000 14th Equipment 5,400 July 31st July Balance c/f 23,400 Total 26,400 Total 26,400 Land Account Date Particulars L/F Debit Date Particulars L/F Credit 3rd July Cash 141,000 10th A/R 11,000 July 31st July Balance c/f 130,000 Total 141,000 Total 141,000 Accounts Receivable Date Particulars L/F Debit Date Particulars L/F Credit 10th July Land 11,000 20th Cash 1,500 July 31st Balance c/f 9,500 Copyright© Virtual University of Pakistan 15
  • 16.
    Financial Statement Analysis-FIN621 VU July Total 11,000 Total 11,000 Owner's Equity Account Date Particulars L/F Debit Date Particulars L/F Credit 1st Cash 180,000 July 31st July Balance c/f 180,000 Total 180,000 Total 180,000 d) Preparing Trial balance: This is done to prove the equality of debits and credits in the ledger. KHIZR PROPERTY DEALER TRIAL BALANCE JULY 31, 2006 Dr. Cr. Rs. Rs. Cash 22,500 Accounts Receivable 9,500 Land 130,000 Building 36,000 Office Equipment 5,400 Accounts Payable 23,400 Khizr ,capital (Owner's equity) 180,000 203,400 203,400 It is prepared in the order of Accounting Equation i.e. balance sheet. It serves as a working paper for accountants. It should however be noted that it gives assurance only as to equality of debit and credit amounts. It does not assure accuracy. For example if a transaction is altogether omitted from accounting records, debits and credits of other transactions so recorded would be equal, but this particular transaction which was omitted altogether, would not be detected by Trial balance. • At the end of accounting period, a list of all ledger balances is prepared. This list is called trial Balance. Trial balance is a listing of the accounts in your general ledger and their balances as of a specified date. A trial balance is usually prepared at the end of an accounting period and is used to see if additional adjustments are required to any of the balances. Since the basic accounting system relies on double- entry bookkeeping, a trial balance will have the same total debit amount as it has total credit amounts. • Both sides of trial balance i.e. Debit side and credit side must be equal. If both sides are not equal, there are some errors in the books of accounts. • Trial balance shows the mathematical accuracy of the books of accounts. Copyright© Virtual University of Pakistan 16
  • 17.
    Financial Statement Analysis-FIN621 VU Limitations of Trial Balance 1. Trial balance only shows the mathematical accuracy of the accounts. 2. If both sides of trial balance are equal, books of accounts are considered to be correct. But this might not be true in all the cases. 3. If any transaction is not recorded at all, trial balance can not detect the omitted transaction. • If any transaction is recorded in the wrong head e.g. if an expense is debited to an assets account. Trial balance will not be able to detect that mistake too Copyright© Virtual University of Pakistan 17
  • 18.
    Financial Statement Analysis-FIN621 VU Lesson-5 ACCOUNTING CYCLE/PROCESS (Continued) Preparing Balance Sheet from Trial Balance: We have assumed that the first month i.e. July was taken up in setting up of the business and no business activity as such took place in this month. It means there were no Revenues & Expenses and hence no Income Statement. Preparing Balance Sheet from Trial balance: involves re-arranging of items or Accounts in the Trial Balance. What is done is that Assets are taken on the left side and liabilities and owner’s equity on the right. This is the Account Form of Balance Sheet. Alternate form is Report Form in which Assets are written above and liabilities and owner’s equity are written below. Balance Sheet Khizr Property dealer For the month of July 2006 Assets Rs. Liabilities & Owner's Equity Rs. Cash 22,500 Accounts Payable 23,400 Accounts Receivable 9,500 Khizr, Capital (owner’s equity) 180,000 Land 130,000 Building 36,000 Office Equipment 5,400 Total 203,400 Total 203,400 It is to be seen that each of the 7 transactions during July, changed the Accounting Equation, and hence each gave rise to new balance sheet. The question may arise as to why make journal & ledger entries. The answer is that we have to have reasonable time-period at the end of which balance sheet may be prepared. This time-period is Accounting Period which is usually one year. And during this period individual transactions occurring daily are journalized and ledgerised i.e. posted in ledgers. Assets are economic resources that are owned by a business and are expected to benefit future operations. In most cases, the benefit to future operations comes in the form of positive future cash flows. The positive future cash flows may come directly as the asset is converted into cash (collection of a receivables) or indirectly as the asset is used in operating the business to create other assets that result in positive future cash flows (building & land used to manufacture a product for sale). Assets may have definite physical form such as building, machinery or stock. On the other hand, some assets exist not in physical or tangible form, but in the form of valuable legal claims or right. Examples are accounts receivables, investment in govt. bonds and patent rights etc. Liabilities are debts and obligations of the business. The person or organization to which the debt is owed is called creditors. All businesses have liabilities; even the most successful companies’ purchase stocks, supplies and receive services on credit. The liabilities arising from such purchases are called Accounts payable. Rule of Debit and Credit for Assets and Liabilities Assets (increase in assets is debit and decrease in asset is credit) Copyright© Virtual University of Pakistan 18
  • 19.
    Financial Statement Analysis-FIN621 VU Liabilities (Increase in liability is credit and decrease in liability is debit) Classification of Assets: There are two types of assets: 1. Tangible Assets which have physical existence and can be seen or touched. It includes Fixed as well as Current assets. 2. Intangible assets which have no physical existence like goodwill, patents and copyrights etc. • Fixed Assets – Are the assets of permanent nature that a business acquires, such as plant, machinery, building, furniture, vehicles etc. Fixed assets are subject to depreciation. • Long Term Assets –These are the assets of the business that are receivable after twelve months of the balance sheet date. For example, if business has invested some money for two years in any saving scheme or has purchased saving certificates for more than one year, it is a long term asset. • Current Assets – Are the receivables that are expected to be received within one year of the balance sheet date. Debtors, closing stock & all accrued incomes are the examples of Current Assets because these are expected to be received within one accounting period from the balance sheet date. The year, in which long term asset is expected to be received, long term asset is transferred to current assets in that year. Classification of Liabilities Capital – is the funds invested by the owners of the business. Business has a liability to return these funds to the owner. We know that for the purpose of accounting, business is treated separately from its owners. This is known as Separate Entity Concept i.e. Business is a separate entity. Therefore, if the owner gives something (can be in form of Cash or Some other Asset) to the business then the business, not only has to return the amount to the owner but it also has to give some return on that money. That is why we treat Capital (Owners Funds) as a Liability. Profit & Loss Account – The net balance of the profit and loss account i.e. either profit or loss also belongs to the owners. While explaining capital we said that the business has to give return to the owners. Now if the business is managed successfully, then this return would be a Favorable figure (Profit). This return will, therefore, be added to the Owners’ investment. On the other hand, if the business is not managed successfully then this return would be an un-favorable figure (Loss). It will, therefore, be deducted from the Owners’ Investment. • Long Term Liabilities – These are the liabilities that will become payable after a period of more than one year of the balance sheet date. For example, if business has taken a loan from bank or any third person and it is payable after three years, it will be treated as a long term liability for the business. • Current Liabilities – These are the obligations of the business that are payable within twelve months of the balance sheet date. Creditors and all accrued expenses are the examples of current liabilities of the business because business is expected to pay these back within one accounting period. The year in which long term liability is to be paid back, long term liability is transferred to current liability in that year. Copyright© Virtual University of Pakistan 19
  • 20.
    Financial Statement Analysis-FIN621 VU Balance Sheet It is a position statement that shows the standing of the organization in Monetary Terms at a Specific Time. Unlike Profit and Loss that shows the performance of the entity over a period of time, the Balance Sheet shows the Financial State of Affairs of the entity at a given date. Balance sheet is the summarized analysis in a ‘T’ form of all assets and liabilities of the entity, with liabilities listed on left hand side and assets on right hand side. Asset is any owned physical object (tangible asset) or a right (intangible asset) having economic value to the owner. Liability is an obligation of the business to deliver goods or to provide a benefit in future. Format of Balance Sheet (Account Form) Name of the Entity Balance Sheet As At------- Liabilities Amount Assets Amount Rs. Rs. Capital Fixes Assets 75000 100000 115000 Long Term Assets 20000 Add Profit and loss Account 15000 50000 Current assets 80000 Long Term Liabilities 10000 Current liabilities Total 175000 Total 175000 Format of Balance Sheet (Report Form) Name of the Entity Balance Sheet As At------- PARTICULARS Amount Amount Rs. Rs. ASSETS Fixes Assets 75000 Long Term Assets 20000 Current Assets 80000 Total 175000 LIABILITIES Capital 100000 Profit 15000 115000 Long Term Liabilities 50000 Current Liabilities 10000 Total 175000 Copyright© Virtual University of Pakistan 20
  • 21.
    Financial Statement Analysis-FIN621 VU Illustration # 1 The following is the Trial Balance extracted from the books of Naeem & Sons as on 30/06/2007. Prepare a profit & loss account & balance sheet for the year ended June 30, 2007. Particulars Dr. Cr. Sales 100,000 Purchases 45,000 purchase return 3,000 Salaries 12,000 Rent 5,000 Debtors 25,000 Creditors 16,000 Capital 368,000 Plant & machinery 400,000 Grand Total 487,000 487,000 Financial Statements • Different reports generated from the books of accounts to provide information to the relevant persons. • Every business is carried out to make profit. If it is not run successfully, it will sustain loss. The calculation of such profit & loss is probably the most important objective of the accounting function. Such information is acquired from “Financial Statements”. • Financial Statements are the end product of the whole accounting process. These show us the profitability of the business concern and the financial position of the entity at a specified date. • The most commonly used Financial Statements are ‘profit & loss account’ ‘balance sheet’ & ‘cash flow statement’. Income & Expenditure Vs Profit & Loss Account • Income and Expenditure Account is used for Non-Profit Organizations like Trusts, NGOs while • Profit and Loss Account is used for Commercial organizations like limited companies. Profit & Loss Account • Profit & Loss account is an account that summarizes the profitability of the organization for a specific accounting period. • Profit & Loss account has two parts: o First part is called Trading account in which Gross Profit is calculated. Gross profit is the excess of sales over cost of goods sold in an accounting period. In trading concern, cost of goods sold is the cost of goods consumed plus any other charge paid in bringing the goods in salable condition. For example, if business purchased certain items for resale purpose and any expense is paid in respect of carriage or bringing the goods in store (transportation charges). These will also be grouped under the heading of ‘cost of goods sold’ and will become part of its price. In manufacturing concern, cost of goods sold comprises of purchase of raw material plus wages paid to staff employed for converting this raw material into finished goods plus any other expense in this connection. o 2nd part is called Profit & Loss account in which Net Profit is calculated. Net Profit is what is left of the gross profit after deducting all other expenses of the organization in a specific time period. Copyright© Virtual University of Pakistan 21
  • 22.
    Financial Statement Analysis-FIN621 VU How to prepare Profit & Loss Account? • One way is to write down all the Debit and Credit entries of Income and Expense accounts in the Profit and Loss Account. But it is not sensible to do so. • The other way is that we calculate the net balance or we can say Closing Balance of each income and expense account. Then we note all the credit balances on the credit side and all the debit balances on the debit of profit and loss account. • If the net balance of profit and loss is Credit (credit side is greater than debit side) it is Profit and if the net balance is Debit (Debit side is greater than credit side) it is a loss. Income, Expenditure, And Profit & Loss • Income is the value of goods and services earned from the operation of the business. It includes both cash & credit. For example, if a business entity deals in garments. What it earns from the sale of garments, is its income. If somebody is rendering services, what he earned from rendering services is his income. • Expenses are the resources and the efforts made to earn the income, translated in monetary terms. It includes both expenses, i.e., paid and to be paid (payable). Consider the above mentioned example, if any sum is spent in running the garments business effectively or in provision of services, is termed as expense. • Profit is the excess of income over expenses in a specified accounting period. Profit= Income-expenses In the above mentioned example, if the business or the services provider earn Rs. 100,000 & their expenses are Rs. 75,000. Their profit will be Rs. 25,000 (100,000-75,000). • Loss is the excess of expenses over income in a specified period of time. In the above example, if their expenses are Rs. 100,000 & their income is Rs. 75,000. Their loss will be Rs. 25,000. Rules of Debit & Credit • Increase in expense is Debit (Dr.) • Decrease in expense is credit (Cr.) • Increase in income is credit (Cr.) • Decrease in income is Debit (Dr.) Classification of Expenses • It has already been mentioned that a separate account is opened for each type of expense. Therefore, in large business concerns, there may be a large number of accounts in organization’s books • . As profit & loss account is a summarized record of the profitability of the organization. So, similar accounts should be grouped for reporting purposes. • The most commonly used groupings of expenses are as follows: o Cost of goods sold o Administration expenses o Selling expenses o Financial expenses • Cost of goods sold (CGS) is the cost incurred in purchasing or manufacturing the product, which an organization is selling plus any other expense incurred in bringing the product in saleable condition. Cost of goods sold contains the following heads of accounts: Copyright© Virtual University of Pakistan 22
  • 23.
    Financial Statement Analysis-FIN621 VU o Purchase of raw material/goods o Wages paid to employees for manufacturing of goods o Any tax/freight is paid on purchases o Any expense incurred on carriage/transportation of purchased items. • Administrative expenses are the expenses incurred in running a business effectively. Main components of this group are: o Payment of utility bills o Payment of rent o Salaries of employees o General office expenses o Repair & maintenance of office equipment & vehicles. • Selling expenses are the expenses incurred directly in connection with the sale of goods. This head contains: o Transportation/carriage of goods sold o Tax/freight paid on sale o If the expense head ‘salaries’ includes salaries of sales staff then it will be excluded from salaries & appear under the heading of ‘selling expenses’. o Financial expenses are the interest paid on bank loan & charges deducted by bank on entity’s bank accounts. It includes: o Mark up on loan o Bank charges Receipt & Payment Account A receipt & payment account is the summarized record of actual cash receipts and actual cash payment of the organization for a given period of time. This is a report that provides cash movement during the reported period. In other words, it can be defined as the summarized record of the cash book for a specific period. Receipt & Payment Vs Profit & Loss Account o Receipt & payment account is the summarized record of actual cash receipts and actual cash payment during the period while profit & loss account also includes Receivable and Payable. o Income & Expenditure Vs Profit & Loss Account o These are two similar terms. Only difference between these two terms is that income & expenditure account is prepared for non profit oriented organizations, e.g. Trusts, NGO’s, whereas profit & loss account is prepared in profit oriented organizations, e.g. Limited companies, Partnership firms etc. o In case of Income and Expenditure account, Surplus/Deficit is to be find and in case of Profit and loss account, profit or loss is to be found. Copyright© Virtual University of Pakistan 23
  • 24.
    Financial Statement Analysis-FIN621 VU A sample of Profit and Loss Account Name of the Entity Profit and Loss Account For the period Ending ---- DEBIT CREDIT PARTICULARS AMOUNT PARTICULARS AMOUNT Rs. Rs. Cost of sale 60,000 Income 100,000 Gross profit c/d 40,000 (Income – cost of sales) Total 100,000 Total 100,000 Admin expenses 15,000 Gross profit b/d 40,000 Selling expenses 5,000 Financial expenses 5,000 Net profit 15,000 (Gross profit – expenses) Total 40,000 Total 40,000 Calculations of Gross profit and Net profit Gross profit = Income – cost of sales = 100000-60000 = 40000 Net profit = Gross profit – Expenses = 40000 – (15000+ 5000+5000) = 15000 A sample of Income Statement Name of the Entity Income statement For the period Ending ---- PARTICULARS AMOUNT AMOUNT Rs. Rs Income/Sales/Revenue 100000 Less: Cost of sales (60000) Gross profit 40000 Less: Administration expenses 15000 Selling expenses 5000 Financial expenses 5000 (25000) Net profit 15000 Recognition of Income and Expenditure Account: Income – should be recognized / recorded at the time when goods are sold or services are rendered. Expenses – should be recognized / recorded when benefit relating to that expense has been drawn. Income Statement and Net Income Income Statement summarizes operating results of a business by matching revenues with expenses over the same accounting period. Copyright© Virtual University of Pakistan 24
  • 25.
    Financial Statement Analysis-FIN621 VU Net income is the increase in owner’s equity resulting from profitable operations of a business. This is accompanied by increase in total assets, (but not necessarily cash) or decrease in total liabilities. It may happen that a profitable business may also run short of cash, because the profit that it earns is tied up in other assets i.e. Accounts Receivables, fixed assets etc or else, it was used in paying out its obligations like Accounts Payable etc. Net loss is the corresponding decrease in owner’s equity. Elements of Income Statement Revenues: This is defined as sale price of goods sold and services rendered during an accounting period. Expenses: These constitute Cost to the business of the goods and services used in business operations during the same accounting period. In other words, these are “cost of doing business”. Just as in Balance Sheet we have sub-elements or sub-Accounts, in Income Statement also there are sub- elements/sub-Accounts i.e. difference sources of Revenues, different expenses like cost of good sold, depreciation expenses, interest expense etc. Accrual Basis of Revenue & Expense Accounting Revenue Recording is done on Realization Principle. In this case, the date of rendering services or date of delivery of good sold is considered as the date of earning revenue. For example, if services are rendered in January and actual receipt of revenue/fee takes place in February i.e. after one month as per agreement, still the revenue would be recorded in the month of January since it was “earned” in January. Expense Recording is done on matching principle. This means that revenues are offset by all expenses incurred in producing those revenues, pertaining to a particular accounting period. It would thus be seen that there is cause-and-effect relationship between revenues and expenses. For example, June salaries are paid in July but these have to be recorded as salaries expense for June. It must also be noted that Revenue & cash Receipts and Expense & cash payments are different. The two can happen before, after or during the accounting period. Dr. & Cr. Rules for Recording Revenues and Expenses are the same as those for Owner’s equity or Capital Account. Expenses are the costs of the goods and services used up in the process of earning revenue. Examples include the cost of employee’s salaries, advertising, rent, utilities, and the gradual wearing-out (depreciation) of such assets as buildings, automobiles, and office equipment. All these costs are necessary to attract and serve customers and here by earn revenue. Expenses are often called the “costs of doing business” that is, the cost of the various activities necessary to carry on a business. An expense always causes a decrease in owner’s equity. The related changes in the accounting equation can be either (1) a decrease in assets, or (2) an increase in liabilities. An expense reduces assets if payment occurs at the time that the expense is incurred. If the expense will not be paid until later, as for example, the purchase of advertising services on account, the recording of the expense will be accompanied by an increase in liabilities. Copyright© Virtual University of Pakistan 25
  • 26.
    Financial Statement Analysis-FIN621 VU Lesson-6 ACCOUNTING CYCLE/PROCESS (Continued) Business transactions during August, 2006 Now let us suppose that during the month of August, actual business operations commenced and Khizr provided services to clients at the agreed commission/fee rate of 2% of rental value of property. Suppose rental value of property during August was Rs.532, 000. Commission/fee earned at the rat of 2% comes to Rs.10, 640. Commission actually received (in cash) during August was Rs.5, 000, the rest was to be paid later. Provided services to clients at the agreed commission/fee rate of 2% of rental value of property. Rental value of property during Aug: Rs.532, 000 Rental Value = Rs.532, 000 Commission (532,000 x 2%) = Rs. 1 0,640 Actual Cash Received = Rs. 5,000 Date Description L/F Dr. Cr. Aug Cash Account 5,000 Accounts Receivable 5,640 Commission Received 10,640 Commission Income Received Advertising expenses (paid in advance) Rs.645. Date Description L/F Dr. Cr. Cash Account 645 Advertising expense paid • Salaries for Aug (to be paid in September) Rs.7, 400. Date Description L/F Dr. Cr. Salaries Expense 7,400 Salaries Payables 7,400 Accrued salaries for the month of August Telephone bill for Aug (to be paid in September) Rs.400. Date Description L/F Dr. Cr. Utilities Expense 400 Utilities bill Payables 400 Accrued telephone bill Copyright© Virtual University of Pakistan 26
  • 27.
    Financial Statement Analysis-FIN621 VU Expenses were:- Advertising expenses (paid in advance) Rs. 645 Salaries for Aug (to be paid in September) Rs.7, 400 Telephone bill for Aug (to be paid in September) Rs. 400 The above is incomplete list of Expenses. There are certain invisible expenses amounting to Rs.195 (in which no cash is involved), which are recorded at the end of accounting period. Before we take these up, let us distinguish between Expenditure and Expenses. Expenditure Vs Expenses Expenditure: It is the cost benefiting or spreading over two or more accounting periods. Expense is the portion of Expenditure for one accounting period only. Examples: Expenditure on fixed assets is incurred in lump sum. Then there are pre-paid costs e.g. insurance, pre-paid rent, for more than one year/accounting period. It may be noted that expenditure on advertisements, employees training, are directly charged to expenses because in these cases, the number of accounting periods over which revenue is likely to be produced (or increased) because of these, are not readily estimable. • Incomplete list of Expenses: Invisible expenses (non cash involved), recorded at the end of accounting period. Date Description L/F Dr. Cr. Depreciation Expense-Building 150 Depreciation Expense-Equipment 45 Accumulated Depreciation 195 Depreciation Expenses Invisible Expenses Cost value of Building = Rs. 36,000 Estimated useful life = 20 years Expense for one month will be calculated as follows: = 36,000 x 1/240 = Rs. 150 per month This Rs. 150 is the portion of expenditure of Rs.36, 000. This expense is technically called Depreciation Note: Land is not depreciated Value of Office Equipment = 5,400 Estimated useful life = 10 years The calculation of expense on equipment will be Calculated as follows: = 5,400 X 1/120 = Rs. 45 This Rs. 45 is technically called depreciation on Office Equipment. Pre-paid costs e.g. Insurance, Pre-paid rent, will be recorded as follows: Copyright© Virtual University of Pakistan 27
  • 28.
    Financial Statement Analysis-FIN621 VU Date Description L/F Dr. Cr. Prepaid Rent 12,000 Cash Account 12,000 Rent paid in advance Rent Expense 1,000 Prepaid Rent 1,000 Recording rent expense Income Statement For the period ending August 31, 2006 Revenues Rs. Sales Commission earned. 10,640 Expenses Advertising expenses. 645 Salaries expenses. 7,400 Telephone expenses. 400 Depreciation expense: building 150 Depreciation expense: office equipment 45 Total Expense 8,640 Net Income 2000 With this background, let us now move on to the fifth step in the Accounting Cycle. Copyright© Virtual University of Pakistan 28
  • 29.
    Financial Statement Analysis-FIN621 VU Lesson-7 ACCOUNTING CYCLE/PROCESS (Continued) e) Making adjusting entries: These are the Entries required for those transactions which affect revenues or expenses of more than one accounting period. Immediate recording of every event in some cases is not practical e.g. raw material, office supplies, depreciation. Journal entries of such expenses are recorded at the end of accounting period and are called adjusting entries. Regular journal entries (chronological) are recorded in blue and adjusting entries are recorded in red. Adjusting Entry to record Expenses on Fixed Assets The expenditure use to acquire Fixed Assets is spread over a number of Accounting periods. The spreading of that expenditure over a number of Accounting periods is called Expense for that period. Adjusting entry is also required to record Prepaid Costs. Expenses are the expired portion of Assets. Office supplies and Raw material are treated at the end of Accounting period. The balance of Office supplies & Raw materials is calculated as follows: Opening balance Add: Purchases Less: Closing balance Prepaid Costs are initially taken as Asset. Pre paid costs, if consumed entirely during Accounting period are charged directly to expense Types of Adjusting Entries i) Entries to distribute expenditure benefiting more than one accounting period e.g. fixed assets, pre-paid costs (if for more than one year). Pre-paid costs are initially taken as Asset and corresponding portion for an accounting period is reduced there from. In the case of office supplies, raw materials, the formula is: - opening balance + purchases- closing balance. This would give the amount/extent of official supplies, raw materials consumed during the accounting period. It must also be noted that pre paid costs, if consumed entirely during accounting period, are charged directly to expense. Fixed assets are those which are used for more than one Accounting period. ii) Entries to distribute un-earned revenue i.e. revenue collected in advance (deferred revenue). It is first recorded as liability, and is gradually reduced in the subsequent accounting period. iii) Entries to record accrued expenses e.g. unpaid salaries, interest payable, to be paid in the subsequent accounting period. iv) Entries to record accrued revenues. These are first recorded as Assets i.e. Revenue Receivable. For example if rendering of services/delivery of goods is spread over a number of accounting periods, and billing is to be done at the completion of rendering services or delivering goods, then corresponding adjusting entry for each accounting period is made for Revenue Receivable, but not yet earned. Copyright© Virtual University of Pakistan 29
  • 30.
    Financial Statement Analysis-FIN621 VU Khizr Property dealer Trial Balance For the month of July 2006 Particulars Rs. Rs. Cash 22,500 Accounts Receivable 9,500 Land 130,000 Building 36,000 Office Equipment 5,400 Accounts Payable 23,400 Khizr, Capital (owner’s equity) 180,000 Total 203,400 203,400 Adjusted entries are all related to accrual accounting, as would be seen from the very description of each adjusting entry given above. f) Preparing adjusted trial balance: This is the sixth step in Accounting Cycle. In this, we take into account the adjusting entries made earlier in step 5 (e). Adjusting entries are journalized and posted, i.e. recorded in journal and posted in ledger. Accumulated depreciation would double after second month, in the example of adjusted trial balance given above. In the above example, estimated life of building is taken as 20 years and that of office equipment as 10 years, which makes the monthly figure of the use of these assets as Rs.150 and Rs.45 respectively. Other transactions during August 2006 changed balances of cash, A/Cs Receivable, A/Cs payable. Reverting to the earlier reference about invisible expenses of Rs.195, in the Income Statement, these were depreciation expenses of building amounting to Rs.150 and depreciation expenses of office equipment amounting to Rs.45. The adjusting entries which are recorded in Journal at the end of Accounting period are adjusted in, Adjusted Trial Balance. Khizr Property Dealer Adjusted Trial Balance August 31,2006 Particulars Dr. Cr. Cash. 16,105 Accounts Receivable. 18,504 Land. 130,000 Building. 36,000 Accumulated depreciation: building. 150 Office equipment. 5,400 Accumulated Dep: office equipment. 45 Accounts Payable. 23,814 Owner’s equity. 180,000 Sales commission earned. 10,640 Copyright© Virtual University of Pakistan 30
  • 31.
    Financial Statement Analysis-FIN621 VU Advertising expenses. 645 Salaries expenses. 7,400 Telephone expenses. 400 Depreciation expenses: building. 150 Depreciation expenses: office equipment. 45 214,649 214,649 The above is adjusted trial balance as on August 31, 2006. Copyright© Virtual University of Pakistan 31
  • 32.
    Financial Statement Analysis-FIN621 VU Lesson-8 ACCOUNTING CYCLE/PROCESS (Continued) Pre-paid costs e.g. Pre-paid rent, will be recorded as follows: Date Description L/F Dr. Cr. Prepaid Rent 12,000 Cash Account 12,000 Rent paid in advance Pre-paid costs e.g. Pre-paid rent, will be recorded as follows: Date Description L/F Dr. Cr. Rent Expense 1,000 Prepaid Rent 1,000 Recording rent expense Pre-paid costs e.g. Pre-paid Insurance will be recorded as follows: Date Description L/F Dr. Cr. Prepaid Insurance 12,000 Cash Account 12,000 Insurance paid in advance Pre-paid costs e.g. Pre-paid Insurance will be recorded as follows: Date Description L/F Dr. Cr. Insurance Expense 1,000 Prepaid Insurance 1,000 Recording Insurance expense g) Preparing Financial Statements Now we come to the all-important step of preparing Financial Statements from Accounting Records. Income Statement is prepared from Adjusted Trial Balance, first. Then Statement of Owner’s equity between Income Statement and Balance Sheet is prepared. For this, Net profit/loss in Income Statement is added to/ subtracted from owner’s equity in “Owner’s equity Statement”, and the total/net is then transferred to Balance Sheet. After the preparation of Balance Sheet, the fourth Financial Statement i.e. Cash flow Statement is prepared separately. As a practical illustration, let us prepare these Financial Statements. Income Statement For the period ending August 31, 2006 Particulars Rs. Rs. Revenues Sales Commission earned. 10,640 Copyright© Virtual University of Pakistan 32
  • 33.
    Financial Statement Analysis-FIN621 VU Expenses Advertising expenses. 645 Salaries expenses. 7,400 Telephone expenses. 400 Depreciation expense: building 150 Depreciation expense: office equipment 45 8,640 Net Income. 2,000 The revenue and expenses shown in the income statement are taken directly from the company’s adjusted trial balance. Our measurement of net income is not absolutely accurate or precise, because of the assumptions and estimates in the accounting process. An income statement has certain limitations. Remember that the amount shown for depreciation expense or based on estimates of the useful lives of the company’s building and office equipment. Also the income statement includes only those events that have been evidence by business transactions. Alternative titles for the income statement include earnings statement, statement of operations, and profit and loss statement. However, income statement is by far the most popular term for this important financial statement. In summary, we can say that an income statement is used to summaries the operating results of business by matching the revenue earned during a given time period with the expenses incurred in obtaining that revenue. Note: This is case of service business, and sole proprietorship. In the case of Merchandise & Manufacturing business: Net Income=Sales–Cost of Goods sold–Other expenses. ii) Owner’s equity Statement Owner’s equity which was Rs.180, 000 on July 31, 2006 increases by Rs.2000 due to profitable operations during the month of August, 2006. Net income is transferred to owner’s equity statement, which is further transferred to Balance Sheet. Correspondingly, there would be either increase in Assets (Left) side of the Accounting Equation (or Balance Sheet), or decrease in Liabilities (Right) side, to maintain balance. Statement of Owner’s equity summarizes increase/decrease in owner’s equity during accounting period. It is increased due to profit and additional investment by the owner. It is decreased due to loss and withdrawal/drawing by the owner. Statement of Owner’s equity for the month of August, 2006 Particulars Rs. Khizr, capital July 31, 2006 180,000 Add: Net income for August, 2006 2,000 Additional investment by owner 4,000 Sub total 186,000 Less withdrawal/drawing by owner 3,000 Owner’s equity August 31, 2006 183,000 III. Balance Sheet The balance sheet lists the amounts of the company’s assets, liabilities, and owner’s equity at the end of accounting period. The balances of the assets and liability accounts are taken directly Copyright© Virtual University of Pakistan 33
  • 34.
    Financial Statement Analysis-FIN621 VU from the adjusted trial balance. Cash is listed first among the assets. It is often followed by such asset as marketable securities, short-term notes receivable, accounts receivable, inventories, and supplies. These are the most common examples of current assets. The term “current assets” includes cash and those assets that will be quickly converted to cash or used up in operations . Khizr Property Dealer Balance Sheet As on August 31,2006 Assets Rs. Rs. Liabilities & Equity Rs. Cash 16,105 Accounts Payable 23,814 Accounts Receivables 19,504 Owner’s equity 183,000 Land 130,000 Building 36,000 Less Accumulated Dep: 150 35,850 Office Equipment 5,400 Less Accumulated Dep: 45 5,355 TOTAL 206,814 TOTAL 206,814 - Owner’s equity obtained from Owner’s equity statement Copyright© Virtual University of Pakistan 34
  • 35.
    Financial Statement Analysis-FIN621 VU Lesson-9 ACCOUNTING CYCLE/PROCESS (Continued) Other steps in the Accounting Cycle after the preparation of Financial Statements are:- h) Closing entries in Accounting Cycle. As previously stated, revenues increase owner’s equity, and expenses and withdrawals by the owner decrease owner’s equity. If the only financial statement that we needed was a balance sheet, these changes in owner’s equity could be recorded directly in the owner’s capital account. However, owners, managers, investors, and others need to know amount of specific revenues and expenses, and the amount of net income earned in the period. Therefore we maintain separate ledger account to measure each type of revenue and expense, and other owner’s drawings. The revenue, expense, and drawing accounts are called temporary accounts, are nominal accounts, because they accumulate the transactions of only one accounting period. At the end of this accounting period the changes in owner’s equity accumulated in these temporary accounts are transferred into the owner’s capital account. This process serves two purposes. First it updates the balance of the owner’s capital account for changes in owner’s equity account for changes in owner’s equity occurring during the accounting period. Second, it returns the balances of the temporary accounts to zero, so that they are ready for measuring the revenue, expenses, and drawings of the next accounting period. The owner’s capital account and other balance sheets are called permanent or real accounts, because their balances continue to exist beyond the current accounting period. The process of transferring the balances of the temporary account into the owner’s capital account is called closing the accounts. The journal entries made for the purpose of closing the temporary accounts are called closing entries. Revenue and expense accounts are closed at the end of each accounting period by transferring their balances to a summary account called income summary. When the credit balance of the revenue accounts and the debit balances of expense accounts have been transferred into one summary account, the balance of this income summary will be the net income or net loss for the period. If the revenue (credit balances) exceeds the expenses (debit balances), the income summary account will have a credit balance representing net income. Conversely, if expenses exceed revenue, the Income Summary will have a debit balance representing net loss. This is consistent with the rule that increases in owner’s equity are recorded by credits and decreases are recorded by debits. Closing Entries for Revenue Accounts Revenue accounts have credit balances. Therefore, closing a revenue account means transferring its credit balance to the Income Summary account. This transfer is accomplished by a journal entry debiting the revenue account an amount equal to its credit balance, with an offsetting credit to the Income Summary account. The debit portion of this closing entry returns the balance of the revenue account to zero; the credit portion transfers the former balance of the revenue account into the Income Summary account. Closing Entries foe Expense Accounts Expense accounts have debit balances. Closing an expense account means transferring its debit balance to the Income Summary account. The journal entry to close an expense account, therefore, consists of a credit to the expense account in an amount equal to its debit balance, with an offsetting debit to the Income Summary account. Copyright© Virtual University of Pakistan 35
  • 36.
    Financial Statement Analysis-FIN621 VU Closing the Income Summary Account Due to increase in net income owner’s equity increases. The credit balance of Income Summary account is, therefore transferred to the owner’s equity account. Conversely if the expenses of a business are larger than its revenue, the Income Summary account will have a debit balance, representing a net loss for the accounting period .In this case, the closing of the Income Summary account requires a debit to the owner’s capital account and an offsetting credit to the Income Summary account. The owner’s equity will, of course, be reduced by the amount of the loss debited to the capital account. Note that the Income Summary account is used only at the end of the period when the accounts are being closed. The Income Summary account has no entries and no balance except during the process of closing the accounts at the end of accounting period. Closing the Owner’s Drawing Account Withdrawals of cash or other assets by the owner are not considered an expense of the business and, therefore, are not a factor in determining the net income for the period. Since drawings by the owner do not constitute an expense, the owner’s drawing account is closed not into the Income Summary account but directly to the owner’s capital account. Revenue, Expense and Drawing (by owner) change owner’s equity. These are temporary capital accounts. To make these Accounts ready for recording events of next accounting periods, we take the following steps:- Close (transfer) Revenue Accounts to Income Summary Account. Close (transfer) Expense Accounts to Income Summary Account. Close (transfer) Income Summary Account to Owner’s Equity Account or Capital Account. Close Drawing Account directly to Capital Account. Debit and credit entries of course are involved in journal and ledger. i) Prepare after-closing trial balance. In many cases, another trial balance is prepared after closing entries have been recorded in journal and posted in ledger. Summary Steps in Accounting Cycle: The accounting procedures in the accounting cycle may be summarized as follows 1. Journalize Transactions 2. Post to Ledger Accounts 3. Prepare A Trial Balance 4. End of Period Adjustments 5. Prepare an Adjusted Trial Balance 6. Prepare Financial statements 7. Journalize and Post Closing Entries 8. Prepare an After Closing Trial Balance Copyright© Virtual University of Pakistan 36
  • 37.
    Financial Statement Analysis-FIN621 VU Lesson-10 FINANCIAL STATEMENTS Income Statement A typical and Standard Income Statement and Balance Sheet of a manufacturing concern would be as follows:- INCOME STATEMENT/PROFIT & LOSS ACCOUNT MOOSA & CO. LTD FOR/DURING THE PERIOD 2005-06 Rs. in _______ Net Sales * 100 Cost of Goods Sold * Raw material 30 Salaries & wages (direct Labour) 10 Stores & spares 5 Utilities 5 Depreciation 5 Others 5 ____ _____ Total 60 Gross Profit (loss) 40 _______________________________________________________________________ * Net Sales = Gross Sales – Sales returns – Sales allowances/discounts. * Cost of Goods sold = Cost of production of goods actually sold; also called “cost of sales”: largest expense item. Operating expenses Selling & admin 5 Advertising 5 Depreciation & others 5 Total 15 ____ Operating Profit (EBIT) 25 ______________________________________________________________________ EBIT: Earning before Interest and Taxes. Other expenses * Financial charges i.e. interest 5 Loss on sale of assets 1 Purchase of goodwill 1 Total 7___ Profit before tax (EBT) 18 Provision for tax 5 Profit after tax 13 Copyright© Virtual University of Pakistan 37
  • 38.
    Financial Statement Analysis-FIN621 VU Other income * Investment gains 7 Net Profit 20 ===== (bottom line) Dividend paid 5 Retained earnings 15 (Added in shareholder’s equity and carried forward to Balance Sheet) ________________________________________________________________ * Other expenses: also called non-operating expenses. * Other income: Dividend revenue, Interest revenue, Gain on Assets Sales etc. The above is called Multiple – Step Income Statement. Special items: These are one-time items that will not recur in the future, and are disclosed separately on Income Statement. Examples are: discontinued operations (firm selling a major portion of its business), extra ordinary transactions (unusual in nature), and cumulative effect of changes in accounting methods of Inventory and Depreciation. Illustration # 1 The following Trial Balance has been extracted from the books of ABC Company. on 30-06-2002. From this, prepare an Income Statement and Balance Sheet for the year ended 30-06-2002. Particulars Dr. Cr. Sales 200,000 Purchases 180,000 purchase return 2,500 Office salaries 3,500 Furniture & Fixture 16,000 Office Equipment 11,000 Rent 5,000 Accounts Payable(creditors) 28,000 Sales Salaries 3,000 Freight & custom duty on purchases 6000 Repair of office equipment 2,000 Accounts Receivable(debtors) 52,000 Freight on sales 1,000 Capital 41,500 Cash in hand 37,000 Loan from bank(for three years) 50,000 Bank charges 500 Interest on loan 5,000 Grand Total 322,000 322,000 Copyright© Virtual University of Pakistan 38
  • 39.
    Financial Statement Analysis-FIN621 VU Solution BC Company. ofit & Loss Account for the year ended June 30, 2002. Rs. Rs. Sales 200,000 Purchases 180,000 Purchase return 2,500 Freight, custom duty on purchases 6,000 Gross Profit 16,500 202,500 202,500 Salaries 3,500 Gross Profit 16,500 Rent 5,000 Repair of office equipment 2,000 Sales salaries 3,000 Freight on sales 1,000 Interest on loan 5,000 Bank charges 500 Net loss 3,500 Total 20,000 20,000 ILLUSTRATION #2 Following trial balance has been extracted from the books of Hassan Manufacturing Concern on June 30, 2002. Hassan Manufacturing Concern Trial balance As on June 30, 2002 Particulars Amount Amount Dr. (Rs.) Cr. (Rs.) Raw Material stock Jul. 01, 2001 35,500 Work in process Jul. 01, 2001 42,000 Finished goods stock Jul. 01, 2001 85,000 Raw material purchased 250,000 Wages 180,000 Freight inward 12,000 Plant and machinery 400,000 Office equipment 45,000 Vehicles 200,000 Acc. depreciation Plant 195,200 Acc. depreciation Office equipment 12,195 Acc. depreciation Vehicles 97,600 Factory overheads 125,000 Electricity 80,000 Salaries 140,000 Salesman commission 120,000 Rent 200,000 Insurance 150,000 General Expense 60,000 Bank Charges 8,500 Copyright© Virtual University of Pakistan 39
  • 40.
    Financial Statement Analysis-FIN621 VU Discounts Allowed 20,000 Carriage outward 35,000 Sales 1,500,000 Trade Debtors 250,000 Trade Creditors 220,000 Bank 165,000 Cash 110,000 Drawings 175,000 Capital July 01, 2001 863,005 Total 2,888,000 2,888,000 Notes: • Stock on June 30, 2002. o Raw Material 42,000 o Work in Process 56,500 o Finished Goods 60,000 • 50% of electricity, insurance and salaries are charged to factory and balance to office. • Depreciation to be charged on Plant & Machinery at 20%, Office Equipment at 10% and Vehicles at 20%on WDV. • Write off bad debts Rs. 30,000. • All the wages are direct. Required: You are required to prepare profit and loss account for the year and balance sheet as on june30, 2002. SOLUTION Profit & Loss Account Hassan Manufacturer Concern Profit and Loss Account For the Year Ending June 30, 2002 Particulars Note Amount Rs. Sales 1,500,000 Less: Cost of Goods Sold 1 796,960 Gross Profit 703,040 Less: Administrative Expenses 2 518,761 Less: Selling Expenses 3 155,000 Operating Profit 29,279 Less: Bank Charges 8,500 Net Profit Before Tax 20,779 Copyright© Virtual University of Pakistan 40
  • 41.
    Financial Statement Analysis-FIN621 VU NOTES TO THE ACCOUNTS Note # 1 Cost of Goods Sold Stock of Raw Material Jul 01, 2001 35,500 Add. Purchases 250,000 Add. Freight Inward 12,000 297,500 Less: Closing Stock of Raw Material (42,000) Raw Material Consumed 255,500 Direct labour 180,000 Factory Overheads Factory Overheads 125,000 Electricity (50% of 80,000) 40,000 Salaries (50% of 140,000) 70,000 Insurance (50% of 150,000) 75,000 Plant Depreciation (Note 5) 40,960 350,960 Total Factory Cost 786,460 Add: Work in Process Jul 01, 2001 42,000 Less: Work in Process Jun 30, 2002 (56,500) Cost of Goods Manufactured 771,960 Add: Finished Goods Stock Jul 01, 2001 85,000 Less: Finished Goods Stock Jun 30, 2002 (60,000) Cost of Goods Sold 796,960 Note # 2 Administrative Expenses Salaries (50% of 140,000) 70,000 General Expenses 60,000 Rent 200,000 Insurance (50% of 150,000) 75,000 Discount Allowed 20,000 Bad Debts 30,000 Office Electricity (50% of 80,000) 40,000 Depreciation Vehicles (Note 5) 20,480 Depreciation Office Equip. (Note5) 3,281 Administrative Expenses 518,761 Note # 3 Selling Expenses Salesman Commission 120,000 Carriage Outward 35,000 Selling Expenses 155,000 Copyright© Virtual University of Pakistan 41
  • 42.
    Financial Statement Analysis-FIN621 VU Lesson-11 FINANCIAL STATEMENTS (Continued) Balance Sheet The balance sheet lists the amounts of the company’s assets, liabilities, and owner’s equity at the end of accounting period. The balances of the assets and liability accounts are taken directly from the adjusted trial balance. Cash is listed first among the assets. It is often followed by such asset as marketable securities, short-term notes receivable, accounts receivable, inventories, and supplies. These are the most common examples of current assets. The term “current assets” includes cash and those assets that will be quickly converted to cash or used up in operations BALANCE SHEET MOOSA & CO LTD., AS ON JUNE 30, 2006 I) Account form Rs. in _________ ASSETS LIABILITIES+SHARE HOLDERS’ FUNDS/OWNERS’ EQUITY Current Assets - cash & cash equivalents 15 Current liabilities - Marketable securities 3 - pre-paid expense 2 - Bank borrowings 15 - Accounts Receivables 10 - Accounts payable 5 (trade debtors/customers) (trade creditors) - Inventory 20 -Provision for tax 5 ______ Total current liabilities 25 Long-term interest bearing loan Total current Assets 50 (fixed liabilities) 50 Fixed Assets 150 Owner’s equity/shareholders funds 125 Total Assets 200 Total Liabilities and owners’ equity 200 ========= ==== Note: The above list is not exhaustive. It may include many other items. Cash equivalent are cash substitutes not immediately required i.e. short-term high liquid investment, usually for three months. Examples are Treasury bills, certificates, prize bonds etc. Marketable securities are investments in govt. bonds and stocks and bonds of other companies. Fixed Assets are acquired for long-term use e.g. Land, Building, Plant & Machinery, Vehicles, Furniture‘s & Fixtures etc. Long-term loans are usually secured against inventory and fixed assets. Tax is shown both on Balance Sheet as current liability i.e. tax payable and on Income Statement, as Interest expense for the accounting period. ii) Report form Balance sheet (As on end of accounting period) Rs. in______ Assets i) Current Assets 50 ↓ ↑ ii) Fixed Assets 150 Total: 200 Copyright© Virtual University of Pakistan 42
  • 43.
    Financial Statement Analysis-FIN621 VU LIABILITIES & OWNERS’ EQUITY/SHARE HOLDERS’ FUNDS. STOCK ↑↓ Current liabilities 25 Fixed/long f term liabilities 50 Owners’ equity/shareholders funds. 125 ____ Total: 200 Recording in Balance Sheet: The guiding rule for an accountant is to be conservative and choose lower values. For example marketable securities are recorded at cost, but current market rate is also mentioned. Inventory is recorded at cost or market value, whichever is lower. Land is recorded at historical cost. Other fixed assets (i.e. Building, Plant & Machinery, etc) are recorded at original cost less accumulated depreciation called “Book value. The accountant must also make provisions for doubtful debts and inventory losses. Current Assets: These are assets capable of being converted into cash within one year or operating cycle, whichever is longer. Operating cycle is the time required to purchase or manufacture inventory, sell the product and collect cash i.e. Cash/assets -----------→ Inventory--------→Receivables ---------→ cash Processing sales collection Length of operating cycle = inventory sale days + Receivable Collection days. Current assets are recorded in order of liquidity i.e. ease of conversion into cash. Within current Assets, some assets are more liquid than others. These are Quick Assets= Total current Assets – Inventory – Pre paid expenses. The accountant must make allowances for “doubtful accounts” i.e. “unrealizable”. It may also be noted that proportion of current and fixed assets to total assets is determined by the nature of business. Some additional items on Balance Sheet: Other Assets: These are Incorporation cost i.e. start-up costs in connection with setting up new business, property held for sale etc. Other additional items may be, Intangible Assets like Goodwill, patents, trademarks etc. Goodwill arises when one business acquires another for a price in excess of its fair market value. This is shown on “fixed Assets side of B/Sheet. It has no physical substance or existence as such. Common meaning of “Good Will” in non-accounting terms is the benefits derived from a favorable reputation of the business. ILLUSTRATION #2 Following trial balance has been extracted from the books of Hassan Manufacturing Concern on June 30, 2002. Hassan Manufacturing Concern Trial balance As on June 30, 2002 Particulars Amount Amount Dr. (Rs.) Cr. (Rs.) Raw Material stock Jul. 01, 2001 35,500 Work in process Jul. 01, 2001 42,000 Finished goods stock Jul. 01, 2001 85,000 Raw material purchased 250,000 Copyright© Virtual University of Pakistan 43
  • 44.
    Financial Statement Analysis-FIN621 VU Wages 180,000 Freight inward 12,000 Plant and machinery 400,000 Office equipment 45,000 Vehicles 200,000 Acc. depreciation Plant 195,200 Acc. depreciation Office equipment 12,195 Acc. depreciation Vehicles 97,600 Factory overheads 125,000 Electricity 80,000 Salaries 140,000 Salesman commission 120,000 Rent 200,000 Insurance 150,000 General Expense 60,000 Bank Charges 8,500 Discounts Allowed 20,000 Carriage outward 35,000 Sales 1,500,000 Trade Debtors 250,000 Trade Creditors 220,000 Bank 165,000 Cash 110,000 Drawings 175,000 Capital July 01, 2001 863,005 Total 2,888,000 2,888,000 Notes: • Stock on June 30, 2002. o Raw Material 42,000 o Work in Process 56,500 o Finished Goods 60,000 • 50% of electricity, insurance and salaries are charged to factory and balance to office. • Depreciation to be charged on Plant & Machinery at 20%, Office Equipment at 10% and Vehicles at 20%on WDV. • Write off bad debts Rs. 30,000. All the wages are direct Copyright© Virtual University of Pakistan 44
  • 45.
    Financial Statement Analysis-FIN621 VU Balance Sheet Hassan Manufacturer Concern Profit and Loss Account For the Year Ending June 30, 2002 Particulars Note Amount Rs. Fixed Assets at WDV 4 275,284 Current Assets 5 653,500 Current Liabilities 6 (220,000) Working Capital 433,500 Total Assets Employed 708,784 Financed by: Capital 863,005 Add: Profit for the year 20,779 Less: Drawings (175,000) Total Liabilities 708,784 Note # 4 Fixed Assets at WDV Acc. Depreciation WDV Cost Rate Opening For the year closing Plant & Mach. 400,000 20% 195,200 40,960 236,160 163,840 Vehicles 200,000 20% 97,600 20,480 118,080 81,920 Office Equip. 45,000 10% 12,195 3,281 15,476 29,524 64,721 275,284 Note # 5 Current Assets Stock Raw Material 42,000 Work in Process 56,500 Finished Goods 60,000 158,500 Debtors 250,000 Less: Bad Debts (30,000) Bank 165,000 Cash 110,000 Current Assets 653,500 Note # 6 Current Liabilities Trade Creditors 220,000 Copyright© Virtual University of Pakistan 45
  • 46.
    Financial Statement Analysis-FIN621 VU Lesson-12 FINANCIAL STATEMENTS (Continued) Cash Flow Statement Cash flow statement shows, how cash was generated and how it was used during the period. These days, it is required by law to include this statement in financial statements, especially in case of financial statements of limited companies. Need For Cash Flow Statement For any business, it is important to ensure that: • Sufficient profits are made to compensate owners for the investment made, efforts put in and the risk taken for the business, • Sufficient funds are available to meet the obligations of the business as and when required. The information as to profitability is provided by the Profit and Loss Account. The information as to availability of funds or financial health is provided by the balance sheet. But the balance sheet is prepared on a specific date and can provide information of financial position as on that date only. Cash flow, on the other hand provides more detailed information about the movement of funds during the period. With the help of cash flow, we can determine the amount of cash generated form different sources and the areas on which it is utilized. Difference between Profitability and Liquidity Liquidity It is the ability of a business to pay its debts in time. By having good liquidity, we mean that a business has sufficient liquid funds (cash and cash equivalents) so that it can repay liabilities. Cash Cash includes cash in hand and demand deposits. Cash Equivalents Cash equivalents are those short term investments that can be converted into a known amount of cash at any time. Usually, investments up to three months maturity are included in cash equivalents. People generally mix up profitability with liquidity. One might think that if a business has earned, say, One Million Rupees of profit than it should have approximately the same amount of cash in it. But mostly this is not the case. Consider the following example: • A person starts a small business with Rs. 10,000. • He purchases goods worth Rs. 20,000. Rs. 10,000 is paid in cash and remaining is payable at the end of the month. • The same day, all the goods are sold on credit of two months for Rs. 30,000. • Now if we draw a profit and loss account at the end of the month, the business has earned a profit of Rs. 10,000, considering no expenses. • But at the same time, it is time to pay to the Creditors, whereas payment from debtor is not due yet. • This means that although the business earned a profit of Rs. 10,000 but it has no cash to pay to its creditors. • This simple example helps us to understand that liquidity is different from profitability • But it is as important as profitability. Copyright© Virtual University of Pakistan 46
  • 47.
    Financial Statement Analysis-FIN621 VU Components of Cash Flow Statement Cash flow statement is divided into three components • Cash Flow from Operating Activities • Cash Flow from Investing Activities • Cash Flow from Financing Activities Cash Flow From Operating Activities Cash flow from operating activities is generally derived from the principal revenue producing activities of the business. Cash Flow from Operating Activities is the indicator of success or failure of a business’s operations. If the cash flow from operations is continuously negative, this means that the business revenue is not enough to recover the costs that are incurred to earn it. Therefore, in the long run Cash flow from operations must be positive. Examples of cash flows from operating activities are: • Cash receipt from sale of goods and rendering of services. • Cash receipts from fees, commission and other revenues. • Cash payments to suppliers for goods and services. • Cash payments to and on behalf of the employees. • Cash payments or refunds of income taxes. EXAMPLE Net Profit before Tax 16,514 Add: Adjustment for Non-Cash Items Depreciation for the Year 5,500 Provision for Doubtful Debts 810 Exchange Gain / Loss - Gain / Loss on Disposal of Assets - Return on Investments 4,000 Mark-up on Loans 3,500 Operating Profit Before Working Capital Changes 30,324 Working Capital Changes Add: Decrease in Current Assets 40,000 Less: Increase in Current Assets (50,000) Add: Increase in Current Liabilities - Less: Decrease in Current Liabilities - Cash Generated From Operations 20,324 Less: Markup paid on loans (3,000) Less: Taxes Paid (5,000) Net Cash Flow from Operating Activities 12,324 Cash Flow From Investing Activities Cash flow from investing activities includes cash receipts and payments that arise from Fixed and Long Term assets of the organization. Copyright© Virtual University of Pakistan 47
  • 48.
    Financial Statement Analysis-FIN621 VU Cash Flows from Investing Activities shows the investment trend of the business. If it is negative (Outflow) this means that the company is investing in long term assets and is expanding. On the other hand if it is positive (Inflow) over the years, this means that the company is selling its long term investments. Examples of cash flows from investing activities are: • Cash payments to acquire property plant and equipment. These also include payments made for self-constructed assets. • Cash receipts from sale of property plant and equipment. • Cash payments and receipts from acquisition and disposal of other than long term assets e.g. Shares, debentures, TFC, long term loans given etc. If assets are held for trading purposes or in normal course of business e.g. car / property dealers and loans given by banks, then cash flow from these are included in Operating Cash Flow. EXAMPLE Cash Flow from Investing Activities Add: Disposal of Fixed Asset and Long Term Investments 100,000 Less: Acquisition of Fixed Assets and Long Term Investments (80,000) Add: Dividend Received / Returns on Investment Received - Net Cash Flow from Investing Activities 20,000 Cash Flow From Financing Activities Cash flow from financing activities includes cash receipts and payments that arise from Owners of the business and other long term liabilities of the organization. Cash Flows from Financing Activities shows the behavior of investors (both equity capital and debt capital). A positive figure (inflow) shows that funds are being invested in the company and vice versa. Examples of cash flows from financing activities are: • Cash received from owners i.e. share issue in case of company and capital invested by sole proprietor or partners. • Cash payments to owners i.e. dividend, drawings etc. • Cash receipts and payments for other long term loans and borrowings. EXAMPLE Cash Flow from Financing Activities Add: Shares Issued / Capital Invested 1,000,000 Less: Dividend Paid / Drawings (400,000) Add: Increase in Long Term Borrowings 150,000 Net Cash Flow from Financing Activities 750,000 Procedure Of Preparing Cash Flow Cash Flow Statement is prepared as follows: • We start from the Profit / Loss for the period before taxation. • Adjustments are made for non-cash items that are included in the profit and loss account such as Depreciation, Provisions and other items that relate to investing and financing activities. • This gives us Operating Profit before Working Capital Changes. Copyright© Virtual University of Pakistan 48
  • 49.
    Financial Statement Analysis-FIN621 VU • Then Working Capital Changes, i.e. increase or decrease in items of current assets and liabilities, are added / subtracted (Cash and Cash Equivalents are not included here) • This gives the Cash Flow from Operations. • To this figure, we add / subtract cash flows from investing and financing activities. • This gives us Net Increase / Decrease in Cash and Cash Equivalents. • To this figure we add Opening Balance of Cash and Cash Equivalents (that we excluded from current assets) • This gives us the Closing Balance of Cash and Cash Equivalents. Increase or Decrease is generally taken as difference in opening and closing balances of accounts reported in balance sheets. FORM OF CASH FLOW STATEMENT Name of the Entity Cash Flow Statement for the Period Ending ----- Net Profit before Tax XYZ Add: Adjustment for Non-Cash Items Depreciation for the Year XYZ Provision for Doubtful Debts XYZ Exchange Gain / Loss XYZ Gain / Loss on Disposal of Assets XYZ Return on Investments XYZ Mark-up on Loans XYZ Operating Profit Before Working Capital Changes XYZ Working Capital Changes Add: Decrease in Current Assets XYZ Less: Increase in Current Assets (XYZ) Add: Increase in Current Liabilities XYZ Less: Decrease in Current Liabilities (XYZ) ` Cash Generated From Operations XYZ Less: Markup paid on loans (XYZ) Less: Taxes Paid (XYZ) Net Cash Flow from Operating Activities XYZ Cash Flow from Investing Activities Add: Disposal of Fixed Asset and Long Term Investments XYZ Less: Acquisition of Fixed Assets and Long Term Investments (XYZ) Add: Dividend Received / Returns on Investment Received XYZ Net Cash Flow from Investing Activities XYZ Cash Flow from Financing Activities Add: Shares Issued / Capital Invested XYZ Less: Dividend Paid / Drawings (XYZ) Add: Increase in Long Term Borrowings XYZ Net Cash Flow from Financing Activities XYZ Net Increase / Decrease in Cash and Cash Equivalents XYZ Add: Opening Balance of Cash and Cash Equivalents XYZ Closing Balance of Cash and Cash Equivalents XYZ IV) Statement of cash flows. This final Financial Statement provides net results of cash inflows (receipts) and cash outflows (payments) during an accounting period. Banks/creditors/investors look for Copyright© Virtual University of Pakistan 49
  • 50.
    Financial Statement Analysis-FIN621 VU this statement, because it gives them a picture of net cash flow of the business. As already explained, positive net income (profit) does not necessarily mean increase in cash. Therefore such statement must be prepared in order to depict actual cash position. It is clear that a highly profitable business may also go bankrupt. Therefore profitability does not necessarily mean solvency i.e. ability to pay debts and obligations. This fact gives rise to the need for preparing cash flow statement. Parts of cash flow statement Cash “flows” through a business during accounting period by Cash & Cash equivalent (T- bills, saving certificates, bonds etc), and through operating activities which include, producing or delivering goods for sale and providing services, and also cash effects of transactions and other events that determine net income. For example Cash flows/collections from sales and interest and dividends received would be cash Inflows. Similarly, purchase of inventories and payment of operating expenses would constitute cash outflows. Generating positive cash from operations is the preferred method to finance capital expenditure, debt repayments and dividend payments. The third method or process by which cash “flows” through a business is the group of its activities called investing activities which include short-term investments, acquiring/disposing of securities, acquiring/disposing of plant assets, and lending money/collecting loan. The fourth method or process of cash flow is the group of activities called “Financial” activities which include borrowings from creditors/repaying the principal, obtaining resources from owners, and providing owners with return on investment. The fifth method or process of cash flow in a business is of course the effect of exchange rate fluctuations on cash. To prepare cash flow statement, look at changes in all of balance sheet accounts from beginning to end of accounting period, and transfer the changes to appropriate area of cash flow statement. Cash Flow from operating activities. Inflows in this case are: - cash collections from customers, Interest/dividends collected, and other operating cash receipts e.g. proceeds from litigations. Outflows would be, cash paid to suppliers & employees, interest & taxes paid and other operating cash payments e.g. payments in litigations. It should be noted that receipt and payment of interest are classified as operating activities and not investing or financing activities. Net of the “Inflows” and “Outflows”, gives cash flow from operating activities. Cash flow from investing activities: Inflows in this case are proceed from sales of Certificates/ Securities, proceeds from sales of Plant assets, and collection of loans (principal). Outflows here would be purchase of Certificates/Securities, purchase of plant assets, and loans made to borrowers. Copyright© Virtual University of Pakistan 50
  • 51.
    Financial Statement Analysis-FIN621 VU Net of ‘Inflows’ and ‘Outflows’ gives cash flow from investing activities. Cash flow from financing activities Here, the ‘Inflows’ are proceeds from borrowings, proceeds from issuing “bonds payable”, and proceeds from issuing capital stock. Outflows correspondingly are payment to settle debts (principal), and payment of dividends. Net of ‘Inflows’ and ‘Outflows’, gives cash provided by financing activities. Sum of net cash flows from all the three activities viz Operating, Investing and Financing gives overall cash flow during the accounting period. Analysis of Cash Flow Statement determines firm’s ability to generate cash from operations, its capacity to meet cash obligations and its future financing needs. It indicates firm’s success in investing activities, and determines the magnitude, fluctuations and causes of the positive or negative operating cash flow. Copyright© Virtual University of Pakistan 51
  • 52.
    Financial Statement Analysis-FIN621 VU Lesson-13 STATEMENTS OF CASH FLOWS (Continued) Preparing Cash Flows Ledgers are maintained on accrual basis; not on cash basis. Preparing Cash Flow involves converting accrual-based accounts into cash-based. In small business, cash flow statement is prepared directly from special journals for cash receipts and cash payments. For most businesses, such statement is prepared by analyzing Income Statement and balance sheet. Analyzing Income Statement involves re-arrangement of its items/Accounts in two major groups viz (i) Sales, other income and gains, and (ii) Cost of sales, other expenses and losses. These cover Operating and Investing Activities. Analyzing balance sheet involves looking at changes in all of balance sheet accounts (except cash) from beginning to end of accounting period, and transferring these changes to appropriate area of cash flow statement. ↑ Asset Account Dr. Asset Accounts ↓ Cr ↑ Liabilities Account Cr Liability Accounts ↓ Dr ↑ Owner’s Equity Account Cr Owner’s Equity A/C ↓ Dr The arrow ↑ shows increases, and ↓ shows decreases. It has to be determined whether a certain increase or decrease (which is debited or credited in ledger accounts involves cash inflow or cash outflow. For example decrease in Asset Account other than cash shows either collection of Accounts Receivable or sale of fixed assets, which results in Cash Inflow. Similarly increases in Assets say fixed assets would imply purchase of fixed assets and hence cash outflow. Practical exercise: Consider the following Income Statement of a business. MOOSA CORPORATION INCOME STATEMENT FOR THE YEAR ENDED JUNE 30, _____ Rs.____ Net sales 900,000 Cost of Goods sold 500,000 Gross Profit 400,000 Operating expenses 300,000 (Includes depreciation Rs.40, 000) Operating Profit (EBIT) 100,000 Other expenses Interest 35,000 Loss on sale of marketable securities 4,000 39,000 Profit before tax (EBT) 61,000 Income tax expenses 36,000 Profit after tax 25,000 Copyright© Virtual University of Pakistan 52
  • 53.
    Financial Statement Analysis-FIN621 VU Other Income Dividend revenue 3,000 Interest revenue 6,000 Gain on sale of plant assets 31,000 40,000 _______ Net Income 65,000 Copyright© Virtual University of Pakistan 53
  • 54.
    Financial Statement Analysis-FIN621 VU Lesson-14 STATEMENTS CASH FLOWS (Continued) Additional Information (AI) obtained from analysis of changes in the balance sheet accounts during the current year:- Cash & Cash equivalents at beginning of the year Rs.40, 000 at end of the year Rs.75, 000 Other additional information classified into the three categories i.e. Operating, Investing and Financing Activities, was as follows:- Additional Information relating to Operating Activities 1. Accounts Receivable increased by Rs.30, 000. 2. Accrued interest i.e. interest receivable decreased by Rs.1, 000 (Dividend revenue recognized on cash basis & interest revenue on accrual basis). 3. Inventory increased by Rs.10, 000 and accounts payable by Rs.15, 000. 4. Short-term prepared expenses increased by Rs.3, 000. 5. Accrued expenses (payable) decreased by Rs.6, 000. 6. Depreciation for the year Rs.40, 000. 7. Interest payable increased by Rs.7, 000. 8. Income tax payable decreased by Rs.2, 000. Additional Information relating to Investing Activities 1. Marketable Securities (not qualifying as cash equivalent) show debit entries of Rs.65,000 and credit entries of Rs.44,000. 2. Notes Receivable Account shows Rs.17, 000 debit and Rs.12, 000 credits. 3. Purchase of plant assets for Rs.200,000: Cash Rs.160,000 and long-term Note Payable Rs.40,000 4. Sale of plant assets with book value Rs.44,000 Additional Information relating to Financing Activities 1. Borrowed Rs.45, 000 cash by issuing short-term Notes Payable. 2. Repaid Rs.55, 000 on account of principal on Loans & Notes Payable. 3. Issued bonds payable Rs.100, 000 cash. 4. Issued for cash 1000 shares of Rs.10 par value at Rs.50 per share. 5. Cash dividend paid Rs.40,000 Re-arranging Income Statement in the two categories of Operating and Investing Activities would give the following picture of the Income Statement: MOOSA CORPORATIAON Income statement For the year ended June 30, ________ Sales, other revenue and gains Rs._____ Net sales 900,000 Dividend Revenue 3,000 Copyright© Virtual University of Pakistan 54
  • 55.
    Financial Statement Analysis-FIN621 VU Interest Revenue 6,000 Gain on sales of plant assets 31,000 Total 940,000 Cost of sales, other expenses and losses Cost of goods sold 500,000 Operating expenses 300,000 (Includes Dep of Rs. (40, 000) Interest expenses 35,000 Income tax expenses 36,000 Loss on sale of marketable securities 4,000 Total 875,000 Net Income 65,000 Copyright© Virtual University of Pakistan 55
  • 56.
    Financial Statement Analysis-FIN621 VU Lesson-15 FINANCIAL STATEMENTS (Continued) Cash flow from Operating Activities Study computation of net sales, cost of goods sold and interest expense etc. On Income Statement. Cash received from customers; Cash received from sales on cash = Net Sales; Cash received from sales on credit/on account = Net sales – increase in Accounts Receivable or Net sales + decrease in Accounts Receivable. Increase/decrease in Accounts Receivable is observed from beginning and ending/closing balances, appearing on Balance Sheet. (A1 No:1): Cash received from customers = 900,000 – 30,000 = Rs.870,000 A1 No:2 Cash dividend received = Dividends Revenue =Rs.3,000: Divided Revenue is based on cash, so whatever Dividend Revenue is being received, that in cash Inflows. Cash interest received=Interest Revenue + Decrease in Interest Receivable, or Interest Revenue – Increase in Interest Receivable = 6000 + 1000 = 7000 Interest & Dividend received = 3,000 + 7,000 = 10,000 Cash Inflow from operating activities would be: Cash from customers + interest & dividends receivable = 870,000 + 10,000 = Rs. 880,000 CASH FLOW STATEMENT CONTD……… QUESTION # 1 You are given the Balance Sheet of ABC Limited as at June 30, 2001 and June 30, 2002 and its Profit and Loss Account for the year ended June 30 2002. Required You are required to prepare Cash Flow Statement for the given period. ABC Ltd Balance Sheet As At June 30 2002 2002 Rs. 2001 Rs. Rs. ‘000 Rs. ‘000 Building at Cost 181,000 140,000 Accumulated Depreciation 36,000 30,000 Written Down Value 145,000 110,000 Plant and Machinery cost 83,000 90,000 Accumulated Depreciation 36,000 35,000 Written Down Value 47,000 55,000 Copyright© Virtual University of Pakistan 56
  • 57.
    Financial Statement Analysis-FIN621 VU Total Fixed Assets at WDV 192,000 165,000 Long Term Investment 17,000 10,000 Current Assets Debtors 30,000 21,000 Stock 25,000 40,000 Short Term Deposits 18,000 15,000 Cash and Bank 30,000 24,000 103,000 100,000 Current Liabilities Creditors 15,000 12,000 Proposed Dividend 18,000 16,000 Tax Payable 9,000 8,000 42,000 36,000 Working Capital 61,000 64,000 Net Assets Employed 270,000 239,000 Financed By Share Capital 180,000 160,000 Share Premium Account 17,000 12,000 General Reserve 23,000 20,000 Accumulated Profit and Loss 34,000 27,000 Share Holders’ Equity 254,000 219,000 Term Finance Certificates 16,000 20,000 Total 270,000 239,000 Copyright© Virtual University of Pakistan 57
  • 58.
    Financial Statement Analysis-FIN621 VU ABC Ltd Profit and Loss Account For the Year Ended June 30 2002 Rs. ‘000 Sales 300,000 Cost of Sales (231,000) Gross Profit 69,000 Other Income 4,000 73,000 Less: Administrative Expenses Director’s Remuneration 4,000 Depreciation on Building 6,000 Loss on Sale of Machinery 2,000 Other Administrative Expenses 12,000 24,000 Less: Selling Expenses 10,000 Less: Mark up on TFC 2,000 Profit for the Year Before Tax 36,000 Provision for tax 37,000 Profit after tax 9,000 Acc. Profit Brought Forward 28,000 27,000 55,000 Appropriation Transfer to Reserve 3,000 Proposed Dividend 18,000 21,000 Accumulated Profit Carried Forward 34,000 Additional Information 1. Other income include dividend on Long Term Investment 2. Cost of goods sold includes depreciation for the year on machinery Rs. 5,000. 3. Accumulated Depreciation on the machine disposed off amounts to Rs. 4,000. Copyright© Virtual University of Pakistan 58
  • 59.
    Financial Statement Analysis-FIN621 VU SOLUTION ABC Ltd Cash Flow Statement For the Year Ended June 30 2002 Note Rs. ‘000 Net Profit Before Tax 37,000 Adjustment of Non Cash Items Depreciation 11,000 Loss on Sale of Machinery 2,000 Markup on TFC 2,000 52,000 Less: Other Income (4,000) Operating Profit Before Working Capital Changes 48,000 Working Capital Changes Reduction in Stock 15,000 Increase in Creditors 3,000 Increase in Debtors (9,000) 9,000 Cash Flow from Operations 57,000 Markup on TFC Paid (2,000) Tax Paid 1 (8,000) Net Cash Flow From Operating Activities 47,000 Cash Flow From Investing Activities Dividend Received 4,000 Payment to Acquire Investments 2 (7,000) Purchase of Fixed Assets (Building) 3 (41,000) Receipt from Sale of Assets 4 1,000 Net Cash Flow From Investing Activities (43,000) Cash Flow From Financing Activities Issue of Ordinary Shares 20,000 Share Premium Account 5,000 Dividend Paid 5 (16,000) Repayment of TFC 6 (4,000) Net Cash Flow From Financing Activities 5,000 Net Increase / (Decrease) in Cash and Cash Equivalents During The Year 9,000 O/B of Cash and Cash Equivalents 39,000 C/B of Cash and Cash Equivalents 48,000 Copyright© Virtual University of Pakistan 59
  • 60.
    Financial Statement Analysis-FIN621 VU Note # 1 Tax Paid Provision for Tax Account Code -------- Particulars Amount Particulars Amount Dr. (Rs.) Cr. (Rs.) Cash 8,000 Bal. B/F 8,000 Balance c/f 9,000 For the year 9,000 Total 17,000 Total 17,000 Note # 2 Payments to Acquire Investments Investment Account Code -------- Particulars Amount Particulars Amount Dr. (Rs.) Cr. (Rs.) Bal. B/F 10,000 Cash 7,000 Bal. C/F 17,000 Total 17,000 Total 17,000 Note # 3 Purchase of Fixed Assets Building Cost Account Code -------- Particulars Amount Particulars Amount Dr. (Rs.) Cr. (Rs.) Bal. B/F 140,000 Cash 41,000 Bal. C/F 181,000 Total 181,000 Total 181,000 Note # 4 Sale Proceed of Machinery Machinery at Cost Account Code -------- Particulars Amount Particulars Amount Dr. (Rs.) Cr. (Rs.) Bal. B/F 90,000 Disposal A/c 7,000 Bal. C/F 83,000 Total 90,000 Total 90,000 Copyright© Virtual University of Pakistan 60
  • 61.
    Financial Statement Analysis-FIN621 VU Disposal of asset Account Code -------- Particulars Amount Particulars Amount Dr. (Rs.) Cr. (Rs.) Cost 7,000 Accumulated Dep. 4,000 Loss on Sale 2,000 Sale Proceed 1,000 Total 7,000 Total 7,000 Note # 5 Dividend Payable Dividend Payable Account Code -------- Particulars Amount Particulars Amount Dr. (Rs.) Cr. (Rs.) Cash 16,000 O/B 16,000 For the Year 18,000 C/B 18,000 Total 34,000 Total 34,000 Note # 6 Repayment of TFC TFC Account Account Code -------- Particulars Amount Particulars Amount Dr. (Rs.) Cr. (Rs.) Cash 4,000 O/B 20,000 C/B 16,000 Total 20,000 Total 20,000 Copyright© Virtual University of Pakistan 61
  • 62.
    Financial Statement Analysis-FIN621 VU Lesson-16 FINANCIAL STATEMENTS (Continued) Cash payment for Merchandise = Cost of Goods Sold + increase in Inventory + Decrease in Accounts Payable, or Cost of Goods sold – Decrease in Inventory – Increase in Accounts Payable. Keeping in view, A1 No.3; cash payment for merchandise= 500,000 + 10,000 - 15000 = Rs.495, 000 A1 No.4, 5 & 6 Pre Paid expenses increased by Rs.3, 000, therefore cash payment exceeded the actual expense. Accrued expenses (Payable) decreased by Rs.6000, therefore cash payment exceeded the actual expense (includes employees’ expenses). Depreciation of Rs.40, 000 requires no cash payment but it does increase total expenses. It is therefore deducted from operating expenses. Cash payment for operating expenses = expenses + increase in Pre Paid expenses + decrease in Accrued Expenses – Depreciation= 300,000 + 3,000 + 6000 - 40,000 = Rs.269, 000 Cash paid for merchandise and operating expenses= 495,000+269,000 = Rs.764, 000 Cash payment for interest: (A17) accrued interest liability (interest payable) increased by Rs.7, 000. It means that not all of the interest expense shown in Income Statement was paid in cash. Interest expenses in Income Statement 35,000. From this, reduce the increase in related accrued liability i.e. 7,000. That means interest paid in cash was Rs. 28,000. Cash payment for Income Tax (A1 8) Tax liability reduced by Rs.2, 000/-. It means that cash payment is greater than expense shown in Income Statement. Tax expenses in Income Statement are Rs.36, 000. Add to this the reduction in tax liability, i.e. Rs. 2,000/-. Therefore Income tax paid in cash comes to Rs.38, 000/-. Operating Activities’ portion of cash flow statement Rs.____ Cash received from customers 870,000 Interest & dividend received 10,000 Cash inflow 880,000 Cash paid to suppliers (Merchandise) & operating (764,000) Expenses (including employees) Interest paid (28,000) Income tax paid (38,000) Cash (out flow) (830,000) Net cash flow from Operating Activities 50,000 Note that net income reported on Income Statement Rs.65, 000 and net cash flow from Operating Activities Rs.50, 000. What are the reasons for difference of Rs.15, 000? Reasons are: depreciation expense (reduces net income but not cash) and adjustments made to net sales, cost of goods sold and expenses, and non operating gains & losses (these affect cash flow relating to Investing & Financing Activities) Copyright© Virtual University of Pakistan 62
  • 63.
    Financial Statement Analysis-FIN621 VU Lesson-17 FINANCIAL STATEMENTS (Continued) Cash flow from Investing Activities: Much information is obtained from changes in related Asset Accounts. Purchase & Sale of Marketable Securities (AI No: 1) Dr in Marketable Securities A/C shows Purchases, and hence cash outflow of Rs.65, 000. Cr of Rs.44, 000 in the A/C shows sale and hence cash inflow. Income Statement shows loss of Rs.4, 000 on these sales. Therefore cash proceeds from sales = Rs.40, 000 i.e. 44,000 – 4,000 (loss). Loans made to borrowers (AI No: 2) Dr in Notes Receivable shows Loans given and hence outflow of Rs.17, 000. Cr in Notes Receivable shows Loans collected and hence cash inflow of Rs.12, 000. It should be re-emphasized that the amount involved here is on account of Principal of loans. Interest, as already stated is credited to Interest Revenue Account and is included in Operating Activities. Cash paid to acquire plants (AI No: 3) Cash paid to acquire new plants shows cash outflow (160,000); sale of plant assets with book value of Rs.44, 000 shows cash Inflow. Income statement shows gain of Rs.31, 000 on this. This means that cash proceeds from sale of plant assets amounted to Rs.75, 000/-. Investing Activities’ portion of cash flow statement would be:- Purchase of Marketable securities (65,000) Loans made to borrowers (17,000) Purchase of plant assets (160,000) (242,000) Proceeds from sale of securities 40,000 Collection of Loans 12,000 Proceeds from sale of plant assets 75,000 127,000 Net cash flow from Investing Activities (115,000) Cash flow from financing Activities (A 1 No.1 to 5) Proceeds from short-term borrowings in lieu of Notes Payable show cash inflow of Rs.45, 000. Payments to settle debts shows cash outflow of Rs.55, 000/-. Proceeds from issuing bonds show cash inflow of Rs.100,000 and proceeds from issuing capital stock also show cash inflow of Rs.50,000 (1000 shares x Rs.50/share) Divided paid, of course involves cash outflow of Rs.40,000. Financing Activities’ portion of cash flow statement would be: Rs._____ Proceeds from short-term borrowings 45,000 Proceeds from issuing bonds payable 100,000 Proceeds from issuing capital stock 50,000 195,000 Payment to settle short-term debts (55,000) Dividends paid (40,000) (95,000) Net cash flow from financing activities 100,000 Net increase (decrease) in cash Copyright© Virtual University of Pakistan 63
  • 64.
    Financial Statement Analysis-FIN621 VU Rs.____ Net cash flow from Operating Activities 50,000 Net cash flow from Investing Activities (115,000) Net cash flow from Financing Activities 100,000 Net increase (decrease) in cash 35,000 Cash & Cash equivalent beginning of the year 40,000 Cash & Cash equivalent end of the year 75,000 (tallies with the first item on ===== Additional Information Sheet) Note that net cash flow from Operating Activities is Rs.50, 000 against net income of Rs.65, 000 shown on Income Statement. MOOSA CORPORATION Statement of Cash Flows For the Year Ended June 30, _____ Cash Flows from operating activities: Rs. Cash received from customers …………………….….. 870,000 Interest and dividends received …………………..….. 10,000 Cash provided by operating activities ……… …………………… 880,000 Cash paid to suppliers and operating expenses..…. (764,000) Interest paid ………………………………………….. (28,000) Income taxes paid …………………………………. (38,000) Cash disbursed for operating activities ………………………………. (830,000) Net cash flow from operating activities ……………………………… 50,000 Cash flows from investing activities: Purchases of marketable securities (65,000) Proceeds from sales of marketable securities ……… 40,000 Loans made to borrowers ………………………………… (17,000) Collections on loans …………………………………… 12,000 Purchases of plants assets ………………………………. (160,000) Proceeds from sales of plant assets ………………… 75,000 Net cash used by investing activities…………………………… (115,000) Cash flows from financing activities: Proceeds from short-term borrowing ……………….. 45,000 Payments to settle short-term debts ……………….. (55,000) Proceeds from issuing bonds payable …………….. 100,000 Proceeds from issuing capital stock ……………….. 50,000 Dividends paid …………………………………………… (40,000) Net cash provided by financing activities…………………………….. 100,000 Net increase (decrease) in cash ……………………………………….. 35,000 Cash and cash equivalents, beginning of year ……………………. 40,000 Cash and cash equivalents, end of year ……………………………. 75,000 Copyright© Virtual University of Pakistan 64
  • 65.
    Financial Statement Analysis-FIN621 VU Lesson-18 NOTES TO FINANCIAL STATEMENTS (Continued) Notes to Financial Statements: These are integral part of the Financial Statements, which provide summary of accounting policies, adopted by Management in preparation of Accounts and preparing Financial Statements there from. These also present details about particular accounts (e.g. inventory, investments etc). Notes to Financial Statements also include other information e.g. leasing arrangements, pending legal proceedings, income taxes etc. Information by segment for firms with several lines of business is also given in these Notes. Notes to the accounts are the explanatory notes of all the items shown in the profit and loss account and the balance sheet. It is the requirement of the Companies Ordinance and the International Accounting Standards. Following are explained in Notes to the accounts: o Nature of business of the company o Accounting Policies of the company o Details and explanation of items given in the Profit and Loss Account and Balance Sheet. Accounting Policies The two major areas of Accounting Policies are Inventory and Depreciation of Plant Assets. Inventory: This consists of items held for sale or used in manufacture of products that would be sold. Inventory in merchandising business consists of goods owned and held for sale. This is called Merchandise. Inventory in manufacturing business consists of three parts i.e. raw material, work-in- process and finished goods. Inventory is an Asset which is shown at cost in balance sheet. Inventory Accounting Policies Before we discuss Accounting Policies regarding Inventory, let us discuss the following three types of maintaining and recording inventory:- a) Perpetual inventory system. This is most widely used: In this, the transactions are recorded as they occur. The flow would be as follows:- Purchase of → Dr. Current → Merchandise → Dr. Cost of → Cr. Inventory Merchandise Assets sold good sold “Inventory” Cr. Cash or Cr. Revenue Dr. Cash or A/C payable A/C Receivable In a perpetual inventory system, merchandising transactions are recorded as they occur. The system draws its name from the fact that the accounting records are kept perpetually up-to-date. Purchase of merchandise is recorded by debiting an asset account entitled inventory. When merchandise is sold, two entries are necessary: One to recognize the revenue earned and the second to recognize the related cost of goods sold. This second entry also reduces the balance of inventory account to reflect the sale of some of the company’s inventory. A perpetual inventory system uses an inventory subsidiary ledger. This ledger provides company personnel with up-to-date information about each type of product that the company buys and sells, including the per-unit cost and the number of units purchased, sold, and currently on hand. Copyright© Virtual University of Pakistan 65
  • 66.
    Financial Statement Analysis-FIN621 VU b) Periodic inventory system: In this case, accounting records are updated periodically – usually at year’s end: “Cost of goods sold” is also determined at year’s end. The flow in this case would be as follows:- Purchase of → Dr. Purchase → Merchandise → No entry for “cost of goods sold” Merchandise A/C sold or inventory. This is done at years end. Cr. Cash or Cr. Revenue Dr. Cash or A/C A/C Payable Receivable Complete physical inventory is taken at year’s end as follows:- Opening balance (year’s beginning) 12,000 + Purchases. 130,000 Inventory available. 142,000 Less closing balance (year’s end). 8,000 Inventory used/sold. 134,000 This i.e. Rs.134, 000 is “cost of goods sold”, charged to Income Statement, and closing inventory is Rs.8, 000 recorded on balance sheet. Both entries are recorded at year’s end. Assumptions under this method are that all units of inventory were acquired at the same unit costs. “Taking physical inventory” at or near year-end also takes into account Inventory Shrinkage (breakage, spoilage, theft), which is written off to Income Statement in the form of “losses”. A periodic inventory system is an alternative to a perpetual inventory system. In a periodic inventory system, no effort is made to keep up-to-date records of either the inventory or the cost of goods sold. Instead, these amounts are determined only periodically, usually at the end of each year. A traditional periodic inventory system operates as follows. When merchandise is purchased, its cost is debited to an account entitled purchases, rather than to the inventory account. When merchandise is sold, an entry is made to recognize the sales revenue, but no entry is made to record the sost of goods sold or to reduce the balance of the inventory account. As the inventory records are not updated as transactions occur, there is no inventory subsidiary ledger. The foundation of the periodic inventory system is the taking of a complete physical inventory at year- end. This physical count determines the amount of inventory appearing in the balance sheet. The cost of goods sold for the entire year then is determined by a short computation. c) Just in time (JIT) Inventory System. In this case, the purchase of merchandise or raw materials and component parts is done just in time for sale or for use in manufacture; often a few hours, before the manufacture or sale. It involves completing the manufacturing process just in time to dispatch finished goods. It reduces money “tied-up” in inventory of raw material and finished goods. There is no need to maintain large inventory storage facilities. But the disadvantage is that delay in arrival of raw material may halt operations. Just-in-time (JIT) inventory systems are not a simple method that a company can adopt; it has a whole philosophy that the company must follow in order to avoid its downsides. The ideas in this philosophy come from many different disciplines including statistics, industrial engineering, production management and behavioral science. In the JIT inventory philosophy there are views with respect to how inventory is looked upon, what it says about the management within the company, and the main principle behind JIT. Copyright© Virtual University of Pakistan 66
  • 67.
    Financial Statement Analysis-FIN621 VU Inventory is seen as incurring costs, or waste, instead of adding value, contrary to traditional thinking. This does not mean to say that JIT is unaware that removing inventory exposes manufacturing issues. Under the philosophy, businesses are encouraged to eliminate inventory that doesn’t compensate for manufacturing issues, and to constantly improve processes so that inventory can be removed. Secondly, allowing any stock habituates the management to stock and it can then be a bit like a narcotic. Management is then tempted to keep stock there to hide problems within the production system. These problems include backups at work centers, machine reliability, and process variability, lack of flexibility of employees and equipment, and inadequate capacity among other things. In short, the just-in-time inventory system is all about having “the right material, at the right time, at the right place, and in the exact amount” but its implications are broad for the implementors. Criticisms Shocks JIT emphasizes inventory as one of the seven wastes, and as such its practice involves the philosophical aim of reducing input buffer inventory to zero. Zero buffer inventories means that production is not protected from exogenous (external) shocks. As a result, exogenous shocks reducing the supply of input can easily slow or stop production with significant negative consequences. Transaction Cost Approach JIT reduces inventory in a firm, however unless it is used throughout the supply chain, then it can be proposed that firms are simply outsourcing their input inventory to suppliers. Implementation Effects Some of the initial results at vehicle manufacturing company were horrible, but in contrast to that a huge amount of cash appeared, apparently from nowhere, as in-process inventory was built out and sold. This by itself generated tremendous enthusiasm in upper management. Another surprising effect was that the response time of the factory fell to about a day. This improved customer satisfaction by providing vehicles usually within a day or two of the minimum economic shipping delay. Also, many vehicles began to be built to order; completely eliminating the risk they would not be sold. This dramatically improved the company's return on equity by eliminating a major source of risk. . Benefits As most companies use an inventory system best suited for their company, the Just-In-Time Inventory System (JIT) can have many benefits resulting from it. The main benefits of JIT are listed below. 1. Set up times is significantly reduced in the warehouse. Cutting down the set up time to be more productive will allow the company to improve their bottom line to look more efficient and focus time spent on other areas that may need improvement. 2. The flows of goods from warehouse to shelves are improved. Having employees focused on specific areas of the system will allow them to process goods faster instead of having them vulnerable to fatigue from doing too many jobs at once and simplifies the tasks at hand. 3. Employees who possess multiple skills are utilized more efficiently. Having employees trained to work on different parts of the inventory cycle system will allow companies to use workers in situations where they are needed when there is a shortage of workers and a high demand for a particular product. Copyright© Virtual University of Pakistan 67
  • 68.
    Financial Statement Analysis-FIN621 VU 4. Better consistency of scheduling and consistency of employee work hours. If there is no demand for a product at the time, workers don’t have to be working. This can save the company money by not having to pay workers for a job not completed or could have them focus on other jobs around the warehouse that would not necessarily be done on a normal day. 5. Increased emphasis on supplier relationships. No company wants a break in their inventory system that would create a shortage of supplies while not having inventory sit on shelves. Having a trusting supplier relationship means that you can rely on goods being there when you need them in order to satisfy the company and keep the company name in good standing with the public. 6. Supplies continue around the clock keeping workers productive and businesses focused on turnover. Having management focused on meeting deadlines will make employees work hard to meet the company goals to see benefits in terms of job satisfaction, promotion or even higher pay. Copyright© Virtual University of Pakistan 68
  • 69.
    Financial Statement Analysis-FIN621 VU Lesson-19 NOTES TO FINANCIAL STATEMENTS (Continued) Charging Costs of Inventory to Income Statement This is also known as cost flows of inventory. Inventory units may be acquired at different costs because of different purchase dates or different suppliers. Question is: Which of these costs are to be used as “cost of goods sold”? Purchase/ → Balance sheet → sale of goods → cost of → Income Manufacture current assets. Good Statement Cost of inventory sold (?) Measuring “cost of goods sold” involves valuation and pricing of Inventory and this is determined by Inventory Accounting Policies. As on example consider that 2 ACs were purchased in January @ Rs.20, 000 each, and 3 @ Rs.25, 000 each in February. One AC was sold in March. What would be the cost of goods sold: Rs.20, 000 or Rs.25, 000? Two approaches can be adopted in this case i.e. specific identification and cost-flow assumptions. Either is acceptable but an approach once selected, is to be applied consistently. In specific identification approach, the Units are identified specifically, which clearly shows as to which particular unit is being sold and what was its cost, which would be its “cost of goods sold”. A Note on the Impact of Inventory Levels on Net Income Fluctuations in inventory levels can cause profit variations when inventory is valued according to GAAP standards. GAAP standards require that all manufacturing costs must be capitalized in inventory regardless of whether the costs are variable or fixed. The inclusion of fixed costs in the unit cost causes profits to rise as inventory levels raise because the fixed cost in inventory is stored on the balance sheet instead of being carried over to the income statement. When the inventory level falls, this fixed cost that has been stored on the balance sheet is moved over to the income statement thereby causing net profit to fall. To illustrate this phenomenon I first present a one month income statement constructed using only variable costs in inventory (in this case, materials only). Sales $1,837,380 Cost of materials 458,000 Margin 1,379,380 Expenses Labor 224,000 Overhead 344,288 Depreciation 270,000 Copyright© Virtual University of Pakistan 69
  • 70.
    Financial Statement Analysis-FIN621 VU Administrative 210,000 Marketing 175,000 Total expenses 1,223,288 Profit before taxes 156,092 Income taxes @ 35% 54,632 Net Profit $101,460 Computation of Unit Values Sales Flow Valves Pumps Controllers Total Units 7,500 12,500 4,000 24,000 Selling Price $57.78 $81.26 $97.07 $1,837,380 Material cost 16.00 20.00 22.00 458,000 Unit margin 41.78 61.26 75.07 Total margin $313,350 $765,750 $300,280 $1,379,380 Next I show two income statements for two months with the identical sales as in the first income statement that uses only variable costs in inventory. However, in these two income statements the inventory levels change; in the Month 1 statement the inventory of Valves rises by 1,000 units, and in the Month 2 statement Valve inventory falls by 1,000 units. Month 1 Flow Valves Pumps Controllers Total Unit Sales 7,500 12,500 4,000 24,000 Units Produced 8,500 12,500 4,000 25,000 Ending Inv. 1,000 0 0 1,000 Unit cost 37.75 48.87 100.57 Sales Price $57.78 $81.26 $97.07 Dollar sales 433,350 1,015,750 388,280 1,837,380 Income Statement Sales $1,837,380 Cost of goods sold Begin inv. 0 Costs added Materials 474,000 Labor 155,600 Overhead 682,688 Total costs added 1,312,288 Goods available 1,312,288 Ending inv. 1,000 37,749 Cost of goods sold 1,274,539 Gross Profit 562,841 Copyright© Virtual University of Pakistan 70
  • 71.
    Financial Statement Analysis-FIN621 VU Administrative 210,000 Marketing 175,000 Total expenses 385,000 Profit before taxes 177,841 Income taxes @ 35% 62,244 Net Profit $115,597 Month 2 Flow Valves Pumps Controllers Total Unit Sales 7,500 12,500 4,000 24,000 Units Produced 6,500 12,500 4,000 23,000 Unit cost 37.75 48.87 100.57 Sales Price $57.78 $81.26 $97.07 Dollar sales 433,350 1,015,750 388,280 1,837,380 Income Statement Sales $1,837,380 Cost of goods sold Begin inv. 37,749 Costs added Materials 442,000 Labor 155,600 Overhead 682,688 Total costs added 1,280,288 Goods available 1,318,037 Ending inv. 0 0 Cost of goods sold 1,318,037 Gross Profit 519,343 Administrative 210,000 Marketing 175,000 Total expenses 385,000 Profit before taxes 134,343 Income taxes @ 35% 47,020 Net Profit $87,323 Copyright© Virtual University of Pakistan 71
  • 72.
    Financial Statement Analysis-FIN621 VU Notice how the net incomes changed from one month to the next even though sales remained the same. This example used activity based costs for costing the units of product, but any costing method that assigns fixed costs to units will give the same result. To more clearly show why the incomes differ, consider the following table that shows variable unit costs and the unit fixed costs assigned to the units by the ABC costing system. Flow Valves Pumps Controllers ABC unit cost $37.75 $48.87 $100.57 Unit variable cost 16.00 20.00 22.00 Fixed cost per unit 21.75 28.87 78.57 Times x Inventory change in units 1,000 Equals--Difference in pre$21,749 tax income Profit before taxes--unit$156,092 variable costs Profit before taxes--ABC177,841 unit costs Month 1 Difference in profit before(21,749) taxes Profit before taxes--unit$156,092 variable costs Profit before taxes--ABC134,343 unit costs Month 2 Difference in profit before$21,749 taxes The difference between the net income before taxes for the income statement with variable costs and the one with the ABC costs is always explained by the unit change in inventory multiplied by the fixed overhead per unit. Inventory Errors and Financial Statements Income statement effects. An incorrect inventory balance causes an error in the calculation of cost of goods sold and, therefore, an error in the calculation of gross profit and net income. Left unchanged, the error has the opposite effect on cost of goods sold, gross profit, and net income in the following accounting period because the first accounting period's ending inventory is the second period's beginning inventory. The total cost of goods sold, gross profit, and net income for the two periods will be correct, but the allocation of these amounts between periods will be incorrect. Since financial statement users depend upon accurate statements, care must be taken to ensure that the inventory balance at the end of each accounting period is correct. The chart below identifies the effect that an incorrect inventory balance has on the income statement Copyright© Virtual University of Pakistan 72
  • 73.
    Financial Statement Analysis-FIN621 VU Impact of Error on Error in Inventory Cost of Goods Sold Gross Profit Net Income Ending Inventory Understated Overstated Understated Understated Overstated Understated Overstated Overstated Beginning Inventory Understated Understated Overstated Overstated Overstated Overstated Understated Understated Balance sheet effects. An incorrect inventory balance causes the reported value of assets and owner's equity on the balance sheet to be wrong. This error does not affect the balance sheet in the following accounting period, assuming the company accurately determines the inventory balance for that period. Impact of Error on Error in Inventory Assets = Liabilities + Owner's Equity Understated Understated No Effect Understated Overstated Overstated No Effect Overstated Financial Statements with Inventory The statement of owner's equity and the statement of cash flows are the same for merchandising and service companies. Except for the inventory account, the balance sheet is also the same. But a merchandising company's income statement includes categories that service enterprises do not use. A single-step income statement for a merchandising company lists net sales under revenues and the cost of goods sold under expenses. Copyright© Virtual University of Pakistan 73
  • 74.
    Financial Statement Analysis-FIN621 VU Lesson-20 NOTES TO FINANCIAL STATEMENTS (Continued) In cost-flow assumptions, three methods for measuring “cost of good sold”, under GAAP are used. In these three methods, assumptions are made as to the sequence in which units were withdrawn from inventory. The three flow assumptions are:- i) Average cost: Values all merchandise (units sold and in balance) at the Average per-unit cost, under the assumption of random withdrawal of inventory units. Average cost in the above example: Rs.23, 000 per AC. That would be the cost of goods sold. Ending Inventory to be recorded on balance sheet would also take into account this figure of reduction in Inventory. ii) First-in-First - out (FIFO): goods sold are assumed to be the first units that were purchased. iii) Last-in-First-Out (LIFO): units sold are assumed to be those which were most recently acquired. During Inflation, FIFO shows less expense on income statement and higher inventory valuation on balance sheet and values ending inventory at current cost, whereas LIFO shows higher expenses on income statement and lower inventory valuation on balance sheet. It should be noted that Inventory valuation significantly affects both b/sheet and income statements. Each valuation method/cost-assumption produces different results in financial statements and tax returns. Valuation of Stock Any manufacturing organization purchases different material through out the year. The prices of purchases may be different due to inflationary conditions of the economy. The question is, what item should be issued first & what item should be issued later for manufacturing. For this purpose, the organization has to make a policy for issue of stock. All the issues for manufacturing and valuation of stock are recorded according to the policy of the organization. Mostly these three methods are used for the valuation of stock: • First in first out (FIFO) • Last in first out (LIFO) • Weighted average First in first out (FIFO) The FIFO method is based on the assumption that the first merchandise purchased is the first merchandised issued. The FIFO uses actual purchase cost. Thus, if merchandise has been purchased at several different costs, the inventory (stock) will have several different cost prices. The cost of goods sold for a given sales transaction may involve several different cost prices. Characteristics • This is widely used method for determining values of cost of goods sold and closing stock. Copyright© Virtual University of Pakistan 74
  • 75.
    Financial Statement Analysis-FIN621 VU • In the FIFO method, oldest available purchase costs are transferred to cost of goods sold. That means the cost if goods sold has a lower value and the profitability of the organization becomes higher. • As the current stock is valued at recent most prices, the current assets of the company have the latest assessed values. Last in first out (LIFO) As the name suggests, the LIFO method is based on the assumption that the recently purchased merchandise is issued first. The LIFO uses actual purchase cost. Thus, if merchandise has been purchased at several different costs, the inventory (stock) will have several different cost prices. The cost of goods sold for a given sales transaction may involve several different cost prices. Characteristics • This is alternatively used method for determining values of cost of goods sold and closing stock. • In the LIFO method recent available purchase costs are transferred to cost of goods sold. That means the cost of goods sold has a higher value and the profitability of the organization becomes lower. • As the current stock is valued at oldest prices, the current assets of the company have the oldest assessed values. Weighted average method When weighted average method is in use, the average cost of all units in inventory, is computed after every purchase. This average cost is computed by dividing the total cost of goods available for sale by the number of units in inventory. Under the average cost assumption, all items in inventory are assigned the same per unit cost. Hence, it does not matter which units are sold; the cost of goods sold is always based on current average unit cost. Characteristics • Under the average cost assumption, all items in inventory are assigned same per unit cost (the average cost). Hence it does not matter which units are sold first. The cost of goods sold is always on the current average unit cost. • Since all inventories are assigned same cost, this method does not make any effect on the profitability and does not increase/decrease any asset in the financial statements. • This is the alternatively used method for determining values of cost of goods sold and closing stock. Example • Receipts: 01 Jan 20--, 10 units @ Rs. 150 per unit 02 Jan 20--, 15 units @ Rs. 200 per unit 10 Jan 20--, 20 units @ Rs. 210 per unit • Issues: 05 Jan 20--, 05 units 06 Jan 20--, 10 units 15 Jan 20--, 15 Copyright© Virtual University of Pakistan 75
  • 76.
    Financial Statement Analysis-FIN621 VU FIFO Method of Stock Valuation Date Receipts Issues Value of Stock 01-01-20-- 10 @ Rs. 150 10 x 150 = 1500 02-01-20-- 15 @ Rs. 200 10 x 150 = 1500 15 x 200 = 3000 4500 05-01-20-- 5 @ 150 = 750 750 5 x 150 = 750 15 x 200 = 3000 3750 06-01-20-- 5 @ 150 = 750 0 x 150 = 0 5 @ 200 = 1000 1750 10 x 200 = 2000 2000 10-01-20-- 20 @ Rs. 210 10 x 200 = 2000 20 x 210 = 4200 6200 15-01-20-- 10 @ 200 = 2000 0 x 200 = 0 5 @ 210 = 1050 3050 15 x 210 = 3150 3150 Weighted Average Method of Stock Valuation Date Receipts Issues Value of Stock Average Cost 01-01-20-- 10x150 = 1500 1500 1500/10=150 02-01-20-- 15x200 = 3000 1500 + 3000 = 4500 4500/25=180 05-01-20-- 5x180 = 900 4500 – 900 = 3600 3600/20=180 06-01-20-- 10x180 = 1800 3600 – 1800 = 1800 1800/10=180 10-01-20-- 20x210 = 4200 1800 + 4200 = 6000 6000/30=200 15-01-20-- 15x200 = 3000 6000 – 3000 = 3000 3000/15=200 Effects of valuation method on profit FIFO Method • Cost of Sales = 750 + 1750 + 3050 = 5,550 Gross Profit = 7500 – 5550 = 1,950 Weighted Average Method • Cost of Sales = 900 + 1800 + 3000 = 5,700 Gross Profit = 7500 – 5700 = 1,300 Copyright© Virtual University of Pakistan 76
  • 77.
    Financial Statement Analysis-FIN621 VU Illustration XYZ Company is a manufacturing concern. Following is the receipts & issues record for the month of May, 2002 Date Receipts Issues May 7 200 units @ Rs. 50/unit May 9 60 units May 13 150 units @ Rs. 75/unit May 18 100 units @ Rs. 60/unit May 22 150 units May 24 100 units May 27 100 units @ Rs. 50/unit May 30 200 units Calculate the value of closing stock by • FIFO Method • Average Method Solution Valuation of Stock by FIFO Method Date Receipts Issues Value of Stock Total Remaining Net Balance Amount No. of units May 7 200 units @ 200 x 50 = 10,000 200 10,000 Rs. 50/unit 10,000 May 9 60 units @ Rs. 60 x 50 = 3,000 (3,000) 140 7,000 50/unit May 13 150 units @ 75 x 150 = 11,250 290 18,250 Rs. 75/unit 11,250 May 18 100 units @ 60 x 100 = 6,000 390 24,250 Rs. 60/unit 6,000 May 22 140 units @ 50 x 140 = (7,750) 240 16,500 Rs. 50/unit 7,000 10 units @ Rs. 75/unit 10 x 75 = 750 May 24 100 units @ 75 x 100 (7,500) 140 9,000 Rs. 75/unit =7,500 May 27 100 units @ 50 x 100 = 5,000 240 14,000 Rs. 50/unit 5,000 May 30 40 units @ Rs. 75 x 40 = 3,000 (12,000) 40 2,000 75/unit 100 units @ 60 x 100 = Rs. 60/unit 6,000 60 units @ Rs. 50/unit 50 x 60 = 3,000 Copyright© Virtual University of Pakistan 77
  • 78.
    Financial Statement Analysis-FIN621 VU Valuation of Stock by Weighted Average Method: Date Receipts Issues Value of Total Total Units Average Net Stock Amount(Rs.) Cost(Rs.)/unit Balance (Rs.) May 200 units 200 x 50 10,000 200 50 10,000 7 @ Rs. = 50/unit 10,000 May 60 60 x 50 (3,000) 140 7,000 9 units = 3,000 May 150 units 150 x 75 7,000+11250 140+150=290 18250/290=62.9 18,250 13 @ Rs. = = 75/unit 11,250 18250 May 100 units 100 x 60 18250+6000 290+100 24250/390 24,250 18 @ Rs. = = = = 60/unit 6,000 24250 390 62.2 May 150 150 x 62.2 (9,330) 390-150 14,920 22 units = = 9330 240 May 100 100 x 62.2 (6,220) 240-100 8,700 24 units = = 6220 140 May 100 units 100 x 50 8,700+5,000 140+100 13700/240 13,700 27 @ Rs. = = = = 50/unit 5,000 13,700 240 57.1 May 200 200 x 57.1 (11,420) 240-200 2,280 30 units = = 11,420 40 Copyright© Virtual University of Pakistan 78
  • 79.
    Financial Statement Analysis-FIN621 VU Lesson-21 NOTES TO FINANCIAL STATEMENTS (Continued) Depreciation Accounting Policies. Depreciation is the expired or used portion of a fixed asset during an accounting period. This is taken into account to achieve the matching principle of matching revenues earned during an accounting period with the expenses incurred during that period. Since plant assets have useful life spreading over a number of accounting periods, the portion used in one accounting period is charged to Income Statement of that accounting period in the form of Depreciation Expense. Land is recorded at cost, other fixed assets are recorded at Book Value i.e. cost less accumulated depreciation. For this, separate Depreciation Expense and Accumulated Depreciation Accounts for different plant assets are maintained. It must also be noted that depreciation is a process of cost allocation and not a process of valuation as such. Computing Depreciation Different methods are available for computing depreciation of fixed assets. Different methods can be used for different assets. However, comparison among firms with different depreciation methods becomes difficult because of the fact that each firm uses different methods for calculating depreciation, which ultimately affect its net income and balance sheet. Methods of Computing Depreciation i) Straight-line method: In this, the depreciation expenses are spread evenly over periods. Assume that a plant asset is acquired for Rs.17, 000. It is estimated that its useful life is five years and residual value (salvage value) at the end of five years is Rs.2, 000. Depreciation is a systematic allocation of the cost of a depreciable asset to expense over its useful life. It is a process of charging the cost of fixed asset to profit & loss account. Fixed Assets are those assets which are: • Of long life • To be used in the business to generate revenue • Not bought with the main purpose of resale. Fixed assets are also called “Depreciable Assets” When an expense is incurred, it is charged to profit & loss account of the same accounting period in which it has incurred. Fixed assets are used for longer period of time. Now, the question is how to charge a fixed asset to profit & loss account. For this purpose, estimated life of the asset is determined. Estimated useful life is the number of years in which a fixed asset is expected to be used efficiently. It is the life for which a machine is estimated to provide more benefit than the cost to run it. Then, total cost of the asset is divided by total number of estimated years. The value, so determined, is called ‘depreciation for the year’ and is charged to profit & loss account. The same amount is deducted from total cost of fixed asset in the financial year in which depreciation is charged. The net amount (after deducting depreciation) is called ‘Written down Value’. WDV = Original cost of fixed asset – Accumulated Depreciation Copyright© Virtual University of Pakistan 79
  • 80.
    Financial Statement Analysis-FIN621 VU Accumulated Depreciation is the depreciation that has been charged on a particular asset from the time of purchase of the asset to the present time. This is the amount that has been charged to profit and loss account from the year of purchase to the present year. Depreciation accumulated over the years is called accumulated depreciation. Useful Life • Useful Life or Economic Life is the time period for machine is expected to operate efficiently. • It is the life for which a machine is estimated to provide more benefit than the cost to run it. Grouping of Fixed Assets Major groups of Fixed Assets: • Land • Building • Plant and Machinery • Furniture and Fixtures • Office Equipment • Vehicles No depreciation is charged for ‘Land’. In case of ‘Leased Asset/Lease Hold Land’ the amount paid for it is charged over the life of the lease and is called Amortization. Journal entries for recording Depreciation Purchase of fixed asset: Debit: Relevant asset account Credit: Cash, Bank or Payable Account For recording of depreciation, following two heads of accounts are used: • Depreciation Expense Account • Accumulated Depreciation Account Depreciation expense account contains the depreciation of the current year. Accumulated depreciation contains the depreciation of the asset from the financial year in which it was bought up to the present financial year. . Depreciation of the following years in which asset was used is added up in this account. In other words, this head of account shows the cost of usage of the asset up to the current year. Depreciation account is charged to profit & loss account under the heading of Administrative Expenses. In the balance sheet, fixed assets are presented at written down value i.e. WDV = Actual cost of fixed asset – Accumulated Depreciation. Journal entry for the depreciation is given below: Debit: Depreciation Expenses Account Credit: Accumulated Depreciation Account Presentation of Depreciation Charging depreciation to any head in profit & loss account depends upon the nature of work performed by the asset. Consider an organization has purchased computers. If computers are being used by the management, this means that administrative work is done by computers. So, depreciation of computers will be charged to Administrative Expenses. On the other hand, if machines working in the factory are Copyright© Virtual University of Pakistan 80
  • 81.
    Financial Statement Analysis-FIN621 VU computerized. The value of depreciation of the computers attached with the machines will be charged to cost of goods sold. The reason being, the computers are the part of manufacturing process & depreciation of computers will be charged to the cost of production. Again consider the selling department of the business is very large. Depreciation of computers used in selling department will be charged to selling expenses. You can see that computer is a single asset and its depreciation is charged in three different heads depending upon the nature of work done by the computer. Depreciation for the year is charged to: i. Cost of Goods Sold ii. Administrative Expenses iii. Selling Expenses In balance sheet Fixed Assets are shown at Cost less Accumulated Depreciation i.e. written Down Value (WDV). Methods of calculating Depreciation There are several methods for calculating depreciation. At this stage, we will discuss only two of them namely: • Straight line method or Original cost method or Fixed installment method • Reducing balance method or Diminishing balance method or written down method. Straight Line Method Under this method, a fixed amount is calculated by a formula. That fixed amount is charged every year irrespective of the written down value of the asset. The formula for calculating the depreciation is given below: Depreciation = (cost – Residual value) / Expected useful life of the asset Residual value is the cost of the asset after the expiry of its useful life. Under this method, at the expiry of asset’s useful life, its written down value will become zero. Consider the following example: • Cost of the Asset = Rs.100,000 • Life of the Asset = 5 years • Annual Depreciation = 20 % of cost or Rs.20,000 Written down value method • Cost of the Asset = Rs. 100,000 • Annual Depreciation = 20% Year 1 Depreciation = 20 % of 100,000 = 20,000 Year 1 WDV = 100,000 – 20,000 = 80,000 Year 2 Depreciation = 20 % of 80,000 = 16,000 Year 2 WDV = 80,000 – 16,000 = 64,000 Illustration: Cost of an asset: Rs. 120,000 Residual value: Rs. 20,000 Expected life: Rs. 5 years Copyright© Virtual University of Pakistan 81
  • 82.
    Financial Statement Analysis-FIN621 VU Calculate depreciation and the written down value of the asset for five years. Solution Straight line method Depreciation = (120,000 – 20,000) / 5 = Rs. 20,000 Particulars Depreciation Written (Rs) Down Value (Rs.) Depreciable cost 100,000 Dep. Of the 1st year (20,000) 80,000 Dep. Of the 2nd year (20,000) 60,000 Dep. Of the 3rd year (20,000) 40,000 Dep. Of the 4th year (20,000) 20,000 Dep. Of the 5th year (20,000) 0 Reducing Balance Method Under this method, depreciation is calculated on written down value. In the first year, depreciation is calculated on cost. Afterwards written down value is calculated by deducting accumulated depreciation from the cost of that asset(cost – accumulated depreciation) and depreciation is charged on that value. In this method, the value of asset never becomes zero. Consider the following example: Cost of an asset Rs. 100,000 Expected life Rs. 5 years Depreciation rate 20% Solution Particulars Depreciation Accumulated Written (Rs) Depreciation Down (Rs.) Value (Rs.) Depreciable cost 100,000 Dep. Of the 1st year 100,000 x 20% 20,000 20,000 80,000 Dep. Of the 2nd year 80,000 x 20% 16,000 36,000 64,000 Dep. Of the 3rd year 64,000 x 20% 12,800 48,800 51,200 Dep. Of the 4th year 51,200 x 20% 10,240 59,040 40,960 Dep. Of the 5th year 40,960 x 20% 8,192 67,232 32,768 You see, at the end of five years, WDV of the asset is Rs. 32,768, not zero. But in case of straight line method, the WDV, after five years was zero. So, in the opinion of some people, reducing balance Copyright© Virtual University of Pakistan 82
  • 83.
    Financial Statement Analysis-FIN621 VU method is better than that of straight line method, but both methods are effective. It is the management that has to decide, which method is best suited to their business. Once an asset has been fully depreciated, no more depreciation should be recorded on it, even though the property may be in good condition and may be in use. The objective of depreciation is to spread the cost of an asset over the periods of its usefulness; in no case can depreciation be greater than the amount paid for the asset. When a fully depreciated asset is in use beyond the original estimate of useful life, the asset account and the accumulated depreciation account should remain in the accounting records without further entries until the asset is retired. Reducing Balance Method In this method, depreciation is calculated on written down value. In the first year, depreciation is calculated on cost. Afterwards written down value is calculated by deducting accumulated depreciation from the cost of that asset (cost – accumulated depreciation) and depreciation is charged on that value. Cost of Asset – Price at which the asset was initially recorded Written Down Value / Book Value – Cost minus Accumulated Depreciation. In reducing balance method, a formula is used for calculation the depreciation rate i.e. Rate = 1 – n RV / C Where: “RV” = Residual Value “C” = Cost “n” = Life of Asset Calculate the rate if: Cost = 100,000 Residual Value (RV) = 20,000 Life = 3 years Rate = 1–3 20000/100000 = 42% Year 1 Cost 100,000 Depreciation 100,000 x 42% (42,000) WDV (Closing Balance) 58,000 Year 2 WDV (Opening Balance) 58,000 Depreciation 58,000 x 42% (24,360) WDV (Closing Balance) 33,640 Year 3 WDV (Opening Balance) 33,640 Depreciation 33,640 x 42% (14,128) WDV (Closing Balance) 19,511 Disposal of Asset Copyright© Virtual University of Pakistan 83
  • 84.
    Financial Statement Analysis-FIN621 VU Cost of Asset = 100,000 Life of the Asset = 5 Years Depreciation Method = Straight Line Residual Value = Rs.10000 Sale Price after Five Years = Rs.15000 Depreciation per year = (100000-10000) / 5 = Rs.5000 per year Total Depreciation in Five Years = 18,000 x 5 = 90,000 Book Value after Five Years = 100,000- 90,000 = 10,000 Profit on Disposal = 15,000 – 10,000 = Rs.5000 Recording of Disposal Debit Fixed Asset Disposal A/c 100,000 Credit Fixed Asset Cost A/c 100,000 (With the cost of asset) Debit Accumulated Dep. A/c 90,000 Credit Fixed Asset Disposal A/c 90,000 (With the depreciation accumulated to date) Debit Cash / Bank / Receivable A/c 15,000 Credit Fixed Asset Disposal A/c 15,000 (With the price at which asset is sold) [Note: one group to appear at a time] Disposal of Asset Account Fixed Asset Disposal Account Debit Credit Cost Account 100,000 Acc. Dep. Account 90,000 Cash / Bank 15,000 P & L Account 5000 ( Balancing Figure) Total 105000 Total 105000 Policy for Depreciation Copyright© Virtual University of Pakistan 84
  • 85.
    Financial Statement Analysis-FIN621 VU The management of the business selects the policy for charging depreciation. There is no law binding on the management. The management is free to choose method of depreciation and policy of charging depreciation. Normally two policies are commonly used: • Depreciation on the basis of use • In the year of purchase, full year’s depreciation is charged; where as, in the year of sale no depreciation is charged. Now it is up to the management to decide, what method and what policy is better and effective for their business. Disposal of Fixed Asset When depreciable asset is disposed off at any time during the financial year, an entry should be made to give effect of the disposal. Since, the residual value of asset is only estimated; it is common for asset to be sold at price that differs from its book value at the date of disposal. When asset is sold, any profit or loss is computed by comparing book value with the amount received from sale. As you know, book value is obtained by deducting accumulated depreciation from original cost of the asset. A sale price in excess of the book value produces profit; a sale price below the book value produces loss. This profit or loss should be shown in the profit & loss account. Entries for Recording Disposal Debit Fixed Asset Disposal A/c Credit Fixed Asset Cost A/c (With the cost of asset) Debit Accumulated Dep. A/c Credit Fixed Asset Disposal A/c (With the depreciation accumulated to date) Debit Cash / Bank / Receivable A/c Credit Fixed Asset Disposal A/c (With the price at which asset is sold) Example • An asset is purchased for Rs. 500,000 on Nov. 01, 2001. • Depreciation rate is 10% p.a. • The Asset is sold on Apr. 30, 2004. • Financial Year is July 1 to June 30 Question • Calculate the WDV For both policies Copyright© Virtual University of Pakistan 85
  • 86.
    Financial Statement Analysis-FIN621 VU Depreciation is charged on the Basis of Use Year On the Basis of Use Rs. 1-11-2001 Cost 500,000 2001-2002 Dep. 500,000 x 10% x 8 / 12 (33,333) 30-6-2002 WDV 466,667 2002-2003 Dep. 466,666 x 10% (46,667) 30-6-2003 WDV 420,000 2003-2004 Dep. 420,000 x 10% x 10 / 12 (35,000) 30-4-2004 WDV 385,000 Full Depreciation in the Year of Purchase Year Full Dep. in year of Purchase Rs. 1-11-2001 Cost 500,000 2001-2002 Dep. 500,000 x 10% (50,000) 30-6-2002 WDV 450,000 2002-2003 Dep. 450,000 x 10% (45,000) 30-6-2003 WDV 405,000 2003-2004 Dep. 00 in the year of sale 00 30-6-2004 WDV 405,000 Contents of Fixed Assets Register • Different record for each class of assets • Date of purchase • Detailed particulars of asset • Location of asset • Record of depreciation Illustration Cost of asset Rs. 200,000 Life of the asset 5 years Depreciation method Straight line Residual value Rs. 20,000 Sale price after 5 years 30,000 Calculate profit/Loss on the sale of the asset? Copyright© Virtual University of Pakistan 86
  • 87.
    Financial Statement Analysis-FIN621 VU Solution Written down value = 200,000 – 20,000 = 180,000 Depreciation/year = 180,000/5 = 36,000 (Straight line method) Particulars Depreciation (Rs) Written Down Value (Rs.) Depreciable cost 200,000 Dep. Of the 1st year (36,000) 164,000 Dep. Of the 2nd year (36,000) 128,000 Dep. Of the 3rd year (36,000) 92,000 Dep. Of the 4th year (36,000) 56,000 Dep. Of the 5th year (36,000) 20,000 Book value after five years Rs. 20,000 Sale price Rs. 30,000 Profit on sale Rs. 10,000 (30,000 – 20,000) Same illustration is solved by reducing balance method Cost of asset Rs. 200,000 Residual value Rs. 20,000 Estimated useful life 5 years Calculation of depreciation rate ____ n Depreciation Rate = 1 – √Rv/c _____________ = 1 - 5√20,000/200,000 = 37% Allocation of depreciation is given below: Particulars Depreciation (Rs) Accumulated Written Down Depreciation Value (Rs.) (Rs.) Depreciable cost 200,000 Dep. Of the 1st year 200,000 x 37% 74,000 74,000 126,000 Dep. Of the 2nd year 126,000 x 37% 46,620 120,620 79,380 Dep. Of the 3rd year 79,380 x 37% 29,371 149,991 50,009 Dep. Of the 4th year 50,009 x 37% 18,503 168,494 31,506 Dep. Of the 5th year 31,506 x 37% 11,657 180,151 19,849 Book value after five years Rs. 19,849 Sale price Rs. 30,000 Profit on sale Rs. 10,151 (30,000 – 19,849) Copyright© Virtual University of Pakistan 87
  • 88.
    Financial Statement Analysis-FIN621 VU If an asset is not completed at that time when balance sheet is prepared, all costs incurred on that asset up to the balance sheet date are transferred to an account called Capital Work in Progress Account. This account is shown separately in the balance sheet below the fixed asset. Capital work in progress account contains all expenses incurred on the asset until it is converted into working condition. All these expenses will become part of the cost of that asset. When an asset is completed and it is ready to work, all costs in the capital work in progress account will transfer to the relevant asset account through the following entry: Debit: Relevant asset account Credit: Capital work in progress account Illustration # 1 A machine is purchased for Rs. 400,000. Its useful life is estimated to be five years. Its residual value is Rs. 25,000. After four years, it was sold for Rs. 40,000. For the purpose of WDV, its depreciation rate is 40%. You are required to show calculation of depreciation for four years. Also calculate profit or loss on disposal. Solution Calculation of depreciation and profit & loss on the basis of straight line method: Depreciation/year = (400,000 – 25,000)/5 = 75,000 (Straight line method) As, machine was sold after four years but its useful life was estimated for five years, when we calculate depreciation of the asset under straight line method, we will divide its WDV over five years, not on four years. Particulars Depreciation (Rs) Written Down Value (Rs.) Depreciable cost 375,000 Dep. Of the 1st year (75,000) 300,000 Dep. Of the 2nd year (75,000) 225,000 Dep. Of the 3rd year (75,000) 150,000 Dep. Of the 4th year (75,000) 75,000 Book value after four years Rs. 75,000 Sale price Rs. 40,000 Profit/(loss) on sale Rs. (35,000) i-e.(40,000 – 75,000) Copyright© Virtual University of Pakistan 88
  • 89.
    Financial Statement Analysis-FIN621 VU Calculation of depreciation and profit & loss on the basis of reducing balance method: Depreciation rate = 40% Particulars Depreciation Accumulated Written (Rs) Depreciation Down (Rs.) Value (Rs.) Depreciable cost 400,000 Dep. Of the 1st year 400,000 x 40% 160,000 160,000 240,000 Dep. Of the 2nd year 240,000 x 40% 96,000 256,000 144,000 Dep. Of the 3rd year 144,000 x 40% 57,600 313,600 86,400 Dep. Of the 4th year 86,400 x 40% 34,560 348,160 51,840 Book value after four years Rs. 51,840 Sale price Rs. 40,000 Profit/ (loss) on sale Rs. (11,840) i-e. (40,000 – 51,840) Illustration # 2 Following information of machinery account is available in Year 2004: • Machine # 1 is purchased on September 1, 2000 for Rs. 100,000 • Machine # 2 is purchased on January 31, 2002 for Rs. 200,000 • Machine # 3 is purchased on July 1, 2003 for Rs. 50,000 • Machine # 1 is disposed on March 31, 2004 Depreciation is charged @ 25% reducing balance method. Financial year is closed on June 30 every year. Show the calculation of depreciation on machinery for four years using the following policies: • Depreciation is charged on the basis of use • Full depreciation is charged in the year of purchase and no depreciation is charged in the year of disposal. Solution Depreciation on the basis of use Date Purchase Depreciation Accumulated Total Written Total of (Rs.) depreciation Accum. Down Value Written machine (Rs.) Dep. (Rs.) Down (Rs.) Value (Rs.) 01-09-2000 100,000 Machine # 1 Machine # 1 20,833 Machine # 1 79,167 100,000 x 25% 20,833 79,167 x10/12=20,833 2001-2002 Machine # 1 Machine # 1 61,458 Machine # 1 238,542 79,167x25% 40,625 59,375 = 19,792 31-01-2002 200,000 Machine # 2 Machine # 2 Machine # 2 Copyright© Virtual University of Pakistan 89
  • 90.
    Financial Statement Analysis-FIN621 VU 200,000x25%x5 20,833 179,167 /12=20,833 2002-2003 Machine # 1 Machine # 1 121,094 Machine # 1 178,906 59,375x25% 55,469 44,531 = 14,844 Machine # 2 Machine # 2 Machine # 2 179,167x25% 65,625 134,375 =44,792 2003-2004 Machine # 1 Machine # 1 175,538 Machine # 1 138,281 44,531x25%x 63,819 (36,181) 9/12= 8,350 (sold) Machine # 2 Machine # 2 Machine # 2 134,375x25% 99,219 100,781 = 33,594 01-07-2003 50,000 Machine # 3 Machine # 3 Machine # 3 50,000x25% 12,500 37,500 = 12,500 Figure in blue color is the written down value of machine # 1, which is disposed of by the management. Copyright© Virtual University of Pakistan 90
  • 91.
    Financial Statement Analysis-FIN621 VU Full year depreciation in the year of purchase and no depreciation in the year of sale: Date Purchase Depreciation Accumulated Total Written Total of (Rs.) depreciation Accum. Down Value Written machine (Rs.) Dep. (Rs.) Down (Rs.) Value (Rs.) 01-09-2000 100,000 Machine # 1 Machine # 1 25,000 Machine # 1 75,000 100,000 x 25% 25,000 75,000 =25,000 2001-2002 Machine # 1 Machine # 1 93,750 Machine # 1 206,250 75,000x25% 43,750 56,250 = 18,750 31-01-2002 200,000 Machine # 2 Machine # 2 Machine # 2 200,000x25% 50,000 150,000 =50,000 2002-2003 Machine # 1 Machine # 1 145,313 Machine # 1 154,687 56,250x25% 57,813 42,187 = 14,063 Machine # 2 Machine # 2 Machine # 2 150,000x25% 87,500 112,500 =37,500 2003-2004 Machine # 1 Machine # 1 185,935 Machine # 1 121,875 0 57,813 42,187 Machine sold (sold) (sold) Machine # 2 Machine # 2 Machine # 2 112,500x25% 115,625 84,375 = 28,125 01-07-2003 50,000 Machine # 3 Machine # 3 Machine # 3 50,000x25% 12,500 37,500 = 12,500 If an asset is not completed at that time when balance sheet is prepared, all costs incurred on that asset up to the balance sheet date are transferred to an account called Capital Work in Progress Account. This account is shown separately in the balance sheet below the fixed asset. Capital work in progress account contains all expenses incurred on the asset until it is converted into working condition. All these expenses will become part of the cost of that asset. When any expense is incurred or paid, it is included in the Capital Work in Progress Account through the following entry: Debit: Work in Progress Account Credit: Cash/Bank/Payable Account When an asset is completed and it is ready to work, all costs will transfer to the relevant asset account through the following entry: Debit: Relevant asset account Credit: Capital work in progress account Presentation It is already mentioned that Work in Progress Account is shown separately in the balance sheet below the fixed asset. i-e. Copyright© Virtual University of Pakistan 91
  • 92.
    Financial Statement Analysis-FIN621 VU Name of the Entity Balance Sheet As At………. Particulars Amount Amount Rs. Rs. Assets Fixed Assets xyz Capital Work in Progress xyz Other Long Term Assets xyz Current Assets Total Xyz Liabilities Capital xyz Profit xyz Xyz Long Term Liabilities Xyz Current Liabilities Total Xyz Consider the solved illustration in the previous lecture: Depreciation on the basis of use Date Purchase Depreciation Accumulated Total Written Total of (Rs.) depreciation Accum. Down Value Written machine (Rs.) Dep. (Rs.) Down (Rs.) Value (Rs.) 01-09-2000 100,000 Machine # 1 Machine # 1 20,833 Machine # 1 79,167 100,000 x 25% 20,833 79,167 x10/12=20,833 2001-2002 Machine # 1 Machine # 1 61,458 Machine # 1 238,542 79,167x25% 40,625 59,375 = 19,792 31-01-2002 200,000 Machine # 2 Machine # 2 Machine # 2 200,000x25%x5 20,833 179,167 /12=20,833 2002-2003 Machine # 1 Machine # 1 121,094 Machine # 1 178,906 59,375x25% 55,469 44,531 = 14,844 Machine # 2 Machine # 2 Machine # 2 179,167x25% 65,625 134,375 =44,792 2003-2004 Machine # 1 Machine # 1 175,538 Machine # 1 138,281 44,531x25%x 63,819 (36,181) 9/12= 8,350 (sold) Machine # 2 Machine # 2 Machine # 2 134,375x25% 99,219 100,781 = 33,594 01-07-2003 50,000 Machine # 3 Machine # 3 Machine # 3 Copyright© Virtual University of Pakistan 92
  • 93.
    Financial Statement Analysis-FIN621 VU 50,000x25% 12,500 37,500 = 12,500 Presentation in Balance Sheet Year Cost of Machinery Accumulated Written Down Depreciation Value 2000-2001 100,000 20,833 79,167 2001-2002 300,000 61,458 238,542 2002-2003 300,000 121,094 178,906 Written down Value of the year 2003-2004 Opening Written Down Value: 178,906 Add: Cost of machine purchased: 50,000 Less: Depreciation of Machine # 1 in 2003-2004: (8,350) Less: Depreciation of other assets: (46,094) Less: Written Down Value of machine disposed: (36,181) Closing Written Down Value: 138,281 Copyright© Virtual University of Pakistan 93
  • 94.
    Financial Statement Analysis-FIN621 VU Full year depreciation in the year of purchase and no depreciation in the year of sale: Date Purchase Depreciation Accumulated Total Written Total of (Rs.) depreciation Accum. Down Value Written machine (Rs.) Dep. (Rs.) Down (Rs.) Value (Rs.) 01-09-2000 100,000 Machine # 1 Machine # 1 25,000 Machine # 1 75,000 100,000 x 25% 25,000 75,000 =25,000 2001-2002 Machine # 1 Machine # 1 93,750 Machine # 1 206,250 75,000x25% 43,750 56,250 = 18,750 31-01-2002 200,000 Machine # 2 Machine # 2 Machine # 2 200,000x25% 50,000 150,000 =50,000 2002-2003 Machine # 1 Machine # 1 145,313 Machine # 1 154,687 56,250x25% 57,813 42,187 = 14,063 Machine # 2 Machine # 2 Machine # 2 150,000x25% 87,500 112,500 =37,500 2003-2004 Machine # 1 Machine # 1 185,935 Machine # 1 121,875 0 57,813 42,187 Machine sold (sold) (sold) Machine # 2 Machine # 2 Machine # 2 112,500x25% 115,625 84,375 = 28,125 01-07-2003 50,000 Machine # 3 Machine # 3 Machine # 3 50,000x25% 12,500 37,500 = 12,500 Presentation in the Balance Sheet Year Cost of Machinery Accumulated Written Down Depreciation Value 2000-2001 100,000 25,000 75,000 2001-2002 300,000 93,750 206,250 2002-2003 300,000 145,313 154,687 Written down Value of the year 2003-2004 Opening Written Down Value: Rs. 154,687 Add: Cost of machine purchased: Rs. 50,000 Less: Depreciation of Machine # 1 in 2003-2004: 0 Less: Depreciation of other assets: (40,625) Less: Written Down Value of machine disposed: (42,187) Closing Written Down Value: Rs. 121,875 Copyright© Virtual University of Pakistan 94
  • 95.
    Financial Statement Analysis-FIN621 VU Illustration # 2 Following information of machinery account is available in Year 2004: • Machine # 1 is purchased on August 1, 2000 for Rs. 50,000 • Machine # 2 is purchased on April 1, 2002 for Rs. 100,000 • Machine # 3 is purchased on March 1, 2004 for Rs. 150,000 • Machine # 1 is disposed on May 31, 2004 Depreciation is charged @ 20% reducing balance method. Financial year is closed on June 30 every year. Show the calculation of depreciation on machinery for four years using the following policies: • Depreciation is charged on the basis of use • Full depreciation is charged in the year of purchase and no depreciation is charged in the year of disposal, Solution Depreciation on the basis of use Date Purchase Depreciation Accumulated Total Written Total of (Rs.) depreciation Accum. Down Value Written machine (Rs.) Dep. (Rs.) Down (Rs.) Value (Rs.) 01-08-2000 50,000 Machine # 1 Machine # 1 9,167 Machine # 1 40,833 50,000 x 20% 9,167 9,167 x11/12=9,167 2001-2002 Machine # 1 Machine # 1 22,334 Machine # 1 127,666 40,833x20% 17,334 32,666 = 8,167 Machine # 2 01-04-2002 100,000 Machine # 2 5,000 Machine # 2 100,000x20%x3 95,000 /12=5,000 2002-2003 Machine # 1 Machine # 1 47,867 Machine # 1 102,133 32,666x20% 23,867 26,133 = 6,533 Machine # 2 Machine # 2 Machine # 2 95,000x20% 24,000 76,000 =19,000 2003-2004 Machine # 1 Machine # 1 77,858 Machine # 1 200,800 26,133x20%x 28,658 (21,342) 11/12= 4,791 (sold) Machine # 2 Machine # 2 Machine # 2 76,000x20% 39,200 60,800 = 15,200 01-03-2004 150,000 Machine # 3 Machine # 3 Machine # 3 150,000x20%x 10,000 140,000 4/12= 10,000 Copyright© Virtual University of Pakistan 95
  • 96.
    Financial Statement Analysis-FIN621 VU Presentation in the Balance Sheet Year Cost of Machinery Accumulated Written Down Depreciation Value 2000-2001 50,000 9,167 40,833 2001-2002 150,000 22,334 127,666 2002-2003 150,000 47,867 102,133 Written Down Value of the year 2003-2004 Opening Written Down Value: Rs. 102,133 Add: Cost of machine purchased: Rs. 150,000 Less: Depreciation of Machine # 1 in 2003-2004: (4,791) Less: Depreciation of other assets: (25,200) Less: Written Down Value of machine disposed: (21,342) Closing Written Down Value: Rs. 200,800 Full year depreciation in the year of purchase and no depreciation in the year of sale: Date Purchase Depreciation Accumulated Total Written Total of (Rs.) depreciation Accum. Down Value Written machine (Rs.) Dep. (Rs.) Down (Rs.) Value (Rs.) 01-08-2000 50,000 Machine # 1 Machine # 1 10,000 Machine # 1 40,000 50,000 x 20% 10,000 40,000 =10,000 2001-2002 Machine # 1 Machine # 1 38,000 Machine # 1 112,000 40,000x20% 18,000 32,000 = 8,000 01-04-2002 100,000 Machine # 2 Machine # 2 Machine # 2 100,000x20% 20,000 80,000 =20,000 2002-2003 Machine # 1 Machine # 1 60,400 Machine # 1 89,600 32,000x20% 24,400 25,600 = 6,400 Machine # 2 Machine # 2 Machine # 2 80,000x20% 36,000 64,000 =16,000 2003-2004 Machine # 1 Machine # 1 103,200 Machine # 1 171,200 0 24,400 (25,600) Machine sold (sold) (sold) Machine # 2 Machine # 2 Machine # 2 64,000x20% 48,800 51,200 = 12,800 01-03-2004 150,000 Machine # 3 Machine # 3 Machine # 3 150,000x20% 30,000 120,000 = 30,000 Copyright© Virtual University of Pakistan 96
  • 97.
    Financial Statement Analysis-FIN621 VU Presentation in the Balance Sheet Year Cost of Machinery Accumulated Written Down Depreciation Value 2000-2001 50,000 10,000 40,000 2001-2002 150,000 38,000 112,000 2002-2003 150,000 60,400 89,600 Written Down Value of the year 2003-2004 Opening Written Down Value: Rs. 89,600 Add: Cost of machine purchased: Rs. 150,000 Less: Depreciation of Machine # 1 in 2003-2004: 0 Less: Depreciation of other assets: (42,800) Less: Written Down Value of machine disposed: (25,600) Closing Written Down Value: Rs. 171,200 Revaluation of Fixed Assets Fixed assets are purchased to be used for longer period. In the subsequent years, the value of asset could be higher or lower than its present book value due to inflationary condition of the economy. Assets are valued at Historical Cost in the books of accounts. Historical Cost is the original cost of the asset at which it was purchased plus additional costs incurred on the asset to bring it in working condition. Sometimes, the management of the business, if it thinks fit, revalues the asset to present it on current market value. Once the asset is revalued to its market value, then its value has to be constantly monitored to reflect the changes in the market value. If an asset is revalued at higher cost than its original cost, the excess amount will be treated as profit on revaluation of fixed assets and it is credited to Revaluation Reserve Account. On the other hand, if an asset is revalued at lower cost than its original cost, the balance amount will be treated as loss on revaluation of fixed assets and it is shown in the profit & loss account of that year in which asset was revalued. Copyright© Virtual University of Pakistan 97
  • 98.
    Financial Statement Analysis-FIN621 VU Lesson-22 NOTES TO FINANCIAL STATEMENTS (Continued) Depreciation expenses for year would be: =cost-(estimated) Residual value = 17,000-2000 = 3000 *(Estimated years of useful life-5) ii) Accelerated-Depreciation method: In this method higher depreciation rate is charged in early years and lower rate in later years. Since new plants are most efficient in early years, matching principle demands that higher depreciation may be charged in earlier years. Depreciation = Book Value x Accelerated Dep. Rate Example: Taking the above case of plant asset acquired for Rs.17, 000 Year Depreciation Accumulated Book Value Depreciation 1 17,000 X 40% 6800 6800 10200 2. 10,200 X 40% 4080 10880 6120 3. 6,120 X 40% 2448 13328 3672 4. 3,672 X 40% 1469 14797 2203 5. 2,203 X 40% 881 15000 2000 (reduced to 203) Note that sine total depreciation in five years is Rs.15, 000 (Rs.17, 000 – 2,000), the depreciation for the last year is reduced from 881 to 203 to bring the total depreciation amount in 5 years to Rs.17, 000. Principles of disclosure and Consistency of Accounting Methods. This is the basic concept underlying reliable financial statements, i.e. consistently following the Inventory valuation/ pricing and Depreciation calculation Methods. Disclosure of the Accounting methods used, in Balance Sheet or in the Notes is also an essential requirement of Disclosure Principle. If however, Accounting Method (s) are changed disclosure must be made of reasons for such change, and of the effect of change upon the company's net income. Annual Report Generated By Business Annual Report is part of Financial Reporting Process which contains Financial Statements, Notes to financial statements, Auditors’ Report, Five-year summary of key financial and non-financial data, and Management’s discussion and analysis of operations (MD&A). Auditor’s Report Audit of financial statements is independent of the business issuing these. Financial Statements preparation is Management’s responsibility, whereas expressing opinion as to their fairness is the Auditor’s responsibility, Audit Report is issued along with financial statements to persons outside the business. It provides assurance to outside users about the completeness and reliability (not necessarily accuracy) of Financial Statements. Auditor is hired by the company being audited. Usually a Management letter is also issued by Auditors to Company’s management, recommending steps for improving company’s internal control structures. Copyright© Virtual University of Pakistan 98
  • 99.
    Financial Statement Analysis-FIN621 VU Fairness’ in the context of Auditor’s Report means that financial statements are not misleading. Audit is conducted according to Generally Accepted Auditing Standards. During Audit, the Auditors obtain reasonable assurance that financial statements are free of “material” misstatements. Audit is conducted by examining, on a test basis, evidence supporting the amounts and disclosures in the financial statements. It assesses the accounting principles used and significant estimates made by management. It must also be noted that Audit‘s purpose is to determine fairness of financial statements and not to detect frauds, as such. In the context of materiality, it is to be noted that an item is material if knowledge of this might reasonably be expected to influence user’s decisions. Also to be noted is the fact an auditor can also make errors like a physician does in diagnosis. End product of every audit is the auditor’s report. An audit involves collection of audit evidence about the truth and fairness of financial statements or other proposition under review. By careful examination of the evidence so called the auditor draws appropriate conclusions and forms his opinion. The auditor’s report summarizes results of the work conducted by the auditor and formally communicates the auditor’s opinion. It is important to note that the auditor’s report simply expresses the auditor’s opinion on truth and fairness of financial statements as absolutely correct. An auditor’s report is a formal statement that includes the reporting auditor’s opinion formed after careful examination of books of accounts and related documents. Where as, a certificate is written conformation of absolute accuracy of the facts stated therein and does not involve any estimate or opinion. Types of auditor’s opinion An auditor’s opinion may be unqualified, qualified or adverse. In certain circumstances the auditor may disclaim an opinion i.e states his inability to express an opinion. Unqualified opinion Opinion of an auditor is termed as unqualified when the auditor concludes that that the financial statements give a true and fair view in accordance with the identified financial reporting framework. There is no statuary definition of the words “true and fair”. However, true and fair has been taken to mean the following: (I) free from prejudice or bias, (II) presentation of an objective picture, (III) in accordance with generally accepted accounting principles, (IV) consistent and having clarity,(V) not misleading and understandable by the reader of financial statements,. (V) presented fairly, in all material respects. Identified financial reporting framework means the set of statutes, rulers, and standards etc. That apply to the preparation and presentation and presentation of such financial statements. According to the companies ordinance 1984, in an unqualified audit report the auditor is required to make some statutory affirmations without reservations, as prescribed in section 255(3). In an unqualified opinion the auditor also impliedly undertakes that any changes in accounting principles or in the method of their application, and the effects thereof, have been properly determined and disclosed in the financial statements. Modified opinion An auditor may not be able to express an unqualified opinion. When either of the following circumstances exists and, in the auditor’s judgment, the effect of which is or may be material to the financial statements:- Copyright© Virtual University of Pakistan 99
  • 100.
    Financial Statement Analysis-FIN621 VU (a) There is a limitation on the scope of the auditor’s work; or (b) There is a disagreement with management regarding the acceptability of the accounting policies selected, the method of their application or the adequacy of financial statement disclosures. The circumstances described in (a) could lead to a qualified opinion or a disclaimer of opinion. The circumstances described in (b) could lead to a qualified opinion or an adverse opinion. (i) Qualified Opinion Opinion of an auditor is termed as qualified opinion when the auditor concludes that an unqualified opinion cannot be expressed but that the effect of any disagreement with management, or limitation on scope is not so material and pervasive as to require and adverse opinion or a disclaimer of opinion. A qualified opinion is expressed as being ‘except for’ the effects of the matter to which the qualification relates. (ii) Disclaimer of opinion A disclaimer of opinion should be expressed when possible effect of a limitation on scope of audit is so material and pervasive that the auditor has not been able to obtain sufficient appropriate audit evidence an accordingly is unable to express an opinion on the financial statements (iii) Adverse opinion. An adverse opinion should be expressed when the effect of a disagreement is so material and pervasive to the financial statements that the auditor concludes that a qualification of the report is not adequate to disclose the misleading or incomplete nature of the financial statements. Copyright© Virtual University of Pakistan 100
  • 101.
    Financial Statement Analysis-FIN621 VU Lesson-23 ANNUAL REPORT GENERATED BY BUSINESS Auditor’s Report, Opinion/Certificate: There are four types of Audit certificates. i) Unqualified: It states that Financial Statements present information in conformity with GAAP. ii) Qualified: It qualifies the Report with certain observations. iii) Adverse: It states that financial statements have not been presented fairly in accordance with GAAP. iv) Disclaimer: Auditor expresses his inability to report on Financial Statements for various reasons. Statements of Audit Reports “Un-qualified Audit Certificate/Opinion”: We have examined the accounts/financial statements of________ up to the year ended 30th June, _____, and other record based on these accounts and we got all the information required by us. In our opinion the financial statements and the accounts on which they are based have been prepared in conformity with generally accepted accounting principles, and present a true and fair position of the affairs of _________________. “Qualified Audit Certificate/Opinion”: We have examined the accounts of _________ up to the year ended 30th June, _______ and other record based on these accounts and we got all the information required by us. In our opinion the financial statements and the accounts on which they are based have generally been prepared in conformity with the generally accepted accounting principles, and these present a true and fair position of the affairs of _________ subject to the observations and findings mentioned in the enclosed report. “Adverse Audit Certificate/Opinion”: We have examined the accounts of __________ up to the year ended 30th June, _____ and other record based on these accounts and we got all the information required by us. In our opinion the financial statements and the accounts on which they are based have not been prepared in conformity with generally accepted accounting principles, and these do not present a true and fair position of the affairs of _________ because of the errors mentioned in the enclosed report. Disclaimer of opinion: We are unable to issue an audit certificate on the accounts of ________ for the period _______, as we could not verify the financial statements and the accounts on which they are based due to non-availability of the necessary information or because of our inability to visit (Locations) or due to the non-cooperation by the auditee staff in providing the necessary records (name the documents). Another form of Audit Report is as follows:- To the Stockholders and Board of Directors of MOOSA & CO. We have audited the accompanying balance sheet of Moosa & Co as of June 30, 20 ____, and the related statements of income, retained earnings, and cash flow for the year then ended. We conducted our audit in accordance with generally accepted auditing standards. Copyright© Virtual University of Pakistan 101
  • 102.
    Financial Statement Analysis-FIN621 VU We believe that our audit provides a reasonable basis for our opinion. In our opinion, the financial statements referred to above present fairly, in all material respects, the financial position of Moosa & Co as of June 30, 20______, and the results of its operations and its cash flows for the year then ended in conformity with generally accepted accounting principles. Peshawar Signature September 29, 20____ Certified Chartered Accountant Copyright© Virtual University of Pakistan 102
  • 103.
    Financial Statement Analysis-FIN621 VU Lesson-24 ANNUAL REPORT GENERATED BY BUSINESS (Continued) Five-Year Summary: This is also a very important part of Annual Report prepared by the management of a corporation. It offers quick look at some overall trends, and it includes net sales or operating revenues, income/loss from continuing operations, total assets, long-term obligations and cash dividend per common share. Management Discussion & Analyses (MD&A) This last part of the Annual Report is also labeled as’ Financial Review’. It contains information that cannot be found in the financial data e.g. internal/external sources of liquidity, any material deficiencies in liquidity and suggested remedial measures, commitments for capital expenditure and sources of funding, and anticipated changes in the mix and cost of financing resources. MD&A records events causing material changes in cost/revenue relationships e.g. future price increase. It also gives breakdown of sales increases in price and volume components, and also gives explanation about why changes have occurred in profitability and liquidity. Quality of Financial Reporting Ideally, financial statements should reflect an accurate picture of the financial position and performance of a business, and should convey information useful to assess the past and predict the future. However discretion/potential exists within GAAP to “manipulate/window-dress” the financial statements. Opportunities for management to affect the quality of financial statements are available in the form of Accounting Policies, Estimates i.e. choices, (of Accounting Policies) and changes (of Accounting Policies and Estimates). There is also opportunity to Management for timing of Revenues and Expenses. Since Matching process requires matching revenues and expenses of a particular accounting period, it gives the management, discretion regarding timing of expenses. For example, management may postpone expenditures for many items like Advertisement/marketing, Repairs/Maintenance, and Research & Development and Capital expansion; in order to “window- dress” its financial statements. Limitations of Financial Statements. Financial Statements assume constant real-value of money. It should be noted that net income is not absolutely accurate and precise, since assumptions, estimations & approximations are involved as regards estimated useful life of plant assets, their residual value etc. Events not measurable objectively are not reflected in Income Statement. Also the Financial Statements give no “valuation” as such of the enterprise because assets are valued on “going-concern assumption”, and the fixed assets are valued at Book Value which may be more or less than realizable market value. Financial Statements have the limitation that assessment of future profitability is not possible by reading these. Future profitability depends on a number of factors e.g. quality of products, activities of competitors, general economic situation etc., a picture of which cannot emerge from financial statements. Financial Statements thus give limited picture of an enterprise in monetary terms, without taking into account outside non-monetary factors. Copyright© Virtual University of Pakistan 103
  • 104.
    Financial Statement Analysis-FIN621 VU One other limitation of Financial Statements is that information is not available in financial statements about employees’ relations with management, morale/efficiency of employees, reputation/public perception of the enterprise, effectiveness of management team and potential exposure to regulatory changes. These impact operational results but are difficult to quantify from Financial Statements. Different accounting practices can distort comparisons. As noted earlier, inventory valuation and depreciation methods can affect financial statements and thus distort comparisons among firms. Also, if one firm leases a substantial amount of its productive equipment, its assets may appear low relative to sales because leased assets often do not appear on the balance sheet, at the same time, the liability associated with the lease obligation may not be shown as a debt. Therefore leasing can artificially improve both the turnover and the debt ratios. However accounting professional has taken steps to reduce this problem. Financial accounting deals with the preparation of financial statements, namely, Income statement, Statement of changes in owner's equity, Balance sheet and Statement of Cash flows. These financial statements enable users of accounting information to make informed decisions about a company's performance. In order to make decisions, the information presented must be Relevant (useful for the purpose of decision making) Reliable (verifiable) However, some people argue that due to the rules that accountants use, financial statements are not as useful as they could be. Limitations of Financial Statements. Limitation # 1 Assets on the balance sheet are always shown at the original purchase price (historical cost) even though the current value may be different. Example: XYZ Company started their business five years ago and at that time; they purchased some land for Rs. 200,000. Today, the same land is worth Rs. 500,000. However, the land will be shown on the balance sheet at Rs. 200,000. Implication: The value of the land is not realistic. Limitation # 2 Some figures on the financial statements are based on subjective estimates and assumptions. Management could possibly change net income by changing these estimates. Depreciation is one example where estimates and assumptions are used. Definition of Depreciation Depreciation is the loss in value of assets as the assets are used to generate revenue. Depreciation is an expense. Copyright© Virtual University of Pakistan 104
  • 105.
    Financial Statement Analysis-FIN621 VU Example: XYZ Company is in the business of manufacturing 'ball-point' pens. It needs a special machine to make these pens. This machine is used continuously for 20 hours everyday. The cost of this machine is Rs. 100,000. It is expected to last for 5 years after which it needs to be replaced. The machine will lose value each year as it is used to produce pens. These pens are sold to generate revenue for the company. Therefore, this loss in value or depreciation is considered to be an expense of the business. Different depreciation methods Calculation of depreciation is an estimate. There are many methods used to calculate depreciation. Two most common examples are: Straight line method Declining/Reducing balance method Straight line depreciation method. In this method, the "amount of depreciation" (loss in value) is the same every year. The reasoning behind this is that the firm gets equal benefits over the useful life of the asset. How to calculate? Depreciation=Original cost - salvage value Number of years of useful life Salvage value is the amount of money that you would receive if you sold the asset at the end of its useful life. The useful life is the length of time that you expect to use the asset. Both the salvage value and the number of years of useful life are estimates. Example: A firm has purchased a machine for Rs.100, 000. It is expected to last for 5 years. At the end of its life, it has zero salvage value. Rs.100, 000 – Rs.0 Depreciation = --------------- = Rs. 20,000 Therefore, each year the firm shows depreciation ( loss in value) of this machine as Rs. 20,000 . Implications: 1. Different depreciation methods and estimates will give different net income figures. Copyright© Virtual University of Pakistan 105
  • 106.
    Financial Statement Analysis-FIN621 VU 2. The value of assets shown in the balance sheet will also differ depending on the depreciation method and the estimates used. Limitation # 3 There are certain other items which are not reported in the balance sheet even though the firm may consider them to be of considerable value. Examples Image/reputation of the firm The value of its human resources (people) Summary Financial statements have always been prepared with the emphasis of being Relevant & reliable to the various users of accounting information. In spite of trying to be relevant and reliable, there are certain limitations: 1. Historical accounting methods have a tendency to undervalue the assets of the firm. 2. Different depreciation methods and estimates will report different net income figures in the income statement and different value of assets in the balance sheet. 3. There are certain assets which are not reported in the balance sheet such as the image / reputation of the firm or the value of a firm's human resources causing the value of the company to appear to be lower than it actually is. Copyright© Virtual University of Pakistan 106
  • 107.
    Financial Statement Analysis-FIN621 VU Lesson-25 TYPES OF BUSINESS There are usually three types of Business: service enterprise, merchandise (sale and purchase) enterprise, and manufacturing enterprises. TYPES OF BUSINESS ORGANIZATIONS: Corresponding to three types of business, there are three types of business organizations viz Sole Proprietorship, Partnership firm and Public Limited Companies or Corporations. Different combinations of businesses and business organizations can occur. For example, a sole proprietor can have a manufacturing business or a big corporation can indulge in service enterprise. GAAP apply to financial statements of all the three types of business and business organizations. Sole Proprietorship: It is owned by one person (often acting as manager as well). Examples would be small retail stores, farms, service business and professional practices (law, medicine etc). Accounts of business are however separate from personal accounts of the owner. Legally, the business and owner are not separate. It is unincorporated business in which there is personal liability of owner for debts of business. Creditors look to solvency of owner, rather than financial position of business. Owner is personally liable for all business obligations. If the organization is sued , the proprietor as an individual is sued and has unlimited liability, which means that much of his or her personal property, as well as the assets of the business, may be seized to settle claims. Another problem with a sole proprietorship is the difficulty in raising capital. Because life and success of the business is so dependent on a single individual, a sole proprietorship may not be as attractive to lenders as another form of organization. More over the proprietorship has certain tax disadvantages.. In addition to these drawbacks the proprietorship form makes the transfer of ownership more difficult than does the corporate form. No portion of the enterprise can be transferred to members of the family during the proprietor’s lifetime. For these reasons, this form of organization does not afford the flexibility that other forms do. Partnership: It is unincorporated business owned by two or more persons. Owners voluntarily act as partners. Accounts of firm are separate from personal accounts of owners/partners, which mean there is personal liability of owners for debts of firm. Partnership dissolves on the death or retirements of any of its members/partners. Disadvantages of a Partnership Firm The Local Law restricts the number of partners in a partnership firm to twenty. If the firm needs more capital for its business, the partners may not be in a position to invest more money in the business. Secondly, if the business of the partnership firm is very large and twenty persons can not manage it, they cannot admit new partners in the business. However, there is one exception. The partnership firm of professionals can have more than twenty partners. At this point, need for forming a COMPANY arises. Copyright© Virtual University of Pakistan 107
  • 108.
    Financial Statement Analysis-FIN621 VU Public Limited Companies/Corporations: Ownership of public limited companies vests in individuals, Labour unions, banks, universities and other organizations like mutual funds etc. Ownership is through shareholding by shareholders or stockholders. A corporation is a legal entity having existence separate and distinct from that of its owners. It is an artificial and legal person which can be sued and be sued. Assets of the company or corporation belong to the company itself, not to owners. Creditors of the company thus have a claim against assets of the company, not against the personal property of stockholders. In other words, there is “limited” liability of shareholders; limited to the extent of their shareholding. This is because stockholders own the company but not its assets, which belong to the company itself. It is the corporation which is responsible for its debts, being a legal person. Advantages Of A Limited Company A Limited company enjoys the following benefits: • It can have more than twenty partners, so problem of extra capital is reduced to minimum. • The liabilities of the members of a company is limited to the extent of capital invested by them in the company • There are certain tax benefits to the company, which a partnership firm can not enjoy. • In Pakistan, affairs of limited companies are controlled by COMPANIES ORDINANCE issued in 1984. • The formation of a company and other matters related to companies are governed by SECURITIES AND EXCHANGE COMMISSION OF PAKISTAN (SECP). Types of Companies There are two major types of the companies: • Private limited companies • Public limited companies Private Limited Companies Following are the main characteristics of private limited companies: • Number of members in a private limited company ranges from two to fifty. • Words and parentheses “(Private) Limited” are added at the end of the name of a private limited company. Example: ABC (Private) Limited. • Private limited company can not offer its shares to general public at large. • In case a shareholder decides to sell his shares, his shares are first offered to existing shareholders. If all existing shareholders decide not to purchase these shares, only then, an outsider can buy them. • The shareholders of the private limited company elect two members of the company as Directors. • These directors form a board of directors to run the affairs of the company. • The head of board of directors is called “chief executive”. Public Limited Company Following are the main characteristics of public limited companies: • Minimum number of members in a public limited company is seven Copyright© Virtual University of Pakistan 108
  • 109.
    Financial Statement Analysis-FIN621 VU • There is no restriction on the maximum number of members in a public limited company. • Word “Limited” is added at the end of the name of a public limited company. Example: ABC Limited. • Public limited company can offer its shares to general public at large. • The shareholders of the public limited company elect seven members of the company as Directors. • These directors form a board of directors to run the affairs of the company. • The head of board of directors is called “chief executive”. There are two types of public limited company: • Listed Company • Non Listed Company Listed Company Listed company is that company whose shares are quoted on stock exchange. i.e. whose shares are traded in stock exchange. It is also called quoted company. Non Listed Company Non listed company is that company whose shares are not quoted on stock exchange. i.e. whose shares are not traded in stock exchange. Copyright© Virtual University of Pakistan 109
  • 110.
    Financial Statement Analysis-FIN621 VU Lesson-26 TYPES OF BUSINESS ORGANIZATIONS (Continued) There are also certain closely held companies which are small businesses, restricting ownership to a limited group of stockholders (private). They are not publicly owned. A public limited company has perpetual existence and continuous life (through issue of transferable shares). Unlike partnerships, corporations do not dissolve at the death of any of its directors/shareholders. Board of directors is elected by stockholders of the Corporation. Managers of business are hired and appointed by the Board. Individual stockholders can be hired for management of the business. Ownership and management of public limited companies are however separate. There can be outside directors as well. Costs of incorporating a business as public limited company are charged to an assets account called organization or incorporation costs. These appear in balance sheets under the caption “other Assets”. These are written-off over a five year period. Incorporation of business Approval of competent authority and listing on Stock Exchange is the first step. Approval of Corporate Law Authority under Companies Ordinance, 1984 for issue of Prospectus is also a pre- requisite to incorporation of a business as public limited company. Clearance of Prospectus by Stock Exchange is the next step. However, approval and clearance is no guarantee of correctness of Prospectus contents. Filing of Prospectus and related documents with Registrar of Companies follows. Prospectus gives interalia, objectives and operations of the entity, capital structure, Basis of Allotment of Shares etc. Example of Capital Structure: Authorized share capital Rs.300 m divided into 30 m shares of Rs.10 each. Capital initially proposed to be raised: initial equity capital Rs.200 m. Initial subscription by Sponsors and First Subscribers: Rs.150 m divided into 15 m share of Rs.10 each. Capital offered to public: Rs.50 m divided into 2 m shares of Rs.10 each. Formation of a Company In case of private limited company, any two members and in case of public limited company, any seven members can subscribe their names in Memorandum and Articles of association along with other requirements of the Companies Ordinance 1984; can apply to Security and Exchange Commission for registration of the company. Memorandum of association: Memorandum of association contains the following clauses: • Name of the company with the word “Limited” as the last word of the name, in case of public limited and the parenthesis and the word “(Private Limited)” as the last word of the name, in case of private limited company. • Place of registered office of the company. • Objective of the company. • Amount of share capital with which company proposes to be registered and division in to number of shares. Copyright© Virtual University of Pakistan 110
  • 111.
    Financial Statement Analysis-FIN621 VU • No subscriber of the company shall take less than one share. • Each subscriber of the memorandum shall write opposite to his name, the number of shares held by him. Articles Of Association • Article of association is a document that contains all the policies and other matters which are necessary to run the business of the company. • This is also signed by all the members of the company. When Security and Exchange Commission is satisfied that all the requirements of the Companies Ordinance have been complied with, it issued certificate of incorporation to the company. This certificate is evidence that a separate legal entity has come in to existence. Certificate of Incorporation/Registration When Security and Exchange Commission of Pakistan receives application for registration of a company, the registrar of SECP makes investigation in respect of compliance with legal requirements. When he is satisfied that all legal requirements are complied with. He issues a Certificate of Incorporation/registration to the company. This certificate is evidence that a separate legal entity has formed. The company, after incorporation/Registration has the right to sue and to be sued in its own name. Two types of stock/shareholders: The two types of stockholders or shareholders are common and preferred shareholders. Common stockholders have right to vote in election of directors and in other important actions e.g. mergers, acquisitions, selection of auditors, raising capital etc. They have right to receive dividends if authorized or declared by Board of Directors. No dividend is given on profit on sale of assets, or if the business goes into loss. No interest is given on unpaid dividend. Dividends are declared in General Meeting, but these should not exceed the amount recommended by Board of Directors. Common shareholders have right over assets if company is liquidated, only after creditors and preferred shareholders are paid in full. They are therefore called residual claimants. Preferred shares have priority or preference over common stock in receiving dividends and in the event of liquidation. Dividend is fixed in this case, and does not increase with increase in earnings. Conditions of declaration of dividends by Board of Directors, however exists in this case also. Preferred stockholders have no voting rights. Preferred shares are callable or redeemable at higher price by the company issuing these. Thus these have characteristics of both debt and equity’s, and are sometimes referred to as Hybrid Securities. Copyright© Virtual University of Pakistan 111
  • 112.
    Financial Statement Analysis-FIN621 VU Lesson-27 TYPES OF BUSINESS ORGANIZATIONS (Continued) Authorized Share Capital The maximum amount with which a company gets registration/incorporation is called authorized share capital of that company. This capital can be increased with the prior approval of security and exchange commission. This capital is further divided in to smaller denominations called shares. Each share usually has a face value equal to Rs. 10. According to Companies Ordinance, this face value can be increased but can not be decreased. The value of share written on its face is called face value or par value or nominal value Issued Share Capital When a company issues its shares to general public at large, the amount raised by the company with such an issue is called issued share capital. This is also called Paid up Share Capital.( total amount received by the company). Accounting entry is recorded for issued share capital; no such entry is recorded for authorized share capital. Preliminary Expenses All expenses incurred up to the stage of incorporation of the company are called Preliminary Expenses. All these expenses are incurred by subscribers of the company. The maximum amount with which a company gets registration/incorporation is called authorized share capital of that company. This capital can be increased with the prior approval of security and exchange commission. This capital is further divided in to smaller denominations called shares. Each share usually has a face value equal to Rs. 10. According to Companies Ordinance, this face value can be increased but can not be decreased. The value of share written on its face is called face value. Shares are issued for cash as well as for any asset. For example, if any member of the company sell his/her land to the company. In return, company issue him/her fully paid shares instead of paying cash. Those shares are also part of paid up capital because company has received the benefit of that amount. Share Certificate Share Certificate is the evidence of ownership of the number of shares held by a member of the company. When a company issue more than one share to its member, it does not issue that number of shares to him/her. Instead, it issues a certificate under the stamp of the company that a particular number of shares are issued to members of the company. Shares Issued At Premium When a company has a good reputation and earns huge profits, the demand of its shares increases in the market. In that case, the company is allowed by the Companies Ordinance 1984, to issue shares at a higher price than their face value. Such an issue is called Shares Issued at Premium. The amount received in excess of the face value of the shares is transferred to an account called “Share Premium Account”. This account is used to: • Write off Preliminary Expenses of the company. • Write off the balance amount, in issuing shares on discount. • Issue fully paid Bonus Shares. Copyright© Virtual University of Pakistan 112
  • 113.
    Financial Statement Analysis-FIN621 VU Shares Issued On Discount When a company is not making huge profits, rather it is sustaining loss, the demand of its shares decreases in the market. If the company needs extra funds, then it is allowed by the Companies Ordinance 1984, to issue shares at lesser price than their face value. Such an issue is called Shares Issued on discount. The difference of face value and the amount received is met by share premium account, if available. If there is no share premium account available, this difference is shown in the profit and loss account of that period, in which shares are issued as loss on issue of shares at discount. Capital stock: This signifies ownership of a corporation in the form of shares issued or sold for cash and sometimes in exchange of assets like land, buildings etc., and services (e.g. legal), using market value of shares issued in exchange. It includes common and preferred stock. When only one type of stock is issued, the words “common stock” is used. It is the amount invested by stockholders i.e. paid- in-capital. It is also called “Outstanding Shares” i.e. shares in the hands of stockholders. Stockholders’ equity Rs. Cumulative 8% preferred stock, convertible Rs.100 par value callable or redeemable at Rs.110, authorized 20,000 shares; Issued 10,000 shares. 1,000,000 Common stock Rs.10 Par/stated value, authorized 100,000 shares, Issued and outstanding 50,000 shares. 500,000 Paid-in-capital 1,500,000 Plus additional paid-in-capital+ donated Capital/assets at market value + Retained Earning (or minus accumulated losses). Retained earning transferred to B/Sheet= Opening balance + Net Profit for the year – Dividends. Additional paid-in-capital: shows excess amount received, when stock is sold for more than par value. Underwriters, (banks, investment companies etc) make profit by selling share at higher prices. Retained earnings is an element of stockholders equity, does not indicate the form in which these resources are currently held. These may have been invested in land, building, equipment or any other assets, or might have been used in liquidating debts. Balance Sheet as on June 30 Assets Rs. _____ Current assets. 1,000,000 Fixed assets. 1,692,000 Total assets. 2,692,000 Liabilities & Stockholders’ equity Liabilities Current. 112,000 12% long-term Notes payable 200,000 Outside liabilities. 312,000 Paid-in-capital (from previous slide) 1,500,000 Copyright© Virtual University of Pakistan 113
  • 114.
    Financial Statement Analysis-FIN621 VU Additional Paid-in-Capital, Common stock. 750,000 Retained earnings 130,000 Total Stockholders’ equity. 2,380,000 Total Liabilities & Stockholder equity. 2,692,000 Dividend Profit distributed to the share holders for their investment in the company is called Dividend. Dividend is approved by the share holders in the annual general meeting at the recommendation of the directors. Dividend is paid out of profits. If, in any year, company could not make any profit. No dividend will be paid to share holders. Dividend is paid to registered share holders of the company. Registered share holders are those members of the company, who are enlisted in the register of share holders of the company. Subscribers / Sponsors Of The Company Subscribers / Sponsors are the persons who sign articles and memorandum of the company and contribute in the initial share capital of the company. Issuance Of Further Capital Where a company wants to issue further capital (called raising the capital), shares are first offered to current shareholders. The issuance of further capital to Present Shareholders is called Right Issue. This issue is in proportion to current shares held by the shareholders. The shareholders can accept or reject the offer. If shareholders refuse to accept these shares then these are offered to other people. Journal Entries • Shares issued against cash Debit: Cash / Bank Account Credit: Share Capital Account • Shares issued against transfer of asset: Debit: Asset Account Credit: Share Capital Account This is called issuance of asset in kind. Bonus Shares This is another way of distributing dividend. When a company decides, not to give cash to the share holders as dividend, it issued shares called bonus shares, to the share holders for which it receives no cash. These are fully paid shares. Financial Statements Of Limited Companies In Pakistan, Financial Statements of limited companies are prepared in accordance with: • International accounting standards adopted in Pakistan. • Companies Ordinance 1984. In case of conflict the requirements of Companies Ordinance would prevail over Accounting Standards. Components Of Financial Statements Components of companies’ financial statements are as follows: Copyright© Virtual University of Pakistan 114
  • 115.
    Financial Statement Analysis-FIN621 VU • Balance Sheet • Profit and Loss Account • Cash Flow Statement • Statement of Changes in Equity • Notes to the Accounts • Comparative figures of Previous Period Equity Equity is the total of capital, reserves and undistributed profit. That means the amount contributed by share holders plus accumulated profits of the company. Equity, therefore, represents the total of shareholders fund in the company. Statement Of Changes In Equity The statement of changes in equity shows the movement in the shareholders equity (capital and reserves) during the year. We can say that it replaces profit and loss appropriation account of partnership business. FORMAT OF STATEMENT OF CHANGES IN EQUITY Name of the Company Statement of Changes in Equity For Year Ended June 30, 2002 Share Share Reserves Profit & Total Capital Premium Loss A/c Account Balance On Jun 30, 2000 X X X X X Movements During the Year X X Balance On Jun 30, 2001 X X X X X Movements During the Year X X Balance On June 30, 2002 X X X X X Copyright© Virtual University of Pakistan 115
  • 116.
    Financial Statement Analysis-FIN621 VU Lesson-28 TYPES OF BUSINESS ORGANIZATIONS (Continued) Book Values of equity/share Common stockholders equity (for calculating book value) = Total stockholders equity – call price or redemption value of preferred stock-dividends in arrears on cumulative preferred stock. = 2,380,000 – (10,000x110) – 80,000 (dividend arrears) = 2,380,000 -1,100,000 – 80,000 = 1,200,000 Book value per share common stock = common stockholders equity=1,200,000 =Rs.24 Number of common share 50,000 Book value/share: preferred stock = call price/redemption value = 1,100,000 = Rs.110 Number of preferred share 10,000 Par value or stated value: It is the amount below which stockholders’ equity cannot be reduced (except by losses or special legal action). A dividend cannot be declared if it would cause the stockholders’ equity to fall below the par value. Par value therefore provides minimum cushion of equity capital for protection of creditors. It is therefore called legal capital. Par value, Book value and Market value of Shares are different. Par and Book values of stock are no indication of its market value. In the case of common stock, it is the investors’ expectations, as to the profitability of future operations, which greatly affects the market value of common shares, although other factors also play part. Market value of common stock thus shows the investors’ confidence in the management. On the other hand, market price of preferred share varies inversely with interest rate. In financial markets, stock is the capital raised by a corporation or joint-stock company through the issuance and distribution of shares. A person or organization which holds at least a partial share of stocks is called a shareholder. The aggregate value of a corporation's issued shares is its market capitalization. Types of stock Common stock Common stock also referred to as common or ordinary shares, are, as the name implies, the most usual and commonly held form of stock in a corporation. The other type of shares that the public can hold in a corporation is known as preferred stock. Common stock that has been re-purchased by the corporation is known as treasury stock and is available for a variety of corporate uses. Common stock typically has voting rights in corporate decision matters, though perhaps different rights from preferred stock. In order of priority in a liquidation of a corporation, the owners of common stock are near the last. Dividends paid to the stockholders must be paid to preferred shares before being paid to common stock shareholders. Preferred stock Preferred stock, sometimes called preferred shares, have priority over common stock in the distribution of dividends and assets. Copyright© Virtual University of Pakistan 116
  • 117.
    Financial Statement Analysis-FIN621 VU Most preferred shares provide no voting rights in corporate decision matters. However, some preferred shares have special voting rights to approve certain extraordinary events (such as the issuance of new shares, or the approval of the acquisition of the company), or to elect directors. Dual class stock Dual class stock is shares issued for a single company with varying classes indicating different rights on voting and dividend payments. Each kind of shares has its own class of shareholders entitling different rights. Treasury stock Treasury stock is shares that have been bought back from public. Treasury Stock is considered issued, but not outstanding. Stock Derivatives A stock derivative is any financial claim which has a value that is dependent on the price of the underlying stock. Futures and options are the main types of derivatives on stocks. The underlying security may be a stock index or an individual firm's stock, e.g. single- stock futures. Stock futures are contracts where the buyer, or long, takes on the obligation to buy on the contract maturity date, and the seller, or short takes on the obligation to sell. Stock index futures are generally not delivered in the usual manner, but by cash settlement. A stock option is a class of option. Specifically, a call option is the right (not obligation) to buy stock in the future at a fixed price and a put option is the right (not obligation) to sell stock in the future at a fixed price. Thus, the value of a stock option changes in reaction to the underlying stock of which it is a derivative. The most popular method of valuing stock options is the Black Scholes model Apart from call options granted to employees, most stock options are transferable. Shareholder A shareholder (or stockholder) is an individual or company (including a corporation) that legally owns one or more shares of stock in a joint stock company. Companies listed at the stock market are expected to strive to enhance shareholder value. Shareholders are granted special privileges depending on the class of stock, including the right to vote (usually one vote per share owned) on matters such as elections to the board of directors, the right to share in distributions of the company's income, the right to purchase new shares issued by the company, and the right to a company's assets during a liquidation of the company. However, shareholder's rights to a company's assets are subordinate to the rights of the company's creditors. This means that shareholders typically receive nothing if a company is liquidated after bankruptcy (if the company had had enough to pay its creditors, it would not have entered bankruptcy), although a stock may have value after a bankruptcy if there is the possibility that the debts of the company will be restructured. Shareholders are considered by some to be a partial subset of stakeholders, which may include anyone who has a direct or indirect equity interest in the business entity or someone with even a non-pecuniary interest in a non-profit organization. Thus it might be common to call volunteer contributors to an association stakeholders, even though they are not shareholders. Although directors and officers of a company are bound by fiduciary duties to act in the best interest of the shareholders, the shareholders themselves normally do not have such duties towards each other. Copyright© Virtual University of Pakistan 117
  • 118.
    Financial Statement Analysis-FIN621 VU However, in a few unusual cases, some courts have been willing to imply such a duty between shareholders. For example, in California, majority shareholders of closely held corporations have a duty to not destroy the value of the shares held by minority shareholders. The largest shareholders (in terms of percentages of companies owned) are often mutual funds, and especially passively managed exchange-traded funds. Application The owners of a company may want additional capital to invest in new projects within the company. They may also simply wish to reduce their holding, freeing up capital for their own private use. By selling shares they can sell part or all of the company to many part-owners. The purchase of one share entitles the owner of that share to literally share in the ownership of the company a fraction of the decision-making power, and potentially a fraction of the profits, which the company may issue as dividends. In the common case of a publicly traded corporation, where there may be thousands of shareholders, it is impractical to have all of them making the daily decisions required to run a company. Thus, the shareholders will use their shares as votes in the election of members of the board of directors of the company. In a typical case, each share constitutes one vote. Corporations may, however, issue different classes of shares, which may have different voting rights. Owning the majority of the shares allows other shareholders to be out-voted - effective control rests with the majority shareholder (or shareholders acting in concert). In this way the original owners of the company often still have control of the company. Shareholder rights Although ownership of 51% of shares does result in 51% ownership of a company, it does not give the shareholder the right to use a company's building, equipment, materials, or other property. This is because the company is considered a legal person, thus it owns all its assets itself. This is important in areas such as insurance, which must be in the name of the company and not the main shareholder. Even though the board of directors runs the company, the shareholder has some impact on the company's policy, as the shareholders elect the board of directors. Each shareholder typically has a percentage of votes equal to the percentage of shares he or she owns. So as long as the shareholders agree that the management (agent) are performing poorly they can elect a new board of directors which can then hire a new management team. In practice, however, genuinely contested board elections are rare. Board candidates are usually nominated by insiders or by the board of the directors themselves, and a considerable amount of stock is held and voted by insiders. Owning shares does not mean responsibility for liabilities. If a company goes broke and has to default on loans, the shareholders are not liable in any way. However, all money obtained by converting assets into cash will be used to repay loans and other debts first, so that shareholders cannot receive any money unless and until creditors have been paid (most often the shareholders end up with nothing). Means of financing Financing a company through the sale of stock in a company is known as equity financing. Alternatively, debt financing (for example issuing bonds) can be done to avoid giving up shares of ownership of the company. Unofficial financing known as trade financing usually provides the major Copyright© Virtual University of Pakistan 118
  • 119.
    Financial Statement Analysis-FIN621 VU part of a company's working capital (day-to-day operational needs). Trade financing is provided by vendors and suppliers who sell their products to the company at short-term, unsecured credit terms, usually 30 days. Equity and debt financing are usually used for longer-term investment projects such as investments in a new factory or a new foreign market. Customer provided financing exists when a customer pays for services before they are delivered, e.g. subscriptions and insurance. Trading A stock exchange is an organization that provides a marketplace for either physical or virtual trading shares, bonds and warrants and other financial products where investors (represented by stock brokers) may buy and sell shares of a wide range of companies. A company will usually list its shares by meeting and maintaining the listing requirements of a particular stock exchange and the different. Arbitrage Trading Although it makes sense for some companies to raise capital by offering stock on more than one exchange, in today's era of electronic trading, there is limited opportunity for private investors to make profit on pricing discrepancies between one stock exchange and another. As such, arbitrage opportunities disappear quickly due to the efficient nature of the market. Buying There are various methods of buying and financing stocks. The most common means is through a stock broker. Whether they are a full service or discount broker, they arrange the transfer of stock from a seller to a buyer. Most trades are actually done through brokers listed with a stock exchange. There are many different stock brokers from which to choose, such as full service brokers or discount brokers. The full service brokers usually charge more per trade, but give investment advice or more personal service; the discount brokers offer little or no investment advice but charge less for trades. Another type of broker would be a bank or credit union that may have a deal set up with either a full service or discount broker. There are other ways of buying stock besides through a broker. One way is directly from the company itself. If at least one share is owned, most companies will allow the purchase of shares directly from the company through their investor relations departments. However, the initial share of stock in the company will have to be obtained through a regular stock broker. Another way to buy stock in companies is through Direct Public Offerings which are usually sold by the company itself. A direct public offering is an initial public offering in which the stock is purchased directly from the company, usually without the aid of brokers. When it comes to financing a purchase of stocks there are two ways: purchasing stock with money that is currently in the buyers ownership, or by buying stock on margin. Buying stock on margin means buying stock with money borrowed against the stocks in the same account. These stocks, or collateral, guarantee that the buyer can repay the loan; otherwise, the stockbroker has the right to sell the stock (collateral) to repay the borrowed money. He can sell if the share price drops below the margin requirement, at least 50% of the value of the stocks in the account. Buying on margin works the same way as borrowing money to buy a car or a house, using the car or house as collateral. Moreover, borrowing is not free; the broker usually charges 8-10% interest. Selling Selling stock is procedurally similar to buying stock. Generally, the investor wants to buy low and sell high, if not in that order (short selling); although a number of reasons may induce an investor to sell at a loss, e.g., to avoid further loss. Copyright© Virtual University of Pakistan 119
  • 120.
    Financial Statement Analysis-FIN621 VU As with buying a stock, there is a transaction fee for the broker's efforts in arranging the transfer of stock from a seller to a buyer. This fee can be high or low depending on which type of brokerage, discount or full service, handles the transaction. After the transaction has been made, the seller is then entitled to all of the money. An important part of selling is keeping track of the earnings. Importantly, on selling the stock, in jurisdictions that have them, capital gains taxes will have to be paid on the additional proceeds, if any, that are in excess of the cost basis. ==Stock price fluctuations The price of a stock fluctuates fundamentally due to the theory of supply and demand. Like all commodities in the market, the price of a stock is directly proportional to the demand. However, there are many factors on basis of which the demand for a particular stock may increase or decrease. These factors are studied using methods of fundamental analysis and technical analysis to predict the changes in the stock price. Copyright© Virtual University of Pakistan 120
  • 121.
    Financial Statement Analysis-FIN621 VU Lesson-29 SUMMARY (Previous Lectures) Example • Which of the following are based upon the realization principle and the matching principle (indicate all correct answers). – Adjusting Entries (Matching Principle) – Closing Entries (Matching Principle) – Accrual Basis of Accounting – Measurement of Net Income under GAAP (Matching Principle) Example • Which of the following explains the debit and credit rules relating to recording of Revenues and Expenses: – Expenses appear on the left side of the balance sheet and are recorded by debits. Revenues appear on the right side of the balance sheet and are recorded by credits. (X) – Expenses appear on the left side of the income statement and are recorded by debits. Revenues appear on the right side of the income statement and are recorded by credits. (X) – The effect of revenues and expenses in the owner’s equity. (Tick Correct) – Realization and Matching Principle. (X) Example • The entry to recognize Depreciation expenses (indicate all correct answers): – Is an application of Matching Principle? (Correct) – Is a closing entry. (X) – Usually includes an offsetting credit either to cash or to Accounts payable. (X) – Is an adjusting entry. (Correct) Example • Indicate all correct answers: – In the accounting cycle, closing entries are made before adjusting entries. (X) – Financial Statements may be prepare as soon as adjusted trial balance is completed. (Correct) – The owner’s equity is not up to date until the closing entries have been posted. (Correct) – Adjusting entries are prepared before financial statements are prepared. (Correct) Copyright© Virtual University of Pakistan 121
  • 122.
    Financial Statement Analysis-FIN621 VU Lesson-30 SUMMARY (Previous Lectures) Example • When a business is organized as a corporation: – Stock holders are liable for the debt of the business only in proportion to their percentage ownership in stock. (X) – Stock holders do not have to pay personal income tax on dividends received because the corporation is subject to income tax on its earnings. (X) – Fluctuations in the market value of outstanding shares of capital stock do not affect the amount of stock holders’ equity shown in the balance sheet. (Correct) – Each stock holder has the right to bind the corporation to contracts and to make other managerial decisions. (X) Example Choose the correct answer. • Moosa Corporation was organized with authorization to issue 100,000 shares of Re. 1 par value common stock. 40,000 were issued to Moosa, the company’s founder, but at a price of Rs. 5 per share. No other shares have yet been issued. – Moosa owns 40% of the stock holders’ equity of the corporation. (X) – The corporation should recognize Rs. 160,000 gain in the issuance of these shares. (X) – If the balance sheet includes retained earnings of Rs. 50,000, total paid in capital amounts to Rs. 250,000. (X) – In the balance sheet, additional paid in capital account will have Rs. 160,000 balance, regardless of the profit earned or losses incurred since the organization was organized. (Correct) Example Choose the correct answer. • The statement of cash flows is designed to assist users in assessing each of the following except: – The ability of the company to remain solvent. (X) – In assessing the company’s profitability. (Correct) – Major source of cash receipt during the period. (X) – The reason why net cash flows from operating activities differ from net income. (X) Copyright© Virtual University of Pakistan 122
  • 123.
    Financial Statement Analysis-FIN621 VU Lesson-31 FINANCIAL STATEMENT ANALYSIS Analysis of income statement and balance sheet: Financial Statements are like the Instrument panels of a business. There are different needs of different users of these statements. Users can be outside users and internal users. Identity of user is important, so as to provide him/her with relevant information. Financial statement analysis is the process of examining relationships among financial statement elements and making comparisons with relevant information. It is a valuable tool used by investors and creditors, financial analysts, and others in their decision-making processes related to stocks, bonds, and other financial instruments. The goal in analyzing financial statements is to assess past performance and current financial position and to make predictions about the future performance of a company. Investors who buy stock are primarily interested in a company's profitability and their prospects for earning a return on their investment by receiving dividends and/or increasing the market value of their stock holdings. Creditors and investors who buy debt securities, such as bonds, are more interested in liquidity and solvency: the company's short-and long-run ability to pay its debts. Financial analysts, who frequently specialize in following certain industries, routinely assess the profitability, liquidity, and solvency of companies in order to make recommendations about the purchase or sale of securities, such as stocks and bonds. Analysts can obtain useful information by comparing a company's most recent financial statements with its results in previous years and with the results of other companies in the same industry. Three primary types of financial statement analysis are commonly known as horizontal analysis, vertical analysis, and ratio analysis. Fundamental Analysis Fundamental analysis at company level involves analyzing basic financial variables in order to estimate intrinsic value. These variables include sales, profit margins, depreciation, the tax rate, sources of financing, asset utilization, and other factors. Additional analysis could involve the firm’s competitive position in its industry, labor relations, technological changes, management, foreign competition, and so on. The end result of fundamental analysis at the company level is an estimate of the two factors that determine a security’s value: cash flow stream and a required rate of return (alternatively, a P/E ratio) Industry analysis Industries as well as the market and companies, are analyzed through the study of a wide range of data, including sales, earnings, dividends, capital structure, product lines, regulations, innovations, and so on. Such analysis requires considerable expertise and is usually performed by industry analysts employed by brokerage firms and other institutional investors. A useful first step is to analyze industries in terms of their stage in the life cycle. The idea is to assess the industry’s general health and current position. A second step is to assess the position of the industry in relation to the business cycle and macro economic conditions. A third step involves qualitative analysis of industry characteristics designed to assist investors in assessing the industry’s future prospects. Uses and limitations of financial analysis Ratio analysis is used by three main groups: (1) managers, who employ ratios to help analyze, control, and thus improve their firms’ operations; (2) credit analyst, including bank loan officers and bond rating Copyright© Virtual University of Pakistan 123
  • 124.
    Financial Statement Analysis-FIN621 VU analysts, who analyze ratios to help ascertain a company’s ability to pay its debts; and (3) stock analyst, who are interested in a company’s efficiency, risk, and growth prospects. Many large firms operate different divisions in different industries, and for such companies it is difficult to develop a meaningful set of industry averages. Therefore, ratio analysis is more useful for small, narrowly focused firms than for large, multidivisional ones. Most firms want to be better than average, so merely attaining average performance is not necessarily good. As a target for high-level performance, it is best to focus on the industry leaders’ ratios. Benchmarking helps in this regard. Inflation may have badly distorted firms’ balance sheet- recorded values are often substantially different from “true” values. Further, because inflation affects both depreciation charges and inventory costs, profits are also affected. Thus, a ratio analysis for one firm over time, or a comparative analysis of firms of different ages, must be interpreted with judgment. Seasonal factors can also distort a ratio analysis. For example, the inventory turnover ratio for a food processor will be radically different if the balance sheet figure used for inventory is the one just before versus just after the close of the canning season. This problem can be minimized by using monthly averages for inventory (and receivables) when calculating turnover ratios. Firms can employ “window dressing” techniques to make their financial statements look stronger. Different accounting practices can distort comparisons. As noted earlier, inventory valuation and depreciation methods can affect financial statements and thus distort comparisons among firms. Also, if one firm leases a substantial amount of its productive equipment, its assets may appear low relative to sales because leased assets often do not appear on the balance sheet, at the same time, the liability associated with the lease obligation may not be shown as a debt. Therefore leasing can artificially improve both the turnover and the debt ratios. However accounting professional has taken steps to reduce this problem. It is difficult to generalize about whether a particular ratio is “good” or “bad”. For example, a high current ratio may indicate a strong liquidity position, which is good or excessive cash, which is bad (because excess cash in the bank is a non-earning asset). Similarly, a high fixed assets turnover ratio may denote either that a firm uses its assets efficiently or that is undercapitalized and can not afford to buy enough assets. A firm may have some ratios that look “good” and others that look “bad,” making it difficult to tell whether the company is, on balance, stronger or weak. However statistical procedures can be used to analyze the net effects of a set of ratios. Many banks and other lending organizations use discriminant analysis, a statistical technique, to analyze firms’ financial ratios, and then classify the firms according to their probability of getting into financial trouble. Accounting Information Different Accounting Policies The choices of accounting policies may distort inter company comparisons. Example IAS 16 allows valuation of assets to be based on either revalued amount or at depreciated historical cost. The business may opt not to revalue its asset because by doing so the depreciation charge is going to be high and will result in lower profit. Creative accounting The businesses apply creative accounting in trying to show the better financial performance or position which can be misleading to the users of financial accounting. Like the IAS 16 mentioned above, requires that if an asset is revalued and there is a revaluation deficit, it has to be charged as an expense in income statement, but if it results in revaluation surplus the surplus should be credited to revaluation reserve. So in order to improve on its profitability level the company may select in its revaluation Copyright© Virtual University of Pakistan 124
  • 125.
    Financial Statement Analysis-FIN621 VU programme to revalue only those assets which will result in revaluation surplus leaving those with revaluation deficits still at depreciated historical cost. Information problems Ratios are not definitive measures Ratios need to be interpreted carefully. They can provide clues to the company’s performance or financial situation. But on their own, they cannot show whether Performance is good or bad. Ratios require some quantitative information for an informed analysis to be made. Outdated information in financial statement The figures in a set of accounts are likely to be at least several months out of date, and so might not give a proper indication of the company’s current financial position. Historical costs not suitable for decision making IASB Conceptual framework recommends businesses to use historical cost of accounting. Where historical cost convention is used, asset valuations in the balance sheet could be misleading. Ratios based on this information will not be very useful for decision making. Financial statements certain summarized information Ratios are based on financial statements which are summaries of the accounting records. Through the summarization some important information may be left out which could have been of relevance to the users of accounts. The ratios are based on the summarized year end information which may not be a true reflection of the overall year’s results. Interpretation of the ratio It is difficult to generalize about whether a particular ratio is ‘good’ or ‘bad’. For example a high current ratio may indicate a strong liquidity position, which is good or excessive cash which is bad. Similarly Non current assets turnover ratio may denote either a firm that uses its assets efficiently or one that is under capitalized and cannot afford to buy enough assets. Comparison of performance over time Price changes Inflation renders comparisons of results over time misleading as financial figures will not be within the same levels of purchasing power. Changes in results over time may show as if the enterprise has improved its performance and position when in fact after adjusting for inflationary changes it will show the different picture. Technology changes When comparing performance over time, there is need to consider the changes in technology. The movement in performance should be in line with the changes in technology. For ratios to be more meaningful the enterprise should compare its results with another of the same level of technology as this will be a good basis measurement of efficiency. Copyright© Virtual University of Pakistan 125
  • 126.
    Financial Statement Analysis-FIN621 VU Changes in Accounting policy Changes in accounting policy may affect the comparison of results between different accounting years as misleading. The problem with this situation is that the directors may be able to manipulate the results through the changes in accounting policy. This would be done to avoid the effects of an old accounting policy or gain the effects of a new one. It is likely to be done in a sensitive period, perhaps when the business’s profits are low. Changes in Accounting standard Accounting standards offers standard ways of recognizing, measuring and presenting financial transactions. Any change in standards will affect the reporting of an enterprise and its comparison of results over a number of years. Impact of seasons on trading As stated above, the financial statements are based on year end results which may not be true reflection of results year round. Businesses which are affected by seasons can choose the best time to produce financial statements so as to show better results. For example, a tobacco growing company will be able to show good results if accounts are produced in the selling season. This time the business will have good inventory levels, receivables and bank balances will be at its highest. While as in planting seasons the company will have a lot of liabilities through the purchase of farm inputs, low cash balances and even nil receivables. Inter-firm comparison Different financial and business risk profile No two companies are the same, even when they are competitors in the same industry or market. Using ratios to compare one company with another could provide misleading information. Businesses may be within the same industry but having different financial and business risk. One company may be able to obtain bank loans at reduced rates and may show high gearing levels while as another may not be successful in obtaining cheap rates and it may show that it is operating at low gearing level. To un informed analyst he may feel like company two is better when in fact its low gearing level is because it can not be able to secure further funding. Different capital structures and size Companies may have different capital structures and to make comparison of performance when one is all equity financed and another is a geared company it may not be a good analysis. Impact of Government influence Selective application of government incentives to various companies may also distort intercompany comparison. One company may be given a tax holiday while the other within the same line of business not, comparing the performance of these two enterprises may be misleading. Window dressing These are techniques applied by an entity in order to show a strong financial position. For example, ABC Trucking can borrow on a two year basis, K10 Million on 28th December 2006, holding the proceeds as cash, then pay off the loan ahead of time on 3rd January 2007. This can improve the current Copyright© Virtual University of Pakistan 126
  • 127.
    Financial Statement Analysis-FIN621 VU and quick ratios and make the 2006 balance sheet look good. However the improvement was strictly window dressing as a week later the balance sheet is at its old position. Ratio analysis is useful, but analysts should be aware of these problems and make adjustments as necessary. Ratios analysis conducted in a mechanical, unthinking manner is dangerous, but if used intelligently and with good judgment, it can provide useful insights into the firm’s operations. Three broad areas of evaluating a business are its solvency, stability and profitability, which are studied through analysis of financial statements. There are four techniques of Financial Statements Analysis. ANALYSIS TECHNIQUES 1. Rupee and percentage changes: figures of Financial Statements from one year to the next i.e. year-to-year are considered. Income Statement for the year ending June, 30 2001 2002 2003 Net sales 400 500 600 Cost of Good Sold. 235 300 370 Gross profit. 165 200 230 Other expenses. 115 160 194 Net income. 50 40 36 Percentage change cannot be computed for negative amount or zero amount in base year. Mere figure of rising sales are not sufficient. We have to look at the volume of sales vis-à-vis sale price. Quarterly or monthly measurement is also done. It compares results of current quarter or month with those of the same quarter or month in the previous year in order to take care of distortion by seasonal fluctuations. Size of base amount has to be reasonable (Example: 90% decline to be followed by 900% increase just to get back to the starting point). Percentage become misleading when base is small: 1st year 2nd year 3rd year Income 100,000 10,000 100,000 (90% decline) (900% increase) Copyright© Virtual University of Pakistan 127
  • 128.
    Financial Statement Analysis-FIN621 VU Lesson-32 COMMON –SIZE AND INDEX ANALYSIS Method used by interested parties such as investors, creditors, and management to evaluate the past, current, and projected conditions and performance of the firm. Ratio analysis is the most common form of financial analysis. It provides relative measures of the firm's conditions and performance. Horizontal Analysis and Vertical Analysis are also popular forms. Horizontal analysis is used to evaluate the trend in the accounts over the years, while vertical analysis, also called a Common Size Financial Statement discloses the internal structure of the firm. It indicates the existing relationship between sales and each income statement account. It shows the mix of assets that produce income and the mix of the sources of capital, whether by current or long-term debt or by equity funding. When using the financial ratios, a financial analyst makes two types of comparisons: (a) Industry comparison. The ratios of a firm are compared with those of similar firms or with industry averages or norms to determine how the company is faring relative to its competitors. Industry average ratios are available from a number of sources (b) Trend analysis. A firm's present ratio is compared with its past and expected future ratios to determine whether the company's financial condition is improving or deteriorating over time. After completing the financial statement analysis, the firm's financial analyst will consult with management to discuss plans and prospects, any problem areas identified in the analysis, and possible solutions. Given below is a list of widely used financial ratios. 2. Trend percentages/ Horizontal Analysis/ Index Analysis: This analysis considers changes in items of financial statement from a base year to the following years to show the direction of change. This is also called horizontal analysis. In this, the figures of various years are placed side by side in adjacent columns in the form of comparative financial statements. 3. Component percentages/ Vertical Analysis/ Common- Size Analysis: This type of analysis indicates the relative size of each item in the Financial Statements as a percentage of the total of that Statement i.e. Total Assets or total Liabilities & Shareholders equity in Balance Sheet and Sales in Income Statement. Such a statement is then called common-size Financial Statement. This type of analysis technique is also called Vertical Analysis. Vertical Analysis When using vertical analysis, the analyst calculates each item on a single financial statement as a percentage of a total. The term vertical analysis applies because each year's figures are listed vertically on a financial statement. The total used by the analyst on the income statement is net sales revenue, while on the balance sheet it is total assets. This approach to financial statement analysis, also known as component percentages, produces common-size financial statements. Common-size balance sheets and income statements can be more easily compared, whether across the years for a single company or across different companies Financial statement item that is used as a base value. All other accounts on the financial statement are compared to it. In the balance sheet, for example, total assets equals 100%. Each asset is stated as a percentage of total assets. Similarly, total liabilities and stockholders' equity are assigned 100% with a given liability or equity account stated as a percentage of the total liabilities and stockholders' equity. For the income statement, 100% is assigned to net sales with all revenue and expense accounts related to it. Under vertical analysis, the statements showing the percentages are referred to as Common Size Financial Statements. Common size percentages can be compared from one period to another to identify areas needing attention. An illustration follows: Copyright© Virtual University of Pakistan 128
  • 129.
    Financial Statement Analysis-FIN621 VU Horizontal Analysis When an analyst compares financial information for two or more years for a single company, the process is referred to as horizontal analysis, since the analyst is reading across the page to compare any single line item, such as sales revenues. In addition to comparing dollar amounts, the analyst computes percentage changes from year to year for all financial statement balances, such as cash and inventory. Alternatively, in comparing financial statements for a number of years, the analyst may prefer to use a variation of horizontal analysis called trend analysis. Trend analysis involves calculating each year's financial statement balances as percentages of the first year, also known as the base year. When expressed as percentages, the base year figures are always 100 percent, and percentage changes from the base year can be determined. Time series analysis of financial statements covering more than one accounting period; also called Trend Analysis. It looks at the percentage change in an account over time. The percentage change equals the change over the prior year. For example, if sales in 20X0 are $100,000 and in 20X1 are $300,000, there is a 200% increase ($200,000/$100,000). By examining the magnitude of direction of a financial statement item over time, the analyst can evaluate its reasonableness. Common Size Financial Statement A company financial statement that displays all items as percentages of a common base figure. This type of financial statement allows for easy analysis between companies or between time periods of a company. Copyright© Virtual University of Pakistan 129
  • 130.
    Financial Statement Analysis-FIN621 VU Lesson-33 RATIOS ANALYSIS 4. ANALYSIS BY RATIOS: Financial Ratios are like financial temperatures, which give the state of the health of a business. This analysis technique is most widely used. In these inter-linkages of Income Statement and Balance Sheet items are established and inferences are drawn there from. The analysis technique by Ratios would broadly consist of the following:- a) Analysis by short-term creditors: Interest of short-term creditors is to watch the ability of business to meet its debts as these become due; i.e. Short-term solvency. They want to see whether business has the ability to meet its current liabilities out of its current assets. I the entity can not maintain a short-term debt paying ability, it will not be able to maintain a long-term debt-paying ability, nor will it be able to satisfy its stockholders. Even a very profitable entity will find itself bankrupt if it fails to meet its obligations to short-term creditors. The ability to pay current obligations when due is also related to the cash-generating ability of the firm. While analyzing the short-term debt-paying ability of the firm, we find a close relationship between the current assets and the current liabilities. Generally the current liabilities will be paid with cash generated from the current assets. Profitability of the firm does not determine the short-term debt paying ability. Indicators of this ability are the short-term solvency ratios, which are:- Liquidity Ratios Liquidity Ratios are used to measure a firm’s ability to meet short-term obligations. They compare short-term obligations to short-term (or current) resources available to meet these obligations. From these ratios, much insight can be obtained into the present cash solvency of the firm and the firm’s ability to remain solvent in the event of adversity. i) Current ratio = Current assets Current liabilities (Normal ratio for this is 2:1) Current assets divided by current liabilities. It shows a firm’s ability to cover its current liabilities with its current assets. Higher the current Ratio, the greater the ability of the firm to pay its bills; however, the ratio must be regarded as a crude measure because it does not take into account the liquidity of the individual components of the current assets composed principally of cash and non- overdue receivables is generally regarded as more liquid than a firm whose current assets consist primarily of inventories. Consequently, we turn to a more critical, or sever, test of the firm’s liquidity- the acid test ratio i.e. Current assets should be twice the current liabilities. It should however be noted that too high ratio may indicate that capital is not being used productively and efficiently. Such a situation calls for financial reorganization. ii) Quick ratio. This is also called acid-test ratio. In this, inventories and pre-paid expenses are excluded from current assets. Only cash, marketable securities and Receivables (called Quick Assets) are considered. For Quick Ratio, the normal ratio is 1:1 i.e. quick assets should be equal to current liabilities. It should be noted that current ratio measures “general liquidity”, whereas quick ratio measures “immediate liquidity”. Acid Test Ratio = Current assets- Inventories/ Current Liabilities This ratio serves as a supplement to the current ratio in analyzing liquidity. This ratio is the same as the current ratio except that it excludes inventories. Presumably the least Copyright© Virtual University of Pakistan 130
  • 131.
    Financial Statement Analysis-FIN621 VU liquid portion of current-assets-from the numerator. The ratio concentrates primarily on the more liquid current assets, cash, marketable securities, and receivables, in relation to current obligations. Thus, this ratio provides a more penetrating measure of liquidity than does the current ratio. Cash Ratio = Cash Equivalents + Marketable Securities/ Current Liabilities The cash ratio indicates the immediate liquidity of the firm. A high cash ratio indicates that the firm is not using its cash to its best advantages; cash should be put to work in the operations of the company Copyright© Virtual University of Pakistan 131
  • 132.
    Financial Statement Analysis-FIN621 VU Lesson-34 ACTIVITY RATIOS Activity Ratios also known as efficiency or turn over ratios, measure how effectively the firm is using its assets. Some aspects of activity analysis are closely related to liquidity analysis. Our focus is to attention on how effectively the firm is managing two specific asset groups- receivables and inventories- and its total assets in general. iii) Working capital: It depends upon the size and nature of business. Arithmetically it is the difference of Current Assets and Current Liabilities. Two companies with same working capital can have different current ratios. Similarly two companies may have same current ratio but different working capital. iv) Quality of Working Capital: (A) Liquidity of inventory: To help determined how effectively the firm is managing inventory (and also to gain an indication of the liquidity of inventory) we compute the inventory turn over ratio. This ratio, like other ratios, must be judged in relation to ratios of similar firms, the industry average or both Generally the higher the inventory turn-over , the more efficient the inventory management of the firm and the “fresher” more liquid, the inventory and vice versa. It shows how quickly inventory is sold and is determined by Inventory Turnover Ratio (ITO). It is the number of times the company sells (turns over) it inventory during the year. Inventory Turnover Ratio (ITO) = Cost of good sold for the year____ = 60 = 3 Average inventory during the year 20 The higher the rate, the more quickly the company sells its inventory. However, companies selling high markup items e.g. Jewelry Stores, F-16 can operate successfully with much lower ITO. Days required to sell inventory: i.e. Converting inventory into Receivables = 365 or 300 = 365 or 300 = 122 or 100 ITO 3 3 Copyright© Virtual University of Pakistan 132
  • 133.
    Financial Statement Analysis-FIN621 VU Lesson-35 ACTIVITY RATIOS (Continued) (B) Liquidity of Receivables: It shows have quickly Accounts Receivables are collected i.e. converted into cash. It is determined by Receivable Turnover Ratio (RTO). It is number of times “Receivables” are converted into cash during the year. = net sale for the year = 100 = 10 Average Receivables during the year. 10 Ideally RTO = net credit sales______________ Monthly average of Receivables The higher the RTO, the more liquid the company’s Receivables. Days required to collect Receivables i.e. Converting “Receivable” into cash = 365 or 300 = 36 or 30 Normal credit terms: 30 to 60 days. Length of operating cycle: A+ B (158, 130) days. RATIOS Gross Profit x 100 Gross profit ratio Net sales Net Profit x 100 Net Profit ratio Net sales Operating Profit x 100 Operating Profit ratio Net sales Individual Expenses x 100 Expenses ratios Net sales Operating cost Operating (Cost) Ratio x 100 Net sales Net Profit after inteerest and tax x 100 Net Profit to net worth ratio Net sales Net Profit before interest, tax x 100 Return on capital employed (ROI) Capital employed Net profit avaiable for equity shareholders Earning per share Number of equity shares Dividends per share ______Dividend amunt______ Copyright© Virtual University of Pakistan 133
  • 134.
    Financial Statement Analysis-FIN621 VU Number of equity shares ___Cost or sales ___ Capital employed turnover ratio Capital employed Cost of sales or sales Fixed assets turnover ratio Fixed assets Cost of sales or Net sales Working capital turnover ratio Net working capital _____Cost of goods and sold______ Inventory turnover ration Average accounts receivables ______Annual net credit sales______ Debtors (receivables) turnover ratio Average accounts receivables _______Accounts receivables______ Debtors (receivables) collection period Average accounts receivables ____Net credit pruchases ___ Creditors turnover ratio Average creditors ____Average accounts payables ___ Average credit period Net credit purchase per day _____Current aeests ____ Current ratio Current liabilities _______Quick assets______ Quick ratio/Acid test ratio Current liabilities Debt-equity ratio: ____Total long term debt____ (i) Debt to net worth Shareholder’s funds ______External equity____ (ii) External-internal equity Internal equity ____Total long term debts ___ (iii) Debt vs. funds Total long term funds Earnings before interest and taxes Debt service ratio Fixed interest charges ____Net fixed assets ___ Fixed assets ratio Long-term funds Solvency (Debt to total funds) ____Total liabiities ___ ratio Total assets ____________ Equity _____________ Capital gearing ratio fixed interest bearing securities Copyright© Virtual University of Pakistan 134
  • 135.
    Financial Statement Analysis-FIN621 VU Proprietor’s funds Proprietary ratio Total assets Copyright© Virtual University of Pakistan 135
  • 136.
    Financial Statement Analysis-FIN621 VU Lesson-36 LEVERAGE/DEBT RATIOS (b) Analysis by long-term creditors: Interest of long-term creditors is to see the long-term solvency of the business and rate of return on their loans. Solvency is the ability to meet outside liabilities from total assets. Indicators of solvency are the Long-term Solvency, which are as follows:- i) Debt –To-Total-Assets: The debt-to-total assets ratio is derived by dividing a firm’s total debt by its total assets: It indicates percentage of total assets financed by debt = Total outside liabilities /Debt = 75 = 37.5% Total assets (total liabilities +shareholders funds) 200 From creditors’ point of view, the lower the debt ratio, the better it is because it means that shareholders have contributed the bulk of funds and margin of protection to creditors is high. In addition to the previous ratio, we may wish to compute the following ratio, which deals with only the long-term capitalization of the firm: *Long Term debt/ Total Capitalization (Share capital + Fixed Liabilities) Where total capitalization represents all long-term debt and shareholder’s equity. This tells us the relative importance of long term debt to the capital structure (long-term financing) of the firm. Leverage: It means operating a business with borrowed money. It should be used to earn a return (on assets or equity) greater than cost of borrowing i.e. interest. Alternate term for this is “Gearing”. ii) Equity ratio: Total stockholders equity (including preferred stock) = 125 = 62.5% Total assets (total liabilities + shareholders funds) 200 This is opposite of Debt ratio. Low equity ratio indicates extensive use of leverage i.e. borrowings. iii) Debt-To- Equity: Ratio of borrowed capital to Shareholders’ funds is called Debt – Equity Ratio. The debt-to-equity ratio is computed by simply dividing the total debt of the firm (including current liabilities) by its shareholders’ equity: = 75 = 0.6 i.e. Debt is 0.6 of Equity =Debt Ratio = 37.5: 62.5 (Debt equity Ratio) 125 Equity Ratio Creditors would generally like this ratio to be low. The lower the ratio, the higher the level of firm’s that is being provided by shareholders and the larger the creditor cushion (margin of protection) in the event of shrinking asset values or outright losses. Depending on the purpose for which the ratio is used, preferred stock is sometimes included as debt rather than as equity when debt ratios are calculated. Preferred stock represents a prior claim from the stand point of the investors in common stock: consequently, investors might include preferred stock as debt when analyzing a firm. The ratio of debt to equity will vary according to the nature of the business and the variability of cash flows. A comparison of the debt to equity ratio for a given company with those of similar firms gives us a general indication of the credit worthiness and financial risk of the firm. Copyright© Virtual University of Pakistan 136
  • 137.
    Financial Statement Analysis-FIN621 VU Coverage Ratio Coverage ratios are designed to relate the financial charges of a firm to its ability to service, or cover, them. One of the most traditional coverage ratios is the interest coverage ratio, or times interest earned iv) Interest coverage ratio = operating income available for interest payment = 25 = 5 annual interest expenses. 5 (Normal ratio 3:5) This ratio serves as one measure of the firm’s ability to meet its interest payments and thus avoid bankruptcy. In general, the higher the ratio, the greater the likelihood that the company could cover its interest payments without difficulty. It also sheds some light on the firm’s capacity to take on new debt. Changes in Solvency Ratios indicate changes in enterprise activities; its expansion or contraction. Copyright© Virtual University of Pakistan 137
  • 138.
    Financial Statement Analysis-FIN621 VU Lesson-37 PROFITABILITY RATIOS (C) Analysis by common stockholders: Common Stockholders are the investors whose objective is to determine whether investment is sound, how the business performed and what has are future expectations. Their interest is to watch Return on their investment (ROI). i) Return on Common Stockholder’s equity = Net income applicable to common stock x 100 =20 x100=16% or 10.4% Common stockholder’s equity 125 (excluding other income) It is another summary measure of overall firm performance is return on equity. Return on equity (ROE) compares net profit after taxes (minus preferred stock dividends, if any) to the equity that shareholders have invested in the firm. The ratio tells us the earning power on shareholders ‘ book value investment and is frequently used in comparing two or more firms in an industry. A high return on equity often reflects the firm’s acceptance of strong investment opportunities and effective expensive management.However, if the firm has chosen to employ a level of debt that is high by industry standards, a high ROE might simply be the result of assuming excessive financial risk. With all of the profitability ratios discussed, comparing one company to similar companies and industry standards is extremely valuable. Only by comparisons are we able to judge whether the profitability of a particular company is good or bad, and why? Absolute figures provide some insight, but it is relative performance that is most revealing. If there are two types of Shareholders, the net income applicable to common stock = net income – preferred dividend requirement; and common Stockholders’ equity = total stockholders’ equity – preferred stock equity at issue price – dividend arrears, if any. The shareholders would like to see if this rate is higher than rate of interest paid to long- term creditors or rate of dividend paid to preferred stockholders? If return on equity falls below the rate of interest, it is unfavorable from the viewpoint of common stockholders. ii) Earning per share of common stock =Net income applicable to common shareholders Number of common shares outstanding = 20 =Rs.16 or 13 = Rs.10.4 (excluding other income) 1.25 (each share of Rs.100) 1.25 Decline in EPS is generally followed by decline in market value of common shares though not necessarily to the same extent or percentage. EPS is applied to common stock. Preferred shares have fixed dividends. Before we move on, you should note that there are three types of EPS numbers: Trailing EPS – last year’s numbers and the only actual EPS Current EPS – this year’s numbers, which are still projections Forward EPS – future numbers, which are obviously projections Copyright© Virtual University of Pakistan 138
  • 139.
    Financial Statement Analysis-FIN621 VU iv) Price-earning ratio (P/E) = Market price/share Earning/share Companies with record of rapid growth have P/E ratio of 20 to 1 or even higher. What does P/E tell you? The P/E gives you an idea of what the market is willing to pay for the company’s earnings. The higher the P/E the more the market is willing to pay for the company’s earnings. Some investors read a high P/E as an overpriced stock and that may be the case, however it can also indicate the market has high hopes for this stock’s future and has bid up the price. Conversely, a low P/E may indicate a “vote of no confidence” by the market or it could mean this is a sleeper that the market has overlooked. Known as value stocks, many investors made their fortunes spotting these “diamonds in the rough” before the rest of the market discovered their true worth. What is the “right” P/E? There is no correct answer to this question, because part of the answer depends on your willingness to pay for earnings. The more you are willing to pay, which means you believe the company has good long term prospects over and above its current position, the higher the “right” P/E is for that particular stock in your decision-making process. Another investor may not see the same value and think your “right” P/E is all wrong. iv) Dividend Yield Some stockholders invest primarily to receive regular cash income in the form of dividends. Others do so to secure capital gains through rising market price of common stock. Dividend yield = Dividend per share x 100) % Market price per share Dividend Yield is anticipated annual dividend divided by the market price of the stock. Date Market price EPS P/E Dividend Dividend per share ratio per share yield ---- --------------- ------- ------ ------------ ----------- 31.12.93 160 20.25 8 5 3.1 31.12.94 132 13.2 10 4.8 3.6 The dividend yield on a company stock is the company's annual dividend payments divided by its market cap, or the dividend per share divided by the price per share. It's often expressed as a percentage. Preferred share dividend yield Since payment of the dividend is stipulated by the prospectus, owners of preferred shares calculate multiple yields to reflect the different possible outcomes over the life of the security. Be aware that these yields will be different from the company's point of view. The company will continue to call their security (e.g.) a 6%--- when the stated dividend is 6% of the issue price of the share. • Current yield is the $Dividend / Pfd share current price. • Since the share may be purchased at a lower (higher) cost than its final redemption value, holding it to maturity will result in a capital gain (loss). The annualized rate of gain is calculated using the Present value of a dollar calculation. ('PV' is the current stock price. 'FV' is the redemption value. 'n' Copyright© Virtual University of Pakistan 139
  • 140.
    Financial Statement Analysis-FIN621 VU is the number of years to redemption. Solve for the interest rate 'r'.) The yield to maturity is the sum of this annualized gain (loss) and the current yield. Common share dividend yield Unlike preferred stock, there is no stipulated dividend for common stock. Instead, dividends paid to holders of common stock are set by management, usually in relation to the company's earnings. There is no guarantee that future dividends will match past dividends or even be paid at all. Due to the difficulty in accurately forecasting future dividends, the most commonly-cited figure for dividend yield is the current yield which is calculated using the following formula: Current dividend yield = most recent full -year dividend Current share price For example, take a company which paid dividends totaling $1 last year and whose shares currently sell for $20. Its dividend yield would be calculated as follows = $1/$20 =0.05 =5% Rather than use last year's dividend, some try to estimate what the next year's dividend will be and use this as the basis of a future dividend yield. It should be noted that estimates of future dividend yields are by definition uncertain Dividend Pay out Ratio: Annual cash dividends divided by annual earnings: or alternatively, dividends per share divided by earning per share. The ratio indicates the percentage of a company’s earnings that is paid out to shareholders in cash. Understanding Dividend Payout Ratio The Dividend Payout Ratio (DPR) is one of those numbers. It almost seems like a measurement invented because it looked like it was important, but nobody can really agree on why. The DPR (it usually doesn’t even warrant a capitalized abbreviation) measures what a company’s pays out to investors in the form of dividends. You calculate the DPR by dividing the annual dividends per share by the Earnings Per Share. DPR = Dividends per Share / EPS For example, if a company paid out $1 per share in annual dividends and had $3 in EPS, the DPR would be 33%. ($1 / $3 = 33%) The real question is whether 33% is good or bad and that is subject to interpretation. Growing companies will typically retain more profits to fund growth and pay lower or no dividends. Companies that pay higher dividends may be in mature industries where there is little room for growth and paying higher dividends is the best use of profits (utilities used to fall into this group, although in recent years many of them have been diversifying). Copyright© Virtual University of Pakistan 140
  • 141.
    Financial Statement Analysis-FIN621 VU Either way, you must view the whole DPR issue in the context of the company and its industry. By itself, it tells you very little. Copyright© Virtual University of Pakistan 141
  • 142.
    Financial Statement Analysis-FIN621 VU Lesson-38 PROFITABILITY RATIOS (Continued) d) Analysis by Preferred Stockholders If convertible, interest of preferred stockholders is similar to those of common one. If not, then their interest is similar to that of long-term creditors. Dividend Coverage Ratio: = Net income . Amount of annual preferred dividend Normal Ratio: 5 to 10 Note: Ratios should be used with other elements of financial analysis. Most important is to use common sense and judgments. Also study the industrial sector in which the company operates and relate “Industry Sector” climate to current and projected economic developments. Analysis by management: The main concern of management is to watch the interest of all those who have provided capital to the business. For this, it has to ensure efficient use of capital and resources employed. To watch the interests and needs of customers and clients, the management has to take care of profitability, solvency and long- term stability of the business. It would see as to which operating areas have contributed to success and which have not? It would also determine strengths and weaknesses and reasons thereof. It would also take appropriate measures for improvement and correction. Indicators of profitability: Difference between Profit and Profitability. Profit is an absolute figure whereas profitability is ratio of profit to some other item like sales. (i) Return on total assets = Operating income x 100 = 25 x 10 = 12.5 % Average assets 200 Operating income is used, since interest and income taxes are factors beyond control of management. Also since operating income is earned throughout the year, we relate it to average investment in assets. Return on Total Assets (ROTA). A measure of how effectively a company uses its assets. Calculated by (income before interest and tax) / (fixed assets + current assets). Importance of Return on Total Assets: Smart companies strictly control major purchases, attempting to limit those that will best bring a return in greater revenue to the company. The Return on Total Assets is a useful way to measure how well the company is actually able to make intelligent choices on how to spend its money on new assets. ii) Return on Investment = Operating income = 25 x 100 = 14.3% (Total Assets) Stockholders equity + fixed liabilities (1) 175 Measures overall effectiveness in generating profits with available assets ; earning power of invested capital Copyright© Virtual University of Pakistan 142
  • 143.
    Financial Statement Analysis-FIN621 VU Return on Investment (ROI) analysis is one of several approaches to building a financial business case. The term means that decision makers evaluate the investment by comparing the magnitude and timing of expected gains to the investment costs. Decision makers will also look for ways to improve ROI by reducing costs, increasing gains, or accelerating gains. In the last few decades, this approach has been applied to asset purchase decisions (computer systems or a fleet of vehicles, for example), "go/no-go" decisions for programs of all kinds (including marketing programs, recruiting programs, and training programs), and to more traditional investment decisions Return on Investment (ROI) analysis is one of several approaches to building a financial business case. The term means that decision makers evaluate the investment by comparing the magnitude and timing of expected gains to the investment costs. Decision makers will also look for ways to improve ROI by reducing costs, increasing gains, or accelerating gains. In the last few decades, this approach has been applied to asset purchase decisions (computer systems or a fleet of vehicles, for example), "go/no-go" decisions for programs of all kinds (including marketing programs, recruiting programs, and training programs), and to more traditional investment decisions (such as the management of stock portfolios or the use of venture capital The Simple Return on Investment Return on investment is frequently derived as the “return” (incremental gain) from an action divided by the cost of that action. That is “simple ROI”. For example, what is the ROI for a new marketing program that is expected to cost $500,000 over the next five years and deliver an additional $700,000 in increased profits during the same time? Simple ROI = Gains – Investments costs Investments Costs Simple ROI works well in situations where both the gains and the costs of an investment are easily known and where they clearly result from the action. Other things being equal, the investment with the higher ROI is the better investment. The return on investment metric itself, however, says nothing about the magnitude of returns or risks in the investment. In complex business settings, however, it is not always easy to match specific returns (such as increased profits) with the specific costs that bring them, and this makes ROI less trustworthy as a guide for decision support. Simple ROI also becomes less trustworthy as a useful metric when the cost figures include allocated or indirect costs, which are probably not caused directly by the action or the investment. Business investments typically involve financial consequences extending several years or more. In such cases, the metric has meaning only when the time period is clearly stated. Shorter or longer time periods may produce quite different ROI figures for the same investment. When financial impacts extend across several years, moreover, the analyst must decide whether to use discounted (net present value) figures or non discounted values. Copyright© Virtual University of Pakistan 143
  • 144.
    Financial Statement Analysis-FIN621 VU Return on Sales Ratio What it is? This ratio compares after tax profit to sales. It can help you determine if you are making enough of a return on your sales effort. When to use it? If your company is experiencing a cash flow crunch, it could be because its mark-up is not enough to cover expenses. Return on sales can help point this out, and allow you to adjust prices for an adequate profit. Also, be sure to look for trends in this figure. If it appears to be dropping over time, it could be a signal that you will soon be experiencing financial problems. iii)Return on Sales = Net income x 100 = 20% or 13% Net sales A ratio widely used to evaluate a company's operational efficiency. ROS is also known as a firm's "operating profit margin". This measure is helpful to management, providing insight into how much profit is being produced per dollar of sales. As with many ratios, it is best to compare a company's ROS over time to look for trends, and compare it to other companies in the industry. An increasing ROS indicates the company is growing more efficient, while a decreasing ROS could signal looming financial troubles. iv) Assets turn over ratio: It shows relative effectiveness of assets utilization = Net Sales = 50% Average assets Measures relative Efficiency of total assets to generate sales. Asset turnover measures how effectively a business is using assets to generate sales. It is: Sales ÷assets There are a few variations on this, depending on what measure of assets is used. The most obvious is total assets, i.e., fixed assets + current assets. This measures how many pounds in sales is generated for each pound invested in assets. From an investor's point of view, it can be argued that current liabilities should be deducted from the amount of assets used. Investors are concerned with returns on their investment; therefore the funding of current assets from current liabilities can be ignored. Note: Current liabilities are excluded while calculating Return on Investment, since these are not “investments”. As such ROI is a measure of management’s skill in exploiting moneys invested in the business. Hence “Operating Income” is taken i.e. Income before non-operating expenses and taxes. Copyright© Virtual University of Pakistan 144
  • 145.
    Financial Statement Analysis-FIN621 VU Lesson-39 OPERATING CYCLE Efficiency of operating cycle/process: It is determined by activity ratios, keeping in view the conversion process, which is as follows:- Cash/assets ---- → Inventory ----→ Receivables ---- → Cash Processing Sales, collection Operating Cycle=Inventory sale days (average) +Receivable Collection days (average). The shorter the operating cycle, the higher the quality of current assets and the greater the efficiency of management. Managing Accounts Receivable: The business offers cash discount (2/10, n/30) to encourage early payment or “factors” Receivables i.e. selling Receivables to a financial institution (factor). Cash Cycle The length of time from the actual outlay of cash for purchases until the collection of receivables resulting from the sale of goods or services Current assets (1) are in the form of cash, (2) will be realized in cash, or (3) conserve the use of cash with in the operating cycle of a business or one year, whichever is longer. The five categories of assets usually found in current assets, listed in their order of liquidity, include cash, marketable securities, receivables, inventories, and prepayments. The operating cycle for a company is the time period between the acquisition of goods and the final cash realization resulting from sales and subsequent collections. For example, a food store purchases inventory and then sells the inventory for cash. The relatively short time that the inventory remains an asset of the food store represents a very short operating cycle. In another example, a car manufacturer purchases materials and then uses Labour and overhead to convert these materials into a finished car. A dealer buys the car on credit and then pays the manufacturer. Compared to the food store, the car manufacturer has a much longer operating cycle, but it is still less than a year. Only a few businesses have an operating cycle longer than a year. Cash is a medium of exchange that a bank will accept for deposit and a creditor will accept for payment. To be classified as a current asset, cash must be free from any restrictions that would prevent its deposit or use to pay creditors classified as current. If restricted for specific-short term creditors, many firms still classify this cash under current assets, but they disclose the restrictions. Cash restricted for short-term creditors should be eliminated along with the related amount of short-term debt when determining the short term debt-paying ability. Cash should be available to pay general short-term creditors to be considered as part of the firm’s short-term debt-paying ability. Marketable securities The business entity has varying cash needs throughout the year. Because an inferred cost arises from keeping money available, management does not want to keep all of the entity’s cash need s in the form of cash through the year. The available alternative turns some of the cash into productive use through short-term investments (marketable securities) which can be converted into cash as the need arises. Copyright© Virtual University of Pakistan 145
  • 146.
    Financial Statement Analysis-FIN621 VU To qualify as a marketable security, the investment must be readily marketable, and it must be the intent of management to convert the investment to cash within the operating cycle or one year, whichever is longer. The key element of this test is managerial intent. It is to management advantage to show investments under marketable securities, instead of long-term investments, because this classification improves the liquidity appearance of the firm. When the same securities are carried as marketable securities year after year, they are likely held for a business purpose. For example, the other company may be a major supplier or customer of the firm being analyzed. The firm would not want to sell these securities to pay short-term creditors. Therefore, to be conservative, it is better to reclassify them as investments for analysis purposes. Investments classified as marketable securities should be temporary. Examples of market able securities include treasury bills, short-term notes of corporations, government bonds, corporate bonds, preferred stock, and common stock. Investments in preferred stock and common stock are referred to as marketable equity securities. Receivables An entity usually has a number of claims to future inflows of cash. These claims are usually classified as accounts receivable and notes receivable on the financial statements. the primary claim that that most entities have comes from the selling of merchandise or services on account to customers, referred to as trade receivables, with the customer promising to pay within a limited period of time, such as 30 days. The common characteristic of receivables is that the company expects to receive cash some time in the future. This causes two valuation problems. First, a period of time must pass before the receivable can be collected, so the entity incurs costs for the use of these funds. Second collection may not be made. Inventories Inventor is often the most significant asset in determining the short-term debt paying ability of an entity. Often the inventory account is more than half of the total current assets. Because of the significance of inventories, a special effort should be made to analyze properly this important area. To be classified as inventory, the asset should be for sale in the ordinary course of business, or used or consumed in the production of goods. A trading concern purchases merchandise in a form to sell to customers. Inventories of a trading concern, whether wholesale or retail, usually appear in one inventory account (merchandise inventory). A manufacturing concern produces goods to be sold. Inventories of a manufacturing concern are normally classified in three distinct inventory accounts, inventory available to use in production (raw materials), Inventory in production ( work in process), and inventory completed (Finished goods) Determining Valuation and liquidity is a fairly complicated problem when analyzing inventories. The basic approach to the valuation of inventory uses cost. The cost figure is often difficult to determine, especially when dealing with manufacturing inventory. because of the concept of conservatism, the cost figure may not be acceptable if it can not be recovered. Therefore if the market figure is below cost the inventory is reduced to market. Inventory is stated at lower of cost or market on the financial statements Example No.1 Balance sheet of a business. Assets Liabilities & stockholders’ equity. Current Assets. Current liabilities (37%) 31,629,714 15,387,428 (18%) Copyright© Virtual University of Pakistan 146
  • 147.
    Financial Statement Analysis-FIN621 VU (Includes subscription receivable long-term liabilities (12%) Rs.7, 200,000 10,258,286 Fixed Assets Stockholders’ equity 59,840,000 (70%) (63%) 53,856,000 Total: 85,485,714 Total 85,485,714 ======== ======= Copyright© Virtual University of Pakistan 147
  • 148.
    Financial Statement Analysis-FIN621 VU Lesson-40 STOCKHOLDERS’ EQUITY SECTION OF THE BALANCE SHEET Stockholders’ equity Rs.6 preferred stock, Rs.100 par value, callable at 102, Rs.102, 200,000 Shared authorized Rs. 12, 000,000 Common stock Rs.5 par value, 5,000,000 shares authorized: Issued Rs.10, 000,000 Subscribed Rs. 4,000,000 Rs. 14,000,000 Additional paid-in-capital: Preferred Rs.360, 000 Common (including subscribed shares) 30,800,000 Rs. 31,160,000 Retained earnings Rs. 2,680,000 Total stockholders’ equity Rs.59, 840,000 I) No of preferred shares issued = Rs.12, 000,000(total par value) = 120,000 shares Rs.100 (par value per share) II) Annual divided requirement on outstanding preferred stock = 120,000 (no of shares) x 6(dividend per share) = Rs.720, 000 III) Common shares issued and subscribed = Rs.14, 000,000 (total par value) = 2,800,000 shares. Rs.5 (par value per share) IV) Average price per common share received by the business = 14,000,000(total par value)+ 30,800,000 (additional paid-in-capital) 2,800,000 (shares issued and subscribed) = 44,800,000 = Rs.16 2,800,000 v) Amount per common share due from subscribes = 7,200,000 (subscription receivable) = Rs.9 800,000 shares subscribed i.e. 4,000,000 per value of subscribed shares = 800,000 5, par value of share Copyright© Virtual University of Pakistan 148
  • 149.
    Financial Statement Analysis-FIN621 VU v) Total legal capital = 12,000,000 (preferred) +14,000,000 (common) = Rs.26, 000,000 vii) Total paid-in-capital = Total legal capital + additional paid-in-capital. = 26,000,000 + 31,160,000 = 57,160,000 viii) Book value per common share = Common stock equity Total common share = Total stockholders’ equity – claim of preferred stockholders at callable price 2,800,000 = 59,840,000 – (120,000 shares x 102 callable price) 2,800,000 = 59,840,000 – 12,240,000 2,800,000 = 47,600,000/2,800,000 = Rs.17 Copyright© Virtual University of Pakistan 149
  • 150.
    Financial Statement Analysis-FIN621 VU Lesson-41 STOCKHOLDERS’ EQUITY SECTION OF THE BALANCE SHEET (Continued) Example No:2 MOOSA CORPORATION Balance Sheet as on June 30, ________ 2006 2005 Cash 35,000 25,000 Accounts receivable (net) 91,000 90,000 Inventory 160,000 140,000 Short-term prepayments 4,000 5,000 Investment in land 90,000 100,000 Equipment 880,000 640,000 Less: Accumulated depreciation (260,000) (200,000) Total assets Rs.1, 000,000 Rs.800, 000 ====== ======= 2005-06 2004-05 Accounts payable Rs.105, 000 Rs.46, 000 Income taxes payable and Other accrued liabilities 40,000 25,000 Bonds payable – 8% 280,000 280,000 Premium on bonds payable 3,600 4,000 Capital stock Rs.5 par 165,000 110,000 Retained earnings 406,400 335,000 Total liabilities and stockholders’ equity Rs.1, 000,000 Rs.800, 000 MOOSA CORPORATION Income Statement for the year 2005-06 2004-05 Copyright© Virtual University of Pakistan 150
  • 151.
    Financial Statement Analysis-FIN621 VU Sales (net of discount and allowances) Rs.2, 200,000 Rs.1, 600,000 Cost of goods sold 1,606,000 1,120,000 Gross profit on sales Rs. 594,000 Rs. 480,000 Expenses (including Rs.22, 400 Interest expense) (336,600) (352,000) Income taxes (91,000) (48,000) ________ ________ Net income Rs.166, 400 Rs.80, 000 ======== ======= 2005-06 2004-05 1. Quick ratio: Rs.126, 000 ÷Rs.145, 000 0.9 to 1 Rs.115, 000 ÷ Rs.71, 000 1.6 to 1 2. Current ratio: Rs.290, 000 ÷Rs.145, 000 2 to 1 Rs.260, 000 ÷Rs.71, 000 3.7 to 1 3. Equity ratio: Rs.571,400 ÷ Rs.1,000,000 57% Rs.445,000 ÷ Rs.800,000 56% 4. Debt ratio: Rs.428,600 ÷ Rs.1,000,000 43% Rs.355,000 ÷ Rs.800,000 44% Copyright© Virtual University of Pakistan 151
  • 152.
    Financial Statement Analysis-FIN621 VU Lesson-42 BALANCE SHEET AND INCOME STATEMENT RATIOS 2005-06 2004-05 5. Gross profit percentage: Rs.594, 000 ÷ Rs.2, 200,000 27% Rs.480, 000 ÷Rs.1, 600,000 30% 6. Operating expense ratio: Rs.336, 600 – Rs.22, 400 ÷Rs.2, 200,000 14% Rs.352, 000 – Rs.22, 400 ÷Rs.1.600, 000 20.6% 7. Net income as a percentage of net sales: Rs.166, 400 ÷ Rs.2, 200,000 7.6% Rs.80, 000 ÷ Rs.1, 600,000 5% 8. Inventory turnover (Assume arrange inventory of Rs.150, 000 for both years) = 1,606,000 ÷ 150,000 10.7 times 1,120,000 ÷ 150,000 7.5 times 9. Accounts Receivable turnover (Assume average accounts receivable Rs.90, 000 for (2004-05) = 2,200,000 ÷90,500 24.3 times 1,600,000 ÷90,000 17.8 times 10. Length of operating cycle (Assume 360 working days) = 360 + 360 = 34+15 49 10.7 24.3 360 + 360 = 48 + 20 68 7.5 17.8 Summary of Ratios 1. Percentage Gross Profit on Turnover = (Gross Profit) / (Sales) x 100. 2. Percentage Gross Profit on Cost of Sales = (Gross Profit) / (Cost of Sales) x 100. 3. Percentage Net Income on Turnover = (Net Income) / (Sales) x 100. 4. Percentage Total Expenses on Turnover = (Total Expenses) / (Sales) x 100. 5. Percentage Operating Profit on Turnover = (Operating profit) / (Sales) x 100. 6. Percentage Operating Profit on Cost of Sales = (Operating Profit) / (Cost of Sales) x 100. Copyright© Virtual University of Pakistan 152
  • 153.
    Financial Statement Analysis-FIN621 VU 7. Net Assets = (Total Assets) - (Total Liabilities). 8. Solvency Ratio = (Total Assets) / (Total Liabilities). 9. Net Current Assets = (Current Assets) - (Current Liabilities). 10. Current Ratio = (Current Assets) / (Current Liabilities). 11. Acid-Test Ratio = (Liquid Assets) / (Current Liabilities). 12. Rate of Stock Turnover = (Cost of Sales) / (Average Stock). 13. Period for which Ample Stock is on Hand = (Average Stock) / (Cost of Sales) x (365 days or 12 months). 14. Debtors Average Collection Period = (Average Debtors) / (Credit Sales) x (365 days or 12 months). 15. Creditors Average Payment Period = (Average Creditors) / (Credit Purchases) x (365 days or 12 months). 16. Debt/Equity Ratio = (Total Liabilities) / (Shareholders Equity). This is also known as Risk or Gearing, the extent to which a company is financed by borrowed funds; for example, if a company is highly geared, it borrows a lot. 17. Return on Total Capital Employed = ((Net Profit before Tax)+(Interest on Loan)) / (Average Capital Employed) x 100. 18. Return on Shareholders' Equity = (Net Profit after Tax) / (Average Shareholders' Equity) x 100. 19. Earnings per Share = (Net Profit after Tax) / (Number of Shares Issued) x 100. 20. Dividends per Share = (Dividends on Ordinary Shares) / (Number of Shares Issued) x 100. 21. Net Asset Value per Share = (Shareholders' Equity) / (Number of Shares Issued) x 100. 22. Net Profit before Tax on Turnover = (Net Profit before Tax) / (Turnover) x 100. Copyright© Virtual University of Pakistan 153
  • 154.
    Financial Statement Analysis-FIN621 VU Lesson-43 CASE STUDY Assumption The company you have chosen has hired you as a financial consultant. Assignment Based on your analysis of the firm’s financial statements and any relevant supplementary information you can obtain about the firm and its operating environment, identify areas in which the company is performing well (strengths) and problem areas (weaknesses); Also advise management of corrective measures for improvement. Data The time period for the analysis should include five full years or four years plus interim statements for the most recent year. In addition to the financial statements and other material in the annual reports, you should review relevant materials from outside sources such as newspapers, periodicals and investment resources. Outline The following outline is provided for guidance, but the analysis should be adjusted, as appropriate, to conform to the individual characteristics of the firm. Suggested Outline for the Financial Statement Analysis I. Introduction A. Objective of paper B. Summary of Findings II. Firm, Industry, and Environment A. Description of firm and its management B. Discussion of competitive environment C. Economic climate and outlook D. Other factors, e.g. governmental regulations, Labour relations, Litigations. III. Evaluation of Financial Statements A. Overview B. Short-term liquidity C. Operating efficiency D. Capital structure and long-term solvency E. Profitability F. Market measures IV. Outlook, Summary, and Conclusions A. Outlook for performance, earnings projection B. Summary and Conclusions Table-1 XYZ SUGAR MILLS Copyright© Virtual University of Pakistan 154
  • 155.
    Financial Statement Analysis-FIN621 VU BALANCE SHEET AS ON JUNE 30, . Rs. in million Year 1977 1978 1979 1980 CAPITAL & LIABILITIES Owners’ equity Original Investment by the Controlling 10 10 10 10 Corporation (CC) Current A/C with CC 55 59 65 71 Total equity 65 69 75 81 Less accumulated losses 66 82 94 114 Net equity (1) (13) (19) (33) Current Liabilities 1977 1978 1979 1980 Short-term borrowing 25 26 29 37 Trade creditors (liabilities for 7 12 11 4 expenses) Liabilities for other finances 8 17 13 10 40 55 53 51 Fixed Liabilities Long-term loans 10 13 15 20 Total capital & Liabilities 49 55 49 38 Assets Fixed assets 16 15 14 14 Current assets - Cash 5 4 3 2 -Receivable from Bibo 12 13 15 17 -Other Receivables 2 2 3 3 -Pre-paid 1 1 1 1 - Inventory 13 20 13 1 Total current assets 33 40 35 24 Total Assets 49 55 49 38 ANALYSIS OF BALANCE SHEET No. Table Data/Facts Findings Copyright© Virtual University of Pakistan 155
  • 156.
    Financial Statement Analysis-FIN621 VU 1 1 Balance Sheets for the • Accumulated losses (Rs.114 million as at June year 1976-80 30, 1980) • Constantly losing enterprise. 2 2 Accumulated losses • Losses increasing over the years. over the period. 3 1 Balance Sheet a) Capital cost of the project was Rs.26 million, met through: - Equity Fund from CC Rs.10 million. - Loans from CC: Rs.16 million b) “Current account with “CC” comprises, funds given by CC over the years as working capital. c) Total equity as on 30.06.1980 = Rs.81 million. d) Equity completely eroded by accumulated loss of Rs.114 million. e) Equity eroded since 1976-77 4 1 Borrowing (short- a) Increased from Rs.35 million in 1976-77 to term & long term) Rs.57 million in 1979-80. b) Debt burden increasing because of unit’s inability to repay the principal owing to persistent losses. c) Vicious circle. d) Huge financial charges (Rs.8 million during 1979-80) Copyright© Virtual University of Pakistan 156
  • 157.
    Financial Statement Analysis-FIN621 VU Lesson-44 ANALYSIS OF BALANCE SHEET & INCOME STATEMENT 5 1 Fixed Assets a) Decreasing. b) No depreciation reserve (unable to replace old assets out of its own resources). 6 1 Current Assets: • Bibo had made counter claims • These are doubtful debts. m Bibo:Rs.17 m • No provision for bad debts. • Liquidity overstated. -Book debt = • Interest treated as miscellaneous Rs.6.71 m Income. on 30.06.72 • Treating interest as misc. income understated operating losses by Rs.10.29 million. -Interest over the= • Accumulated loss rises from 114 million to 124 Rs.10.29 m million. period 1972-80 ____ 17 m 7 1 Other Receivables • Loans given to cane growers. • Aging detail. • Loans of Rs.0.5 million outstanding for 6-10 years. • Doubtful/bad loans. • No provision. • Liquidity overstated. 8 3 Liquidity • Current and quick ratios. • Poor liquidity. • Actual ratios much lower in view of doubtful debts. • Cannot repay its current obligations. Table-2 ACCUMULATED LOSS Rs. in million At the end of year 1976-77 1977-78 1978-79 1979-80 Loss for the year 9.5 16.0 12.03 19.8 Accumulated loss 66.0 82.0 94.3 114.1 % increase in accumulated loss 24% 43% 73% over base year (1976-77) Copyright© Virtual University of Pakistan 157
  • 158.
    Financial Statement Analysis-FIN621 VU Table-3 CURRENT AND QUICK RATIOS Rs. in million Year end June 30 1977 1978 1979 1980 Current assets 33 40 35 24 Current assets less inventory & pre- 19 19 21 22 paid Current liabilities 40 55 53 51 Current ratio 0.8:1 0.7:1 0.6:1 0.5:1 Quick ratio 0.5:1 0.3:1 0.3:1 0.4:1 Table-4 XYZ SUGAR MILLS PROFIT AND LOSS ACCOUNT Rs. in thousands Year 1976-77 1977-78 1978-79 1979-80 Sales 58,000 % 52,000 % 42,000 % 20,000 % Cost of Sales Cane, carriage & 35,000 60 38,000 73 24,000 57 16,000 80 incidentals Salaries & Wages 6,000 10 7,000 13 6,000 14 6,000 30 Excise duty 15,000 26 11,000 21 11,000 26 2,000 10 Depreciation 1,000 2 1,000 2 800 2 800 4 Others 3,000 5 3,400 7 3,000 7 2,000 10 Total: 60,000 103 60,400 116 44,800 106 26,800 134 Gross Profit (loss) (2,000) 3 (8,400) 16 (2,800) 6 (6,800) 34 Operating & non-operating expenses Admin & selling 3,000 5 3,000 5 4,000 10 5,000 25 Financial 4,500 8 4,600 9 5,500 13 8,000 40 Total: 7,500 13 7,600 14 9,500 23 13,000 65 Operating (loss) (9,500) 16 (16,000) 30 (12,300) 29 (19,800) 99 Copyright© Virtual University of Pakistan 158
  • 159.
    Financial Statement Analysis-FIN621 VU ‘Others’ consist of: - Cloth & packing material - Stores & Spares - Insurance ANALYSIS OF PROFIT & LOSS ACCOUNT No. DATA/FACTS/DOCUMENTS FINDING 1. Table-4 Profit & Loss Accounts • Bottom line figures: operating losses. • Never made profit. 2. Table-4 -do- • Various costs as % of sales. • Constantly reducing sales. 3. Table-5 Production and capacity • Reduced sugar production. Utilization. • Below capacity utilization. 4. Non availability of cane; feasibility report • Erroneous assumption in PC 1 5. Table-6 Sugarcane procured locally • Only 5 to 44% of plant’s requirement (of 185,000 tons) met locally. 6. Table-7 Total procurement of cane. • Cane crushing capacity = 1500 tons/day normal crushing season = 120 days. • Full requirement of cane never met. • During 1979-80, growers switched to turmeric, they also preferred gurmaking due to its high price. 7 Table-8 Area-wise procurement of • Between 42% to 60% cane brought from sugar-cane far-off places. • Result was excessive cost of transportation, drying up of cane (less recovery percentage). 8 Table-9 Cost of transportation 9% to 14% of cost of cane. 9 Table-10 Per ton cost of • Between Rs.15 to 21. transportation. • Double the cost of other factories. 10 Table-4 P&L Account • High percentage of sale revenues. Cane, Chemical and • Include increased cost of transportation. incidentals. 11 Table-4 Salaries, Wages and • Constantly increasing as % of sales. benefits. • Heavy fixed cost due to: - normal increases. - increase in employee strength. Copyright© Virtual University of Pakistan 159
  • 160.
    Financial Statement Analysis-FIN621 VU 12 Table-11 Employees strength • 53-73% over PC1 strength/seasonal staff as routine. 13 Table-12 Cost of establishment • Very high due to:- per ton of sugar produced - excess employees. - reduced production. 14 Table-13 Productivity per employee • Decreasing. 15 Table-4 Administrative expenses • Increasing as % of sales. • Excess employee strength. 16 Table-4 Financial expenses • Increasing as % of sales Table-14 (range: 8% to 40%) • Why? Because of increased debt burden, and Unit’s inability to pay owing to persisting losses: vicious circle. Table-5 PRODUCTION AND CAPACITY UTILISATION TONS 1976-77 1977-78 1978-79 1979-80 Cane crushing capacity 185,000 185,000 185,000 185,000 Cane crushed 140,292 166,271 93,931 14,375 Capacity utilization 76% 90% 51% 8% Sugar produced 11.344 14,015 8,007 1,206 % recovery 8.08% 8.43% 8.55% 8.38% Table-6 PROCUREMENT OF SUGAR CANE LOCALLY 1976-77 1977-78 1978-79 1979-80 Copyright© Virtual University of Pakistan 160
  • 161.
    Financial Statement Analysis-FIN621 VU Quality procured (Tons) 81,444 81,367 37,857 8,392 Procurement as % of total 44% 44% 20% 5% requirements. Table-7 TOTAL PROCUREMENT OF SUGAR-CANE 1976-77 1977-78 1978-79 1979-80 • Cane procured (tons) 140,292 166,271 93,731 14,375 • % of requirement 76% 90% 51% 8% Table-8 AREA-WISE PROCUREMENT OF SUGAR-CANE TONS 1976-77 1977-78 1978-79 1979-80 Qty % Qty % Qty % Qty % Sugar-cane produced from • Local area 81444 58% 81367 49% 37857 40% 8392 58% •A Distt. 28316 20% 44415 27% 15976 17% 801 6% (200km North) 12395 9% 18361 11% 19164 20% 2439 17% •B Distt. (150km South) 16707 12% 18268 11% 12870 14% 2627 18% •C Area (150km East) 1430 1% 3860 2% 7864 9% 116 1% •D Area (300km West) 140,292 100% 166,271 100% 93,731 100% 14,375 100% Total: Copyright© Virtual University of Pakistan 161
  • 162.
    Financial Statement Analysis-FIN621 VU Lesson-45 SUMMARY OF FINDGINS Table-9 COST OF TRANSPORTATION Rs. in million 1976-77 1977-78 1978-79 1979-80 Cost of cane purchased 22.26 24.51 13.81 2.60 Carriage & incidentals 2.15 3.48 1.95 0.23 Carriage as % of cost 10% 14% 14% 9% Table-10 PER TON COST OF TRANSPORTATION 1976-77 1977-78 1978-79 1979-80 Carriage and incidentals (Rs. in 2.15 3.48 1.95 0.23 million) Cane procured (Tons) 140,292 166,271 93,731 14,375 Average per ton cost (Rs) 15.32 20.92 20.80 16.00 Table-11 EMPLOYEE STRENGTH Actual strength during the years As per PC1 1976-77 1977-78 1978-79 1979-80 Permanent 185 605 625 615 495 Seasonal 556 639 655 590 638 Total 741 1244 1280 1205 1133 % increase 68% 73% 63 % 53% Table-12 COST OF ESTABLISHMENT 1976-77 1977-78 1978-79 1979-80 Cost (Rs. in million) 7.72 9.11 8.90 8.51 Sugar produced (tons) 11344 14015 8007 1206 Cost per ton of sugar (Rs) 681 650 1112 7053 Copyright© Virtual University of Pakistan 162
  • 163.
    Financial Statement Analysis-FIN621 VU Table-13 PRODUCTIVITY PER EMPLOYEE 1976-77 1977-78 1978-79 1979-80 Sugar produced (Tons) 11344 14015 8007 1206 Employee-strength 1244 1280 1205 1133 Productivity per person (Tons) 9.1 10.9 6.6 1.1 Table-14 FINANCIAL EXPENSES Rs. in million 1976-77 1977-78 1978-79 1979-80 Financial expenses 4.5 4.6 5.5 8.0 Sales 58 52 42 20 Financial expenses as % of sales 8% 9% 13% 40% SUMMARY OF FINDGINS No. Area Findings 1. Finance: • Financial position poor • Equity eroded • Debt burden: Rs.57 m • Financial Charges: Rs.8 m • Poor Liquidity 2. Profitability: • Constantly losing. • Losses understand. Reasons: • not enough cane • high transportation cost. • heavy fixed costs. • vicious circle of financial charges 3. Raw Material: • Requires 185,000 tons cane. • Cane from local area: 5-44% only. • Bringing cane from far off places. • erroneous PC1 4. Production: • sugar production capacity: 15,000 ton • Never met target. • High fixed cost of production. 5. Administration: • Excess employees. • Excess per ton cost of establishment. • Low productivity. Copyright© Virtual University of Pakistan 163
  • 164.
    Financial Statement Analysis-FIN621 VU OVERALL ASSESSMENT 1. The unit has been a losing concern over since 1965 when it became operational. Accumulated loss as on June 30, 1980 was over Rs.114 million as against equity of Rs.81 million. Equity thus stood completely eroded. The unit is consequently dependent entirely on debt, which amounted to Rs.57 million as on June 30, 1980. This involved annual financial charges of Rs.8 million. 2. The feasibility of this unit had been projected on the clear assurance that abundant sugar-cane will be available in the vicinity. These assurances proved entirely erroneous. Supplies of sugar-cane from the vicinity were very inadequate. The company has had to supplement procurement by additional purchases from distant areas. This involved excessive cost of transportation. Even then the unit could not manage to procure the required quantity of cane. Below capacity operations of the plant has, therefore, been a crippling constraint. 3. A number of steps are being taken at unit and government level to improve sugar-cane availability. This includes loans to growers for seeds and fertilizers, and award of a higher purchase price for sugar-cane above the controlled rate. These measures are expected to aid the project but it may not, however, still be able to overcome its financial difficulties. 4. The unit could in fact procure only 8% of its cane requirement during 1979-80, of which only 5% was procured locally, despite award of a higher purchase price for sugar-cane above the controlled rate. Inadequate cane availability and heavy fixed costs (due to excessive employee-strength and increasing burden of financial charges) remain serious constraints. 5. The project therefore does not seem to be a viable one. Prospects of its dis-investment and privatization may be seriously looked into. Copyright© Virtual University of Pakistan 164