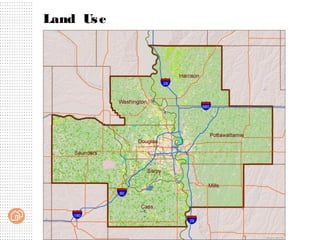
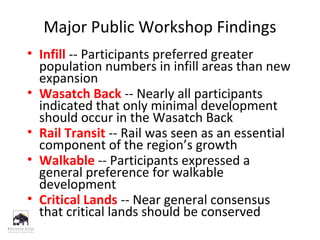
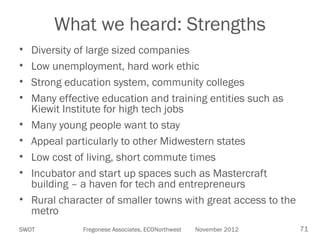
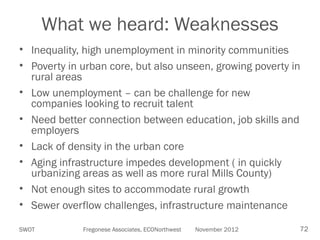
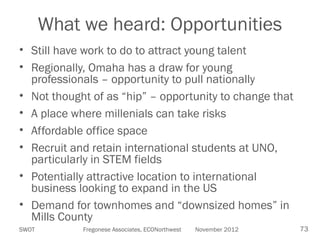
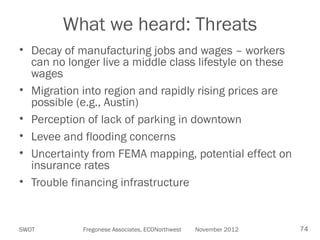
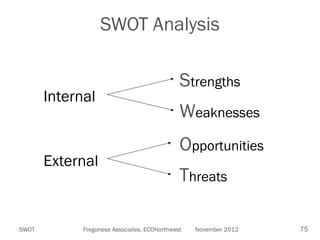
Growing Responsibly. Together.
Land Us e
The P
ubl i c W
orks hops
M
ore t han 500 P
art i c i pant s
Pottawattamie - Oct. 7 — Mid-America Center
Mills Oct. 8 — Our Lady of the Holy Rosary Church, Glenwood
Cass Oct. 8 — Plattsmouth State Bank
Sarpy Oct. 9 — Papillion South High School
Washington Oct. 9 — Blair City Council Chambers
Saunders Oct. 10 — Wahoo Performing Arts Center
Harrison Oct. 10 — Rand Center, Missouri Valley
Douglas - Nov. 5 — Burke High School
Omaha - November 4 - Yates Community Center – Multi-cultural
Belleview – November 4 – Bellevue University
Downtown Omaha - Nov. 5 — KANEKO
Freemont – November 6 – High School
Southeast Metro - Nov. 6 — Kroc Center
East Pottawattamie - Nov. 6 — Oakland Community Center
Northeast Metro - Nov. 7 — Lake Point Community Center
Midtown Omaha - Nov. 7 — Lewis & Clark Middle School
R
egi onal W
orks hops - Chi p
Central Workshop
Housing by individual Table
Average:
136,607 units
Employment by individual Table
Average:
510,464 jobs
Pottawattamie
Table 3
Pottawattamie
Table 5
Sarpy
Table 4
Sarpy
Table 6
Downtown
Business Park
Commercial
Residential
Subdivision
All Chips
From highest to lowest density
North Omaha

Eppley Field
Downtown

Midtown

South Omaha
All Chips
Chips placed
Base Case Housing Units
All Housing
Total housing placed
All Jobs
Total employment
placed
W ch w
hi
oul d c reat e t he
bi gges t pos i t i ve i m t on
pac
heal t h i n t he regi on?
W c h new f orm of t rans i t
hi
s houl d our regi on c ons i der
i nves t i ng i n?
In your opi ni on, w c h
hi
c ont ri but es m t t o t he
os
regi on' s qual i t y of l i f e?
Regional Workshops - Dot
Comments by Category
Comments by Category – Housing
Comments by Subcategory – Housing
Comments by Subcategory - Housing
Top Subcategories
Major Themes
• Cluster development near existing
cities/towns/highways to preserve agricultural land
• Improve employment accessibility by reinforcing
existing infrastructure and investing in transit
• Build single-family housing to attract new jobs and
residents
• Protect/reinforce/improve access to the region’s many
recreational amenities
• Focus on development of industrial
clusters/agribusiness/high-tech related to agriculture
• Revitalize downtowns and protect our existing
historic/cultural amenities
Tonight's workshop
Workshop Game Pieces
Mixed Use

Residential

Commercial

Civic

Employment

Open Space
M ED USE
IX

Office Over Retail

Housing Over Retail

37
Map 6
Map 11
Map 12
Majority (most often used devtype)
Mid City
Mid City Vision:
Pedestrian Connections and Parks

•
•

Convention as pedestrian oriented street connecting entire district
Improve and expand neighborhood parks and connections to schools and
shopping
Major Public Workshop Findings
• Infill -- Participants preferred greater
population numbers in infill areas than new
expansion
• Wasatch Back -- Nearly all participants
indicated that only minimal development
should occur in the Wasatch Back
• Rail Transit -- Rail was seen as an essential
component of the region’s growth
• Walkable -- Participants expressed a
general preference for walkable
development
• Critical Lands -- Near general consensus
that critical lands should be conserved

Design
Scenario A

New and Existing Development
• Continuation of Recent Trends
• Larger lot sizes
• More auto-oriented development will occur.
Scenario B

New and Existing Development
• Baseline - implement adopted plans
• Dispersed development pattern
common in last 20-30 years
Scenario C

New and Existing Development
• More infill and redevelopment
• Growth on new land focused into
walkable, transit-oriented communities
Scenario D

New and Existing Development
• Significant increase in densities
• Extensive infill and redevelopment
• Extensive transit system
Indicators for Scenario Evaluation
Communicating with Values
 Persuade with Reason
 Motivate with

Emotion
Quality Growth Goals and Strategies
•
•
•
•
•
•

Air Quality
Transportation
Open Spaces
Water
Housing
Economy
Safe and Secure Environment

of
Mind

Gateway Value
PERSONAL VALUES

PSYCHO-SOCIAL
CONSEQUENCES

Get Along
With
Others

Personal
Self Esteem
Enjoyment
Self
Personal
Self Esteem
Satisfaction
Security
Family
Accomplishment
Love
Freedom
Makes Me Happy
In
Better Quality
Feel
Control
Healthy
of Life
Do a Better
Less Worry
Less Stress
Job

Feel Good

Feel Safe
Buy Other
Things

FUNCTIONAL
CONSEQUENCES

Become a
Victim of Crime

Save
Money

ATTRIBUTES

(34%)

Peace

Affordable
Living

Commonly
Held Ideas

More
Crowds

Spend Time
With
Family
Do Other Things

Children Handle
Life’s Problems

Save Time

More Car
Children
Accidents
Learn More
Gain
Have More
Knowledge
Choices

Crime

Educational
System
LDS
Outdoor
Church
Recreation
High Income
Population
Good Place for
Level Taxes Growth
Family/Children Scenic
Beauty
The People

Will (Not) Be
Sick

Climate

Traffic
Infrastructure

Air
Quality
Financial Security

(14%)
Peace

of
Mind

PERSONAL VALUES

Personal
Self Esteem
Enjoyment
Self
Personal
Self Esteem
Satisfaction
Security
Family
Accomplishment
Love
Freedom
PSYCHO-SOCIAL
Makes Me Happy
CONSEQUENCES
Better Quality
Feel
Get Along
Provide Care
Healthy
of Life
With
Do a Better
In for Family
Less Worry
Less Stress
Job
Others Control
Feel Good

Feel Safe
Buy Other
Things

FUNCTIONAL
CONSEQUENCES

Become a
Victim of Crime

Save
Money

ATTRIBUTES

Commonly
Held Ideas

More
Crowds

Spend Time
With
Family
Do Other Things

Children Handle
Life’s Problems

Save Time

More Car
Children
Accidents
Learn More
Gain
Have More
Knowledge
Choices

Will (Not) Be
Sick

Affordable
Crime
Climate
Educational
Living
Taxes
System
Employment
High Income
Air
Opportunities
Level
Population
Quality
Good Place for
Traffic
Growth
Employment
Family/Children
Business
Opportunities Business
Opportunities Infrastructure
Opportunities The People
Choosing a Scenario

(Weighted vs. Unweighted Results)
40%

Unweighted results (as represented by the black
dashed line) are nearly identical to weighted results

35%

31%
30%

30%
25%

26%
25%

20%

D
ey
on

d

D

/D

4%
3%
C

/C
B

B

/B

9%
9%

B

B

ey
on

d

A

0%

A

5%

3%
2%
1% 1%
3%
2%
1%
1%
A

10%

13%
13%

C

15%
PUBLIC
AWARENESS
EFFORTS
Television, Radio and
Newspaper
Behind the Scenes
gaining support from key stakeholders
Wasatch Choices
2040
Vision Scenario
Prop 3, 2006
Sc enari o Input s

•
•
•
•
•
•
•
•

Research and Data
Regional Workshops
Small Area Workshops
Values Surveys
Community Leader ASO
Scientific Survey ASO
Developer Interviews
Other…
Heart + Mind

STRATEGIES

Current Growth Trend Not a Good Thing

Base: n=1,001

Q550. Currently there are just over 3 million people living in the San Diego region.
Over the next 25 years, experts project that the size of the population in the San
Diego region will increase by a million making the total number of people living in the
area reach just over 4 million. Do you think that is a good thing or a bad thing?

63
Growth “if done right” Favored
Q585. Below are the opinions of two hypothetical residents. Please indicate which opinion comes closest to your own. Is your opinion
more like Mr. Smith or more like Mr. Jones?

Heart + Mind
Base: n=1,001

Exactly like Smith

3%

Strongly like Smith

13%

Somewhat like Smith

33%

Mr. Jones believes that
growth of any kind in
the San Diego region will
jeopardize the quality of
life for the people in the
region. Mr. Jones believes
that growth should be
strictly managed or
limited.

STRATEGIES

Mr. Smith believes that
growth in the San Diego
region, if done right, will
bring many benefits and
advantages to the
people in the region.
Mr. Smith believes that
growth should be
strongly encouraged
and fostered.

Somewhat like Jones

23%

Strongly like Jones

11%

Exactly like Jones

11%

Neither like Smith and Jones

49%

12%

38%

64
Based on what you have heard or read, which of the
following do you think is the primary cause of the
population growth in San Diego? Is it…

Heart + Mind

STRATEGIES

1.
2.

New births/growing families of people already here
People outside the region moving in

39%
61%
65
People in Region Hold Mistaken Belief About Where
Growth Comes From

People outside the
region moving in

72%

New births/growing
families of people
already here

28%

Heart + Mind

STRATEGIES

They believe…

Actually
63% Internal
37% Outside
Base: n=809

Q560. Based on what you have heard or read, which of the following do you think is the primary cause of the
population growth in the San Diego region? Is it…?

66
Growing Responsibly. Together.
SWOT Workshop

Omaha-Council Bluffs SWOT Analysis Workshop

SWOT

Fregonese Associates, ECONorthwest

November 2012

68
SWOT Analysis

Internal

External

SWOT

Strengths
Weaknesses
Opportunities
Threats

Fregonese Associates, ECONorthwest

November 2012

69
What We Heard
• Held a SWOT work session with the Greater
Omaha Chamber and guests from around
the region

SWOT

Fregonese Associates, ECONorthwest

November 2012

70
What we heard: Strengths
•
•
•
•
•
•
•
•
•

Diversity of large sized companies
Low unemployment, hard work ethic
Strong education system, community colleges
Many effective education and training entities such as
Kiewit Institute for high tech jobs
Many young people want to stay
Appeal particularly to other Midwestern states
Low cost of living, short commute times
Incubator and start up spaces such as Mastercraft
building – a haven for tech and entrepreneurs
Rural character of smaller towns with great access to the
metro

SWOT

Fregonese Associates, ECONorthwest

November 2012

71
What we heard: Weaknesses
• Inequality, high unemployment in minority communities
• Poverty in urban core, but also unseen, growing poverty in
rural areas
• Low unemployment – can be challenge for new
companies looking to recruit talent
• Need better connection between education, job skills and
employers
• Lack of density in the urban core
• Aging infrastructure impedes development ( in quickly
urbanizing areas as well as more rural Mills County)
• Not enough sites to accommodate rural growth
• Sewer overflow challenges, infrastructure maintenance
SWOT

Fregonese Associates, ECONorthwest

November 2012

72
What we heard: Opportunities
• Still have work to do to attract young talent
• Regionally, Omaha has a draw for young
professionals – opportunity to pull nationally
• Not thought of as “hip” – opportunity to change that
• A place where millenials can take risks
• Affordable office space
• Recruit and retain international students at UNO,
particularly in STEM fields
• Potentially attractive location to international
business looking to expand in the US
• Demand for townhomes and “downsized homes” in
Mills County
SWOT

Fregonese Associates, ECONorthwest

November 2012

73
What we heard: Threats
• Decay of manufacturing jobs and wages – workers
can no longer live a middle class lifestyle on these
wages
• Migration into region and rapidly rising prices are
possible (e.g., Austin)
• Perception of lack of parking in downtown
• Levee and flooding concerns
• Uncertainty from FEMA mapping, potential effect on
insurance rates
• Trouble financing infrastructure

SWOT

Fregonese Associates, ECONorthwest

November 2012

74
SWOT Analysis

Internal

External

SWOT

Strengths
Weaknesses
Opportunities
Threats

Fregonese Associates, ECONorthwest

November 2012

75

Steering Committee Presentation- Nov2013

  • 1.
  • 2.
  • 3.
    The P ubl ic W orks hops
  • 4.
    M ore t han500 P art i c i pant s Pottawattamie - Oct. 7 — Mid-America Center Mills Oct. 8 — Our Lady of the Holy Rosary Church, Glenwood Cass Oct. 8 — Plattsmouth State Bank Sarpy Oct. 9 — Papillion South High School Washington Oct. 9 — Blair City Council Chambers Saunders Oct. 10 — Wahoo Performing Arts Center Harrison Oct. 10 — Rand Center, Missouri Valley Douglas - Nov. 5 — Burke High School Omaha - November 4 - Yates Community Center – Multi-cultural Belleview – November 4 – Bellevue University Downtown Omaha - Nov. 5 — KANEKO Freemont – November 6 – High School Southeast Metro - Nov. 6 — Kroc Center East Pottawattamie - Nov. 6 — Oakland Community Center Northeast Metro - Nov. 7 — Lake Point Community Center Midtown Omaha - Nov. 7 — Lewis & Clark Middle School
  • 6.
    R egi onal W orkshops - Chi p
  • 7.
  • 8.
    Housing by individualTable Average: 136,607 units
  • 9.
    Employment by individualTable Average: 510,464 jobs
  • 10.
  • 11.
  • 12.
  • 13.
  • 14.
  • 15.
  • 16.
  • 17.
  • 18.
    All Chips From highestto lowest density North Omaha Eppley Field Downtown Midtown South Omaha
  • 19.
  • 20.
  • 21.
  • 22.
  • 23.
  • 24.
    W ch w hi ould c reat e t he bi gges t pos i t i ve i m t on pac heal t h i n t he regi on?
  • 25.
    W c hnew f orm of t rans i t hi s houl d our regi on c ons i der i nves t i ng i n?
  • 26.
    In your opini on, w c h hi c ont ri but es m t t o t he os regi on' s qual i t y of l i f e?
  • 27.
  • 28.
  • 29.
  • 30.
  • 31.
  • 32.
  • 33.
  • 34.
    Major Themes • Clusterdevelopment near existing cities/towns/highways to preserve agricultural land • Improve employment accessibility by reinforcing existing infrastructure and investing in transit • Build single-family housing to attract new jobs and residents • Protect/reinforce/improve access to the region’s many recreational amenities • Focus on development of industrial clusters/agribusiness/high-tech related to agriculture • Revitalize downtowns and protect our existing historic/cultural amenities
  • 35.
  • 36.
    Workshop Game Pieces MixedUse Residential Commercial Civic Employment Open Space
  • 37.
    M ED USE IX OfficeOver Retail Housing Over Retail 37
  • 39.
  • 40.
  • 41.
  • 42.
    Majority (most oftenused devtype)
  • 43.
    Mid City Mid CityVision: Pedestrian Connections and Parks • • Convention as pedestrian oriented street connecting entire district Improve and expand neighborhood parks and connections to schools and shopping
  • 46.
    Major Public WorkshopFindings • Infill -- Participants preferred greater population numbers in infill areas than new expansion • Wasatch Back -- Nearly all participants indicated that only minimal development should occur in the Wasatch Back • Rail Transit -- Rail was seen as an essential component of the region’s growth • Walkable -- Participants expressed a general preference for walkable development • Critical Lands -- Near general consensus that critical lands should be conserved Design
  • 47.
    Scenario A New andExisting Development • Continuation of Recent Trends • Larger lot sizes • More auto-oriented development will occur.
  • 48.
    Scenario B New andExisting Development • Baseline - implement adopted plans • Dispersed development pattern common in last 20-30 years
  • 49.
    Scenario C New andExisting Development • More infill and redevelopment • Growth on new land focused into walkable, transit-oriented communities
  • 50.
    Scenario D New andExisting Development • Significant increase in densities • Extensive infill and redevelopment • Extensive transit system
  • 51.
  • 52.
    Communicating with Values Persuade with Reason  Motivate with Emotion
  • 53.
    Quality Growth Goalsand Strategies • • • • • • Air Quality Transportation Open Spaces Water Housing Economy
  • 54.
    Safe and SecureEnvironment of Mind Gateway Value PERSONAL VALUES PSYCHO-SOCIAL CONSEQUENCES Get Along With Others Personal Self Esteem Enjoyment Self Personal Self Esteem Satisfaction Security Family Accomplishment Love Freedom Makes Me Happy In Better Quality Feel Control Healthy of Life Do a Better Less Worry Less Stress Job Feel Good Feel Safe Buy Other Things FUNCTIONAL CONSEQUENCES Become a Victim of Crime Save Money ATTRIBUTES (34%) Peace Affordable Living Commonly Held Ideas More Crowds Spend Time With Family Do Other Things Children Handle Life’s Problems Save Time More Car Children Accidents Learn More Gain Have More Knowledge Choices Crime Educational System LDS Outdoor Church Recreation High Income Population Good Place for Level Taxes Growth Family/Children Scenic Beauty The People Will (Not) Be Sick Climate Traffic Infrastructure Air Quality
  • 55.
    Financial Security (14%) Peace of Mind PERSONAL VALUES Personal SelfEsteem Enjoyment Self Personal Self Esteem Satisfaction Security Family Accomplishment Love Freedom PSYCHO-SOCIAL Makes Me Happy CONSEQUENCES Better Quality Feel Get Along Provide Care Healthy of Life With Do a Better In for Family Less Worry Less Stress Job Others Control Feel Good Feel Safe Buy Other Things FUNCTIONAL CONSEQUENCES Become a Victim of Crime Save Money ATTRIBUTES Commonly Held Ideas More Crowds Spend Time With Family Do Other Things Children Handle Life’s Problems Save Time More Car Children Accidents Learn More Gain Have More Knowledge Choices Will (Not) Be Sick Affordable Crime Climate Educational Living Taxes System Employment High Income Air Opportunities Level Population Quality Good Place for Traffic Growth Employment Family/Children Business Opportunities Business Opportunities Infrastructure Opportunities The People
  • 56.
    Choosing a Scenario (Weightedvs. Unweighted Results) 40% Unweighted results (as represented by the black dashed line) are nearly identical to weighted results 35% 31% 30% 30% 25% 26% 25% 20% D ey on d D /D 4% 3% C /C B B /B 9% 9% B B ey on d A 0% A 5% 3% 2% 1% 1% 3% 2% 1% 1% A 10% 13% 13% C 15%
  • 57.
  • 58.
    Behind the Scenes gainingsupport from key stakeholders
  • 59.
  • 60.
  • 62.
    Sc enari oInput s • • • • • • • • Research and Data Regional Workshops Small Area Workshops Values Surveys Community Leader ASO Scientific Survey ASO Developer Interviews Other…
  • 63.
    Heart + Mind STRATEGIES CurrentGrowth Trend Not a Good Thing Base: n=1,001 Q550. Currently there are just over 3 million people living in the San Diego region. Over the next 25 years, experts project that the size of the population in the San Diego region will increase by a million making the total number of people living in the area reach just over 4 million. Do you think that is a good thing or a bad thing? 63
  • 64.
    Growth “if doneright” Favored Q585. Below are the opinions of two hypothetical residents. Please indicate which opinion comes closest to your own. Is your opinion more like Mr. Smith or more like Mr. Jones? Heart + Mind Base: n=1,001 Exactly like Smith 3% Strongly like Smith 13% Somewhat like Smith 33% Mr. Jones believes that growth of any kind in the San Diego region will jeopardize the quality of life for the people in the region. Mr. Jones believes that growth should be strictly managed or limited. STRATEGIES Mr. Smith believes that growth in the San Diego region, if done right, will bring many benefits and advantages to the people in the region. Mr. Smith believes that growth should be strongly encouraged and fostered. Somewhat like Jones 23% Strongly like Jones 11% Exactly like Jones 11% Neither like Smith and Jones 49% 12% 38% 64
  • 65.
    Based on whatyou have heard or read, which of the following do you think is the primary cause of the population growth in San Diego? Is it… Heart + Mind STRATEGIES 1. 2. New births/growing families of people already here People outside the region moving in 39% 61% 65
  • 66.
    People in RegionHold Mistaken Belief About Where Growth Comes From People outside the region moving in 72% New births/growing families of people already here 28% Heart + Mind STRATEGIES They believe… Actually 63% Internal 37% Outside Base: n=809 Q560. Based on what you have heard or read, which of the following do you think is the primary cause of the population growth in the San Diego region? Is it…? 66
  • 67.
  • 68.
    SWOT Workshop Omaha-Council BluffsSWOT Analysis Workshop SWOT Fregonese Associates, ECONorthwest November 2012 68
  • 69.
  • 70.
    What We Heard •Held a SWOT work session with the Greater Omaha Chamber and guests from around the region SWOT Fregonese Associates, ECONorthwest November 2012 70
  • 71.
    What we heard:Strengths • • • • • • • • • Diversity of large sized companies Low unemployment, hard work ethic Strong education system, community colleges Many effective education and training entities such as Kiewit Institute for high tech jobs Many young people want to stay Appeal particularly to other Midwestern states Low cost of living, short commute times Incubator and start up spaces such as Mastercraft building – a haven for tech and entrepreneurs Rural character of smaller towns with great access to the metro SWOT Fregonese Associates, ECONorthwest November 2012 71
  • 72.
    What we heard:Weaknesses • Inequality, high unemployment in minority communities • Poverty in urban core, but also unseen, growing poverty in rural areas • Low unemployment – can be challenge for new companies looking to recruit talent • Need better connection between education, job skills and employers • Lack of density in the urban core • Aging infrastructure impedes development ( in quickly urbanizing areas as well as more rural Mills County) • Not enough sites to accommodate rural growth • Sewer overflow challenges, infrastructure maintenance SWOT Fregonese Associates, ECONorthwest November 2012 72
  • 73.
    What we heard:Opportunities • Still have work to do to attract young talent • Regionally, Omaha has a draw for young professionals – opportunity to pull nationally • Not thought of as “hip” – opportunity to change that • A place where millenials can take risks • Affordable office space • Recruit and retain international students at UNO, particularly in STEM fields • Potentially attractive location to international business looking to expand in the US • Demand for townhomes and “downsized homes” in Mills County SWOT Fregonese Associates, ECONorthwest November 2012 73
  • 74.
    What we heard:Threats • Decay of manufacturing jobs and wages – workers can no longer live a middle class lifestyle on these wages • Migration into region and rapidly rising prices are possible (e.g., Austin) • Perception of lack of parking in downtown • Levee and flooding concerns • Uncertainty from FEMA mapping, potential effect on insurance rates • Trouble financing infrastructure SWOT Fregonese Associates, ECONorthwest November 2012 74
  • 75.

Editor's Notes

  • #7 After you’ve finished with your map, give it a name and choose someone from the group to present your ideas to the rest of the participants in the room. Presentation is voluntary.
  • #37 The primary way to use the basemap is to place stickers on the map to represent different types of places, from neighborhoods to mainstreets.
  • #60 Will serve as the foundation for the growth assumptions for the next lrtp
  • #64 Growth as it is currently happening is a bad thing, causing many problems and threatening our quality of life
  • #65 Growth “done right” can be a solution