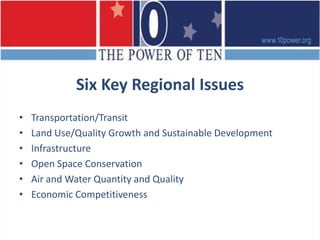
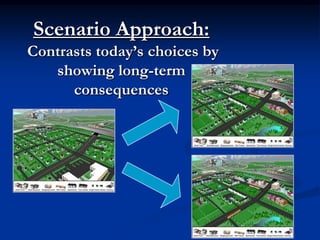
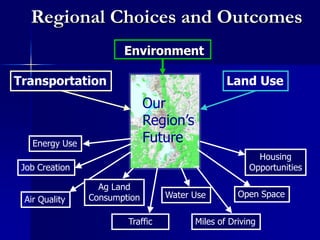
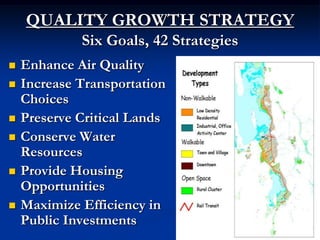
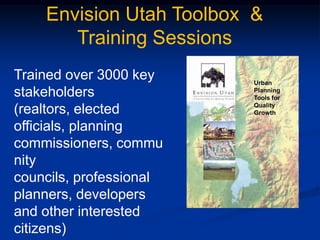
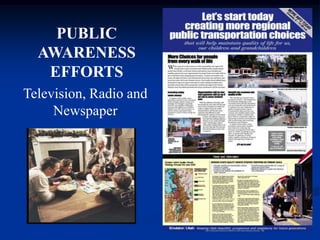
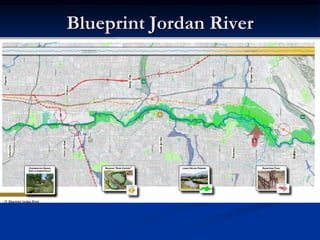
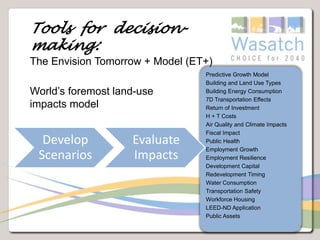
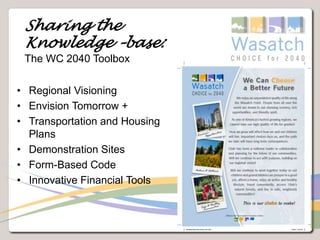
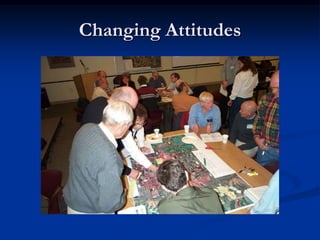
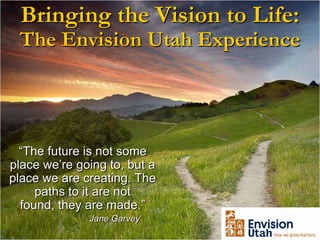
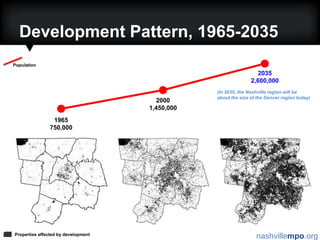
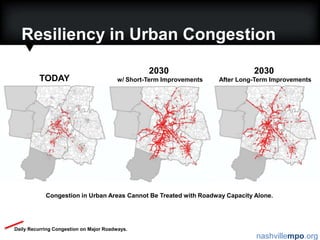
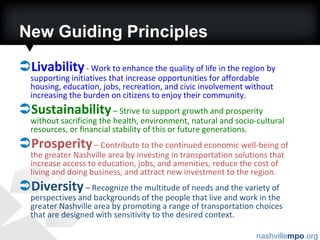
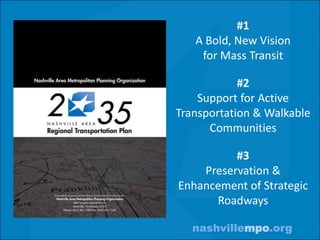
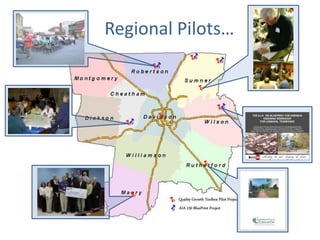
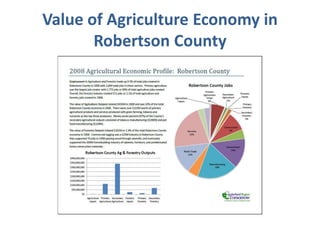
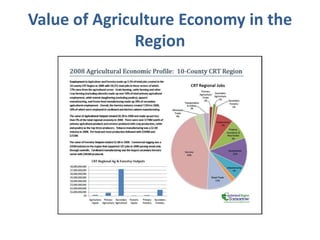
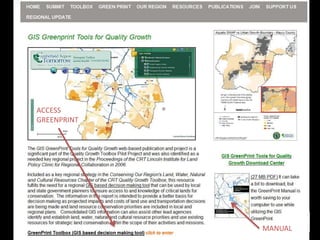
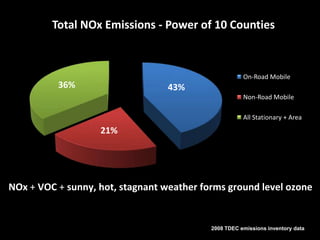
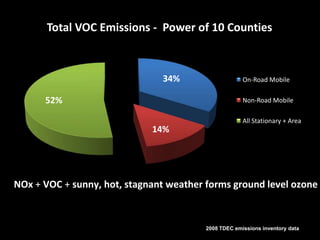
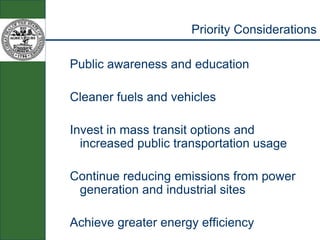
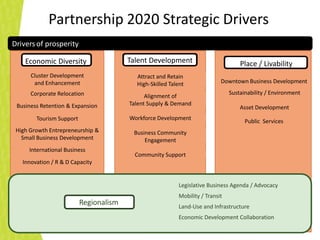
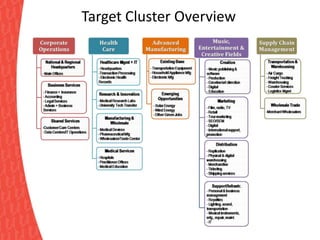
Welcome to The 2011POWER OF TEN Regional Summit
2011 Summit Co-Hosts
2011 Summit Sponsors
2011 Summit Partners
Welcome to The 2011POWER OF TEN Regional Summit
Six Key Regional IssuesTransportation/TransitLand Use/Quality Growth and Sustainable DevelopmentInfrastructureOpen Space ConservationAir and Water Quantity and QualityEconomic Competitiveness 
2011 Regional Summit“Our Region Grows Together through The POWER OF TEN”
2011 Summit Co-Hosts
2011 Summit Sponsors
2011 Summit Partners
Head TableJo Ann GravesJohn SchroerKarl DeanGary ScottBridget JonesCarol PedigoPaul LattureRalph SchulzJim BurtonJeanie NelsonSusan TaylorJohn L BateyMarion Fowlkes
Honored GuestsThe Honorable Bill HaslamThe Honorable John HickenlooperAlan MathesonJohn FreceGeoff AndersonSalinGeevarghese
Special GuestBill HaslamGovernor of Tennessee
National Keynote SpeakerJohn HickenlooperGovernor of Colorado
Regional Keynote SpeakerAlan MathesonExecutive Director of Envision Utah
Bringing the Vision to Life:The Envision Utah Experience“The future is not some place we’re going to, but a place we are creating. The paths to it are not found, they are made.”  		Jane Garvey
Great Things are Happening in Utah!#1 Best State for Business and Careers, 2010 – Forbes1st in the Nation for Economic Outlook, 2010 – ALEC-Laffer, Rich States Poor States1st for Competitive Environment, 2010 – ALEC-Laffer, Rich States Poor States1st for Best Quality of Life 2010 – Business Facilities1st for Economic Dynamism, 2008 – Kauffman Foundation1st for Technology Concentration and Dynamism, 2009 – Milken Institute#1 Most Fiscally Fit State 2010 - Forbes1st for Best Managed State in the Nation – The Pew Center2nd Best Pro-Business State, 2010 – Pollina Report2nd Best Education Climate, 2010 – Business Facilities5th Best City for the Next Decade Salt Lake City 2010 - Kiplinger
The “Utah Model”National Recognition of Utah Collaboration“As a practicing professional planner, I’ve found it refreshing to visit a region that is so intently focused on moving forward with high value placed on the quality of civic engagement, and with leaders so committed to the value of place — and collaborative decision making.”		-- David Boyd, Citiwire (August 2010)“While much of the nation sputters along, Utah continues to reinvent itself in dramatic ways.”	-- Allen Best, Planning Magazine (October 2010)“The most cited success is Envision Utah.”		-- The Washington Post (June 2006)
Regional VisioningA revolution in “scale appropriate” problem solvingEmpowers regions to enhance quality of life and successfully compete in the new global paradigmRegional Visioning is the Natural Evolution of “Place Making” to a Larger Scale
History of Planning in Utah
Utah Faced Serious Challenges in 1997 A million new residents by 2020Air quality at riskDoubling urban land by 2020New water sources needed by 2010Crowding and congestion increasingBusiness and personal costs risingInfrastructure needs outstripping resources
Formed in 1997 to evaluate and address growth issuesNonprofit, nonpartisan, voluntaryPartnership of business, government, community
Greater Wasatch Area10 Counties
  90 Cities and Towns
  157 Special Service DistrictsOver 500 City 	Council MembersOver 500 Planning Commissioners30 County Commissioners90 Mayors100’s of developers, realtors and other key stakeholders
Broad Scope of CommunityBusiness LeadersDevelopersUtility CompaniesLocal and State GovernmentConservation and Citizen GroupsReligious LeadersEducation Media
The Premise of Envision UtahThe “public” has the right to choose its future—public officials should serve that visionThe “public” will make good choices if presented with real options
Improved ProcessVALUES  (What do people want?)          VISION (How will our Region provide it?)			   STRATEGY (How do we implement?)PLAN                                        FUND                                                  BUILD
Regional Visioning Starts with Regional ValuesValues are stable and enduring; life’s “tides” as opposed to the “waves.”Values are widely shared and create consensus among diverse groups.Satisfying ones’ values is the foundation of personal decision making.
Public WorkshopsHundreds ofmeetings with thousandsof participants
Life in UtahPeace                       of MindPERSONAL VALUESSelf EsteemPersonal    EnjoymentSelf          SatisfactionPersonal        SecuritySelf EsteemFamily                LoveAccomplishmentFreedomMakes Me HappyPSYCHO-SOCIAL    CONSEQUENCESBetter Quality          of LifeGet Along           With OthersIn ControlFeel     HealthyDo a Better          JobLess WorryLess StressSpend Time        With FamilyFeel GoodFeel SafeDo Other ThingsBuy Other       ThingsCommonly           Held IdeasBecome a Victim of CrimeFUNCTIONAL CONSEQUENCESChildren Handle Life’s ProblemsSave TimeWill (Not) Be SickMore               CrowdsMore Car    AccidentsSave               MoneyChildren            Learn MoreGain         KnowledgeHave More     ChoicesAffordable LivingCrimeATTRIBUTESClimateEducational    SystemLDS                 ChurchOutdoor    RecreationAir QualityHigh Income          LevelPopulation         GrowthGood Place for Family/ChildrenTrafficTaxesScenic BeautyInfrastructureThe People
To be sustainable, a region must satisfy the values, hopes, and dreams of present and future residents
Values for Creating Great Communities
Personal Growth and WELL-BEINGService OpportunitiesAccess to NatureIntrospection & PonderingSpiritualityPhysical Wellness
educationNeighborhood SchoolsLifelong LearningHigher Education
CommunityCommunity Identity & ActivitiesCommunity InteractionsNeighborliness
NATUREEnvironmental PreservationAccess to NatureContemplative Settings
FAMILYTime TogetherFamily InteractionQuality Recreational Activities
securityEyes on the StreetPeace of MindFewer Accidents
Use Scenarios to Evaluate and Present Choices
Scenario Approach:Contrasts today’s choices by showing long-term consequences
Our Region’s FutureRegional Choices and Outcomes			 EnvironmentTransportationLand UseEnergy UseHousingOpportunitiesJob CreationAg Land ConsumptionOpen SpaceWater UseAir QualityTrafficMiles of Driving
Scenario ANew and Existing Development Continuation of Recent Trends
 Larger lot sizes
 More auto-oriented development will occur.Scenario BNew and Existing Development Baseline - implement adopted plans
 Dispersed development pattern common in last 20-30 yearsScenario CNew and Existing Development More infill and redevelopment
 Growth on new land focused into walkable, transit-oriented communitiesScenario DNew and Existing Development Significant increase in densities
 Extensive infill and redevelopment
 Extensive transit systemLand ConsumptionAnalysis
Vehicle Miles of Travel Per Day
Total EmissionsTons Per Day
Housing Mix: Current and 2020
Total Infrastructure Costs
Choosing a Scenario(Weighted vs. Unweighted Results)Unweighted results (as represented by the black dashed line) are nearly identical to weighted results
QUALITY GROWTH STRATEGYSix Goals, 42 StrategiesEnhance Air QualityIncrease Transportation ChoicesPreserve Critical LandsConserve Water ResourcesProvide Housing OpportunitiesMaximize Efficiency in Public Investments
Envision Utah Toolbox  & Training SessionsTrained over 3000 key stakeholders  (realtors, elected officials, planning commissioners, community councils, professional planners, developers and other interested citizens)Urban Planning Tools for Quality Growth
PUBLIC AWARENESS EFFORTSTelevision, Radio and Newspaper
Quality Growth Demonstration Projects Requests for Town or Site Specific Community Design Workshop
 Design Standards
 Specialized Ordinances
 Master Plans
 Inter-local AgreementsBlueprint Jordan River
Reaching Out to Rural Communities
The Wasatch Choice for 2040
Is it worth it?
Growth Strategy Implementedsave $4.5 billion in future infrastructure costs over the next 20 yearsconserve more land (171 square miles)provide more housing choiceslower emissions resulting in less pollutionreduce water consumptionmake our transportation system more efficient with less congestion on the roads
Mountain View Corridor – a multimodal parallel corridor to I-15An Envision Utah process saved millions of dollars and years of delay
Utah’s Public TransportationDo you favor or oppose the EXPANSION of light rail, often referred to as TRAX, and other public transportation systems?TotalFavor 88%TotalOppose10%
Preparing for Future Transit$185 million acquisition  Purchased 175    miles of  rail     right-of-way Created nine  future transit corridors
Existing Rail SystemTRAX light rail – 15-mile Sandy/Salt Lake Line, opened Dec. 1999TRAX light rail – 2.5-mile University Line, opened Dec. 2001TRAX light rail – 1.5-mile Medical Center Line, opened Sept. 2003 TRAX light rail – 1-mile Intermodal Hub Extension, opened April 2008FrontRunner – 44-mile commuter rail line from Ogden to Salt Lake City, opened April 2008
FrontLines 2015UTA’s project in its history
Building 70 miles of rail in seven years
One project that includes five lines
Mid-Jordan TRAX
West Valley TRAX
FrontRunner South
Draper TRAX
Airport TRAXHUD Livable and Sustainable Communities grant supports Utah’s efforts to implement the Wasatch Choice for 2040—our  regional vision
Implementing the Wasatch Choice for 2040:Creating a framework for collaboration
Communicating the Regional Transportation Plan (RTP)
Developing a Regional Housing Plan
Creating tools for decision-making
Testing the concepts
Sharing the knowledge-baseThe  framework  for collaboration: Partnerships to plan for growth and development
The  Regional Transportation  Plan: Assumes implementation of WC2040Regional approach: WFRC, MAG, MPO, RTP
Multi-modal
Capacity safety and preservation of existing roadway system
Comprehensive transit system: Bus Rapid Transit, streetcar and bus to complement rail systemUtah’s  First  Regional Housing  Plan:  Completed by the Bureau of Economic and Business Research at the University of UtahMarket driven
Focus on housing choiceTools  for  decision-making:  The Envision Tomorrow + Model (ET+)Predictive Growth ModelBuilding and Land Use TypesBuilding Energy Consumption7D Transportation EffectsReturn of InvestmentH + T CostsAir Quality and Climate ImpactsFiscal ImpactPublic HealthEmployment GrowthEmployment ResilienceDevelopment CapitalRedevelopment TimingWater ConsumptionTransportation SafetyWorkforce HousingLEED-ND ApplicationPublic AssetsWorld’s foremost land-use impacts model
Testing  the Concepts:  Six demonstration sites where ET+ will be applied in a collaborative process3900 South TRAX Station – South Salt Lake City / Millcreek Township10000 South – Sandy CityMagna Town Center Provo Intermodal HubSalt Lake City Central Station Salt Lake City Streetcar
Sharing the Knowledge –base: The WC 2040 ToolboxRegional VisioningEnvision Tomorrow +Transportation and HousingPlansDemonstration SitesForm-Based CodeInnovative Financial Tools
Changing Attitudes
1997
2004
Bringing the Vision to Life:The Envision Utah Experience“The future is not some place we’re going to, but a place we are creating. The paths to it are not found, they are made.”  		Jane Garvey
2011 Regional Summit“Our Region Grows Together through The POWER OF TEN”
15 Minute Break
15 Minute Break
2011 Regional Summit“Our Region Grows Together through The POWER OF TEN”
Six Key Regional IssuesTransportation/TransitLand Use/Quality Growth and Sustainable DevelopmentInfrastructureOpen Space ConservationAir and Water Quantity and QualityEconomic Competitiveness 
Middle Tennessee Regional Leaders Panel“Making it Happen through the POWER OF TEN”
Six Key Regional IssuesTransportation/TransitLand Use/Quality Growth and Sustainable DevelopmentInfrastructureOpen Space ConservationAir and Water Quantity and QualityEconomic Competitiveness 
Transportation/TransitMichael SkipperEd Cole
Land Use – Quality Growth and Sustainable DevelopmentMarion FowlkesRick Bernhardt
Infrastructure InvestmentEverett CowanScott Potter
Open Space ConservationDarwin NewtonJulian Bibb
Air and Water Quality and QuantityLarry McElroyBob Martineau
Economic CompetitivenessBert MathewsSusan Whitaker
Michael SkipperExecutive Director of the Nashville Area Metropolitan Planning Organization
Development Pattern, 1965-203520352,600,000(In 2035, the Nashville region will be about the size of the Denver region today)20001,450,0001965750,000PopulationProperties affected by development
Resiliency in Urban Congestion2030 w/ Short-Term Improvements2030 After Long-Term ImprovementsTODAYCongestion in Urban Areas Cannot Be Treated with Roadway Capacity Alone.Daily Recurring Congestion on Major Roadways.
New Guiding PrinciplesLivability - Work to enhance the quality of life in the region by supporting initiatives that increase opportunities for affordable housing, education, jobs, recreation, and civic involvement without increasing the burden on citizens to enjoy their community.Sustainability – Strive to support growth and prosperity without sacrificing the health, environment, natural and socio-cultural resources, or financial stability of this or future generations.Prosperity – Contribute to the continued economic well-being of the greater Nashville area by investing in transportation solutions that increase access to education, jobs, and amenities, reduce the cost of living and doing business, and attract new investment to the region.Diversity – Recognize the multitude of needs and the variety of perspectives and backgrounds of the people that live and work in the greater Nashville area by promoting a range of transportation choices that are designed with sensitivity to the desired context.
#1A Bold, New Vision for Mass Transit#2Support for Active Transportation & Walkable Communities#3Preservation & Enhancement of Strategic Roadways
Ed ColeExecutive Director of the Transit Alliance of Middle Tennessee
Marion FowlkesPrincipal of Centric Architecture and CRT Co-Chair
Quality Growth Toolbox
Rick BernhardtExecutive Director of Nashville Metro Planning Department
Regional Pilots…
Quality Growth Toolbox“All of the concepts, ideas, strategies, tools, and resources presented in the Toolbox greatly improve our Ten Counties and the Cumberland Region as a whole and guide our imminent growth in a way that insures our continued livability and economic vitality.”
Quality Growth Toolbox“Successful implementation of Quality Growth will require collaboration among all of us as never before. Quality communities and regions don’t just occur by happenstance. Desired community and economic development requires thoughtful approaches.”
Toolbox Lead Partners
Everett CowanCEO of AE Guidance and CRT Director
Infrastructure In 10 County RegionConceptual, Planning, Design, or Construction Phase (GNRC)Water/ Waste Water		1.8 B (60% of Total)Other Utilities			435 KTelecommunications		40 MStorm Water			27.5 MSolid Waste			14.7 MRecreation			410 MLaw Enforcement		285 M	Total				3.02 Billion
Infrastructure Report Card by ASCERecreation			D+
Rail				C
Bridges			B-
Roads			B-
Schools			C+
Transit			D
Water/ Wastewater	CScott PotterDirector of Metro Water Services
Darwin NewtonRetired State Soil Scientist with the U.S. Department of Agriculture and CRT Director
Value of Agriculture Economy in Robertson County
Value of Agriculture Economy in the Region
ACCESSGREENPRINTMANUAL
Layers30 layers or data sets of information comprise current Greenprint
Data from wide variety of sources: USGS, TNGIS, NPS, TWRA, TDOT, ECDUses for the GreenprintAnalyzing Data
Projecting different data sets
Comparing scenarios
Setting Priorities
Balancing projects with conservation concernsSumner County Open Space Comprehensive Plan Case Study
Julian BibbAttorney for Stites and Harbison, PLLC and CRT Director
Nashville’s Open Space PlanNASHVILLE:NATURALLY
Four Corners, Nine Bends and a Heart of GreenNASHVILLE:NATURALLYA VISION FOR DAVIDSON COUNTYFour anchor reserves, one in each quadrant of the county
Protected land in each bend of the Cumberland River
A vibrantly green downtown22,000 additional acres protected by 2035Four Corners:Minimum 6,000 acres added to the park system
Minimum 6,000 acres privately protectedNine Bends:10,000 acres of floodplain and other sensitive area
1,500 acres of agricultural land Heart of Green:Add small parks and landscaped gateways
Turn 110 acres of paved surface to natural or pervious Implementation GoalsNASHVILLE::NATURALLY
An open space system is essential to the viability of a region that markets itself on its ‘quality of life’ .The Economic ArgumentNASHVILLE:NATURALLY
 Middle TN Regional Natural ResourcesNASHVILLE::NATURALLY
Larry McElroyGeneral Manger of Consolidated Utility District of Rutherford County
Water is our most precious natural resource. With only 3 percent of the world’s water existing as fresh water, nearly every continent is feeling the affects of the global water crisis.   For some, it’s the lack of clean drinking water. For farmers, it’s the inability to feed the thirst of valuable crops. Just as “easy oil” has dried up, fresh water has become more difficult to access and transport.
Housing Density - 1980
Housing Density - 1990
Housing Density - 2010
Housing Density - 2020
Housing Density - 2030
Cumberland River Basin Municipal and Industrial Water Supply Intakes
Water Manufacturing Plants?Water Treatment PlantsWastewater Plants
Bob MartineauCommissioner of Tennessee Department of Environment and Conservation
Air Quality: Challenges and PrioritiesBob Martineau, CommissionerTennessee Department of Environment and ConservationPower of 10 Regional Summit Nashville, TennesseeMay 25, 2011
The Big PictureAir is cleaner in Tennessee than anytime in the last 40 years – since the passage of the Clean Air Act.Grown our economy at the same time air quality has improved.>20% population increase last decade42% increase in VMT 1990-2009EPA plans to make national standards more stringent to protect human health.
How to Attain Stricter EPA Ozone Standard?Reducing combustion emissions from: Power Plants & Industry                     stationary sourcesIndustrial sites employ low-NOx boilersTVA investments in air pollution control devices and retiring older coal-fired plantsVehicles & Transportation Fuels                                                   mobile sources (on-road and off-road)Improved fleet and fuel economyChanges in Vehicle Miles Traveled (VMT)EPA SmartWay Transportation PartnershipAchieving greater energy efficiency
The Power of Ten Regional Summit 2008 TDEC emissions inventory data

2011 summit powerpoint presentation

  • 1.
    Welcome to The2011POWER OF TEN Regional Summit
  • 2.
  • 3.
  • 4.
  • 5.
    Welcome to The2011POWER OF TEN Regional Summit
  • 6.
    Six Key RegionalIssuesTransportation/TransitLand Use/Quality Growth and Sustainable DevelopmentInfrastructureOpen Space ConservationAir and Water Quantity and QualityEconomic Competitiveness 
  • 7.
    2011 Regional Summit“OurRegion Grows Together through The POWER OF TEN”
  • 8.
  • 9.
  • 10.
  • 11.
    Head TableJo AnnGravesJohn SchroerKarl DeanGary ScottBridget JonesCarol PedigoPaul LattureRalph SchulzJim BurtonJeanie NelsonSusan TaylorJohn L BateyMarion Fowlkes
  • 12.
    Honored GuestsThe HonorableBill HaslamThe Honorable John HickenlooperAlan MathesonJohn FreceGeoff AndersonSalinGeevarghese
  • 13.
  • 14.
    National Keynote SpeakerJohnHickenlooperGovernor of Colorado
  • 15.
    Regional Keynote SpeakerAlanMathesonExecutive Director of Envision Utah
  • 16.
    Bringing the Visionto Life:The Envision Utah Experience“The future is not some place we’re going to, but a place we are creating. The paths to it are not found, they are made.” Jane Garvey
  • 17.
    Great Things areHappening in Utah!#1 Best State for Business and Careers, 2010 – Forbes1st in the Nation for Economic Outlook, 2010 – ALEC-Laffer, Rich States Poor States1st for Competitive Environment, 2010 – ALEC-Laffer, Rich States Poor States1st for Best Quality of Life 2010 – Business Facilities1st for Economic Dynamism, 2008 – Kauffman Foundation1st for Technology Concentration and Dynamism, 2009 – Milken Institute#1 Most Fiscally Fit State 2010 - Forbes1st for Best Managed State in the Nation – The Pew Center2nd Best Pro-Business State, 2010 – Pollina Report2nd Best Education Climate, 2010 – Business Facilities5th Best City for the Next Decade Salt Lake City 2010 - Kiplinger
  • 18.
    The “Utah Model”NationalRecognition of Utah Collaboration“As a practicing professional planner, I’ve found it refreshing to visit a region that is so intently focused on moving forward with high value placed on the quality of civic engagement, and with leaders so committed to the value of place — and collaborative decision making.” -- David Boyd, Citiwire (August 2010)“While much of the nation sputters along, Utah continues to reinvent itself in dramatic ways.” -- Allen Best, Planning Magazine (October 2010)“The most cited success is Envision Utah.” -- The Washington Post (June 2006)
  • 19.
    Regional VisioningA revolutionin “scale appropriate” problem solvingEmpowers regions to enhance quality of life and successfully compete in the new global paradigmRegional Visioning is the Natural Evolution of “Place Making” to a Larger Scale
  • 21.
  • 22.
    Utah Faced SeriousChallenges in 1997 A million new residents by 2020Air quality at riskDoubling urban land by 2020New water sources needed by 2010Crowding and congestion increasingBusiness and personal costs risingInfrastructure needs outstripping resources
  • 23.
    Formed in 1997to evaluate and address growth issuesNonprofit, nonpartisan, voluntaryPartnership of business, government, community
  • 24.
  • 25.
    90Cities and Towns
  • 26.
    157Special Service DistrictsOver 500 City Council MembersOver 500 Planning Commissioners30 County Commissioners90 Mayors100’s of developers, realtors and other key stakeholders
  • 27.
    Broad Scope ofCommunityBusiness LeadersDevelopersUtility CompaniesLocal and State GovernmentConservation and Citizen GroupsReligious LeadersEducation Media
  • 28.
    The Premise ofEnvision UtahThe “public” has the right to choose its future—public officials should serve that visionThe “public” will make good choices if presented with real options
  • 29.
    Improved ProcessVALUES (What do people want?) VISION (How will our Region provide it?) STRATEGY (How do we implement?)PLAN FUND BUILD
  • 30.
    Regional Visioning Startswith Regional ValuesValues are stable and enduring; life’s “tides” as opposed to the “waves.”Values are widely shared and create consensus among diverse groups.Satisfying ones’ values is the foundation of personal decision making.
  • 31.
    Public WorkshopsHundreds ofmeetingswith thousandsof participants
  • 32.
    Life in UtahPeace of MindPERSONAL VALUESSelf EsteemPersonal EnjoymentSelf SatisfactionPersonal SecuritySelf EsteemFamily LoveAccomplishmentFreedomMakes Me HappyPSYCHO-SOCIAL CONSEQUENCESBetter Quality of LifeGet Along With OthersIn ControlFeel HealthyDo a Better JobLess WorryLess StressSpend Time With FamilyFeel GoodFeel SafeDo Other ThingsBuy Other ThingsCommonly Held IdeasBecome a Victim of CrimeFUNCTIONAL CONSEQUENCESChildren Handle Life’s ProblemsSave TimeWill (Not) Be SickMore CrowdsMore Car AccidentsSave MoneyChildren Learn MoreGain KnowledgeHave More ChoicesAffordable LivingCrimeATTRIBUTESClimateEducational SystemLDS ChurchOutdoor RecreationAir QualityHigh Income LevelPopulation GrowthGood Place for Family/ChildrenTrafficTaxesScenic BeautyInfrastructureThe People
  • 33.
    To be sustainable,a region must satisfy the values, hopes, and dreams of present and future residents
  • 34.
    Values for CreatingGreat Communities
  • 35.
    Personal Growth andWELL-BEINGService OpportunitiesAccess to NatureIntrospection & PonderingSpiritualityPhysical Wellness
  • 36.
  • 37.
    CommunityCommunity Identity &ActivitiesCommunity InteractionsNeighborliness
  • 38.
    NATUREEnvironmental PreservationAccess toNatureContemplative Settings
  • 39.
  • 40.
    securityEyes on theStreetPeace of MindFewer Accidents
  • 41.
    Use Scenarios toEvaluate and Present Choices
  • 42.
    Scenario Approach:Contrasts today’schoices by showing long-term consequences
  • 43.
    Our Region’s FutureRegionalChoices and Outcomes EnvironmentTransportationLand UseEnergy UseHousingOpportunitiesJob CreationAg Land ConsumptionOpen SpaceWater UseAir QualityTrafficMiles of Driving
  • 44.
    Scenario ANew andExisting Development Continuation of Recent Trends
  • 45.
  • 46.
    More auto-orienteddevelopment will occur.Scenario BNew and Existing Development Baseline - implement adopted plans
  • 47.
    Dispersed developmentpattern common in last 20-30 yearsScenario CNew and Existing Development More infill and redevelopment
  • 48.
    Growth onnew land focused into walkable, transit-oriented communitiesScenario DNew and Existing Development Significant increase in densities
  • 49.
    Extensive infilland redevelopment
  • 50.
    Extensive transitsystemLand ConsumptionAnalysis
  • 52.
    Vehicle Miles ofTravel Per Day
  • 53.
  • 54.
  • 55.
  • 56.
    Choosing a Scenario(Weightedvs. Unweighted Results)Unweighted results (as represented by the black dashed line) are nearly identical to weighted results
  • 57.
    QUALITY GROWTH STRATEGYSixGoals, 42 StrategiesEnhance Air QualityIncrease Transportation ChoicesPreserve Critical LandsConserve Water ResourcesProvide Housing OpportunitiesMaximize Efficiency in Public Investments
  • 58.
    Envision Utah Toolbox & Training SessionsTrained over 3000 key stakeholders (realtors, elected officials, planning commissioners, community councils, professional planners, developers and other interested citizens)Urban Planning Tools for Quality Growth
  • 59.
  • 60.
    Quality Growth DemonstrationProjects Requests for Town or Site Specific Community Design Workshop
  • 61.
  • 62.
  • 63.
  • 64.
  • 66.
    Reaching Out toRural Communities
  • 67.
  • 68.
  • 69.
    Growth Strategy Implementedsave$4.5 billion in future infrastructure costs over the next 20 yearsconserve more land (171 square miles)provide more housing choiceslower emissions resulting in less pollutionreduce water consumptionmake our transportation system more efficient with less congestion on the roads
  • 70.
    Mountain View Corridor– a multimodal parallel corridor to I-15An Envision Utah process saved millions of dollars and years of delay
  • 71.
    Utah’s Public TransportationDoyou favor or oppose the EXPANSION of light rail, often referred to as TRAX, and other public transportation systems?TotalFavor 88%TotalOppose10%
  • 72.
    Preparing for FutureTransit$185 million acquisition Purchased 175 miles of rail right-of-way Created nine future transit corridors
  • 73.
    Existing Rail SystemTRAXlight rail – 15-mile Sandy/Salt Lake Line, opened Dec. 1999TRAX light rail – 2.5-mile University Line, opened Dec. 2001TRAX light rail – 1.5-mile Medical Center Line, opened Sept. 2003 TRAX light rail – 1-mile Intermodal Hub Extension, opened April 2008FrontRunner – 44-mile commuter rail line from Ogden to Salt Lake City, opened April 2008
  • 74.
  • 75.
    Building 70 milesof rail in seven years
  • 76.
    One project thatincludes five lines
  • 77.
  • 78.
  • 79.
  • 80.
  • 81.
    Airport TRAXHUD Livableand Sustainable Communities grant supports Utah’s efforts to implement the Wasatch Choice for 2040—our regional vision
  • 82.
    Implementing the WasatchChoice for 2040:Creating a framework for collaboration
  • 83.
    Communicating the RegionalTransportation Plan (RTP)
  • 84.
  • 85.
    Creating tools fordecision-making
  • 86.
  • 87.
    Sharing the knowledge-baseThe framework for collaboration: Partnerships to plan for growth and development
  • 88.
    The RegionalTransportation Plan: Assumes implementation of WC2040Regional approach: WFRC, MAG, MPO, RTP
  • 89.
  • 90.
    Capacity safety andpreservation of existing roadway system
  • 91.
    Comprehensive transit system:Bus Rapid Transit, streetcar and bus to complement rail systemUtah’s First Regional Housing Plan: Completed by the Bureau of Economic and Business Research at the University of UtahMarket driven
  • 92.
    Focus on housingchoiceTools for decision-making: The Envision Tomorrow + Model (ET+)Predictive Growth ModelBuilding and Land Use TypesBuilding Energy Consumption7D Transportation EffectsReturn of InvestmentH + T CostsAir Quality and Climate ImpactsFiscal ImpactPublic HealthEmployment GrowthEmployment ResilienceDevelopment CapitalRedevelopment TimingWater ConsumptionTransportation SafetyWorkforce HousingLEED-ND ApplicationPublic AssetsWorld’s foremost land-use impacts model
  • 93.
    Testing theConcepts: Six demonstration sites where ET+ will be applied in a collaborative process3900 South TRAX Station – South Salt Lake City / Millcreek Township10000 South – Sandy CityMagna Town Center Provo Intermodal HubSalt Lake City Central Station Salt Lake City Streetcar
  • 94.
    Sharing the Knowledge–base: The WC 2040 ToolboxRegional VisioningEnvision Tomorrow +Transportation and HousingPlansDemonstration SitesForm-Based CodeInnovative Financial Tools
  • 95.
  • 96.
  • 97.
  • 99.
    Bringing the Visionto Life:The Envision Utah Experience“The future is not some place we’re going to, but a place we are creating. The paths to it are not found, they are made.” Jane Garvey
  • 100.
    2011 Regional Summit“OurRegion Grows Together through The POWER OF TEN”
  • 101.
  • 102.
  • 103.
    2011 Regional Summit“OurRegion Grows Together through The POWER OF TEN”
  • 104.
    Six Key RegionalIssuesTransportation/TransitLand Use/Quality Growth and Sustainable DevelopmentInfrastructureOpen Space ConservationAir and Water Quantity and QualityEconomic Competitiveness 
  • 105.
    Middle Tennessee RegionalLeaders Panel“Making it Happen through the POWER OF TEN”
  • 106.
    Six Key RegionalIssuesTransportation/TransitLand Use/Quality Growth and Sustainable DevelopmentInfrastructureOpen Space ConservationAir and Water Quantity and QualityEconomic Competitiveness 
  • 107.
  • 108.
    Land Use –Quality Growth and Sustainable DevelopmentMarion FowlkesRick Bernhardt
  • 109.
  • 110.
  • 111.
    Air and WaterQuality and QuantityLarry McElroyBob Martineau
  • 112.
  • 113.
    Michael SkipperExecutive Directorof the Nashville Area Metropolitan Planning Organization
  • 114.
    Development Pattern, 1965-203520352,600,000(In2035, the Nashville region will be about the size of the Denver region today)20001,450,0001965750,000PopulationProperties affected by development
  • 115.
    Resiliency in UrbanCongestion2030 w/ Short-Term Improvements2030 After Long-Term ImprovementsTODAYCongestion in Urban Areas Cannot Be Treated with Roadway Capacity Alone.Daily Recurring Congestion on Major Roadways.
  • 116.
    New Guiding PrinciplesLivability- Work to enhance the quality of life in the region by supporting initiatives that increase opportunities for affordable housing, education, jobs, recreation, and civic involvement without increasing the burden on citizens to enjoy their community.Sustainability – Strive to support growth and prosperity without sacrificing the health, environment, natural and socio-cultural resources, or financial stability of this or future generations.Prosperity – Contribute to the continued economic well-being of the greater Nashville area by investing in transportation solutions that increase access to education, jobs, and amenities, reduce the cost of living and doing business, and attract new investment to the region.Diversity – Recognize the multitude of needs and the variety of perspectives and backgrounds of the people that live and work in the greater Nashville area by promoting a range of transportation choices that are designed with sensitivity to the desired context.
  • 117.
    #1A Bold, NewVision for Mass Transit#2Support for Active Transportation & Walkable Communities#3Preservation & Enhancement of Strategic Roadways
  • 118.
    Ed ColeExecutive Directorof the Transit Alliance of Middle Tennessee
  • 119.
    Marion FowlkesPrincipal ofCentric Architecture and CRT Co-Chair
  • 120.
  • 121.
    Rick BernhardtExecutive Directorof Nashville Metro Planning Department
  • 122.
  • 123.
    Quality Growth Toolbox“Allof the concepts, ideas, strategies, tools, and resources presented in the Toolbox greatly improve our Ten Counties and the Cumberland Region as a whole and guide our imminent growth in a way that insures our continued livability and economic vitality.”
  • 124.
    Quality Growth Toolbox“Successfulimplementation of Quality Growth will require collaboration among all of us as never before. Quality communities and regions don’t just occur by happenstance. Desired community and economic development requires thoughtful approaches.”
  • 125.
  • 126.
    Everett CowanCEO ofAE Guidance and CRT Director
  • 127.
    Infrastructure In 10County RegionConceptual, Planning, Design, or Construction Phase (GNRC)Water/ Waste Water 1.8 B (60% of Total)Other Utilities 435 KTelecommunications 40 MStorm Water 27.5 MSolid Waste 14.7 MRecreation 410 MLaw Enforcement 285 M Total 3.02 Billion
  • 128.
    Infrastructure Report Cardby ASCERecreation D+
  • 129.
  • 130.
  • 131.
  • 132.
  • 133.
  • 134.
  • 135.
    Darwin NewtonRetired StateSoil Scientist with the U.S. Department of Agriculture and CRT Director
  • 136.
    Value of AgricultureEconomy in Robertson County
  • 137.
    Value of AgricultureEconomy in the Region
  • 138.
  • 139.
    Layers30 layers ordata sets of information comprise current Greenprint
  • 140.
    Data from widevariety of sources: USGS, TNGIS, NPS, TWRA, TDOT, ECDUses for the GreenprintAnalyzing Data
  • 141.
  • 142.
  • 143.
  • 144.
    Balancing projects withconservation concernsSumner County Open Space Comprehensive Plan Case Study
  • 145.
    Julian BibbAttorney forStites and Harbison, PLLC and CRT Director
  • 146.
    Nashville’s Open SpacePlanNASHVILLE:NATURALLY
  • 147.
    Four Corners, NineBends and a Heart of GreenNASHVILLE:NATURALLYA VISION FOR DAVIDSON COUNTYFour anchor reserves, one in each quadrant of the county
  • 148.
    Protected land ineach bend of the Cumberland River
  • 149.
    A vibrantly greendowntown22,000 additional acres protected by 2035Four Corners:Minimum 6,000 acres added to the park system
  • 150.
    Minimum 6,000 acresprivately protectedNine Bends:10,000 acres of floodplain and other sensitive area
  • 151.
    1,500 acres ofagricultural land Heart of Green:Add small parks and landscaped gateways
  • 152.
    Turn 110 acresof paved surface to natural or pervious Implementation GoalsNASHVILLE::NATURALLY
  • 153.
    An open spacesystem is essential to the viability of a region that markets itself on its ‘quality of life’ .The Economic ArgumentNASHVILLE:NATURALLY
  • 154.
    Middle TNRegional Natural ResourcesNASHVILLE::NATURALLY
  • 155.
    Larry McElroyGeneral Mangerof Consolidated Utility District of Rutherford County
  • 156.
    Water is ourmost precious natural resource. With only 3 percent of the world’s water existing as fresh water, nearly every continent is feeling the affects of the global water crisis. For some, it’s the lack of clean drinking water. For farmers, it’s the inability to feed the thirst of valuable crops. Just as “easy oil” has dried up, fresh water has become more difficult to access and transport.
  • 157.
  • 158.
  • 159.
  • 160.
  • 161.
  • 163.
    Cumberland River BasinMunicipal and Industrial Water Supply Intakes
  • 164.
    Water Manufacturing Plants?WaterTreatment PlantsWastewater Plants
  • 166.
    Bob MartineauCommissioner ofTennessee Department of Environment and Conservation
  • 167.
    Air Quality: Challengesand PrioritiesBob Martineau, CommissionerTennessee Department of Environment and ConservationPower of 10 Regional Summit Nashville, TennesseeMay 25, 2011
  • 168.
    The Big PictureAiris cleaner in Tennessee than anytime in the last 40 years – since the passage of the Clean Air Act.Grown our economy at the same time air quality has improved.>20% population increase last decade42% increase in VMT 1990-2009EPA plans to make national standards more stringent to protect human health.
  • 171.
    How to AttainStricter EPA Ozone Standard?Reducing combustion emissions from: Power Plants & Industry stationary sourcesIndustrial sites employ low-NOx boilersTVA investments in air pollution control devices and retiring older coal-fired plantsVehicles & Transportation Fuels mobile sources (on-road and off-road)Improved fleet and fuel economyChanges in Vehicle Miles Traveled (VMT)EPA SmartWay Transportation PartnershipAchieving greater energy efficiency
  • 172.
    The Power ofTen Regional Summit 2008 TDEC emissions inventory data

Editor's Notes

  • #104 So what have we been up to with the Toolbox… let’s take a look.
  • #115 Click to access the system, or download the manual from the site as a .PDF file. The manual contains detailed instructions for using the system, and a comprehensive overview of the system’s capabilities.
  • #116 The chief value of the system is the data. The data is collected in different data sets, which can be displayed as individual layers.
  • #117 This presentation has shown a number of individual layers of data featured in the system. But the best use of the Greenprint Tools for Quality Growth is in analyzing data, looking at data sets together, and using the data to set priorities. The goal of this system, like greenprinting in general, is to guide growth management in the context of conservation concerns.
  • #138 TN meets EPA’s current ground level ozone standard across the state.Middle Tennessee Attains The 1997 Ozone NAAQS of 84 ppbIn 2008, EPA announced that the Ozone NAAQS was being made more restrictive to a level of 75 ppb.. In 2010, EPA announced that it was deferring action on the 2008 standard and reconsidering it to be made even more restrictive to between 60 –70 ppb.Depending on the stringency EPA selects, much of Middle TN could be nonattainmentDecision from EPA on the Ground Level Ozone NAAQS expected end of July 2011. Tennessee will recommend attainment/nonattainment boundaries, but it is EPA that makes the final designation.The five county area of Davidson, Rutherford, Williamson, Wilson and Sumner Counties would likely be designated nonattainment. The counties of Cheatham, Dickson and Robertson would be under increased scrutiny to be excused from a federal designation of nonattainment.Will need to look at other counties and justify their exclusion from the recommendation
  • #141 Combustion emissions and evaporative emissions of volatile organic compounds will need further controlTVA is adding air pollution control devices at its newer coal-fired power plants, re-powering to cleaner fuels & technologies such as gas-fired combined cycle turbines and retiring its older plants.Vehicles and the fuels that propel them are being addressed at the federal level. As the fleet turns over with more newer vehicles, air quality should continue to improve.Ultra low sulfur diesel fuelEmission filtration systemsVehicle emissions testingIncreased mass transit options and usageEnergy efficiency: programs will need to be developed to use less fossil fuels – could be transportation or electric power use based programsEnergy efficiency can—Reduce current and future energy demandsIncrease reliability of energy supplyLower household and business costsIncrease industrial competitivenessReduce overall environmental impact
  • #142 2008 data
  • #144 Poor air quality harms human health and the region’s economy. What can the region’s leaders do to improve air quality