Download to read offline
![REPRODUCIBILITY PAPER
This paper aims to reproduce and then replicate:
Hofmann, Katja, Shimon Whiteson, and Maarten De Rijke
"A probabilistic method for inferring preferences from clicks." [¹]
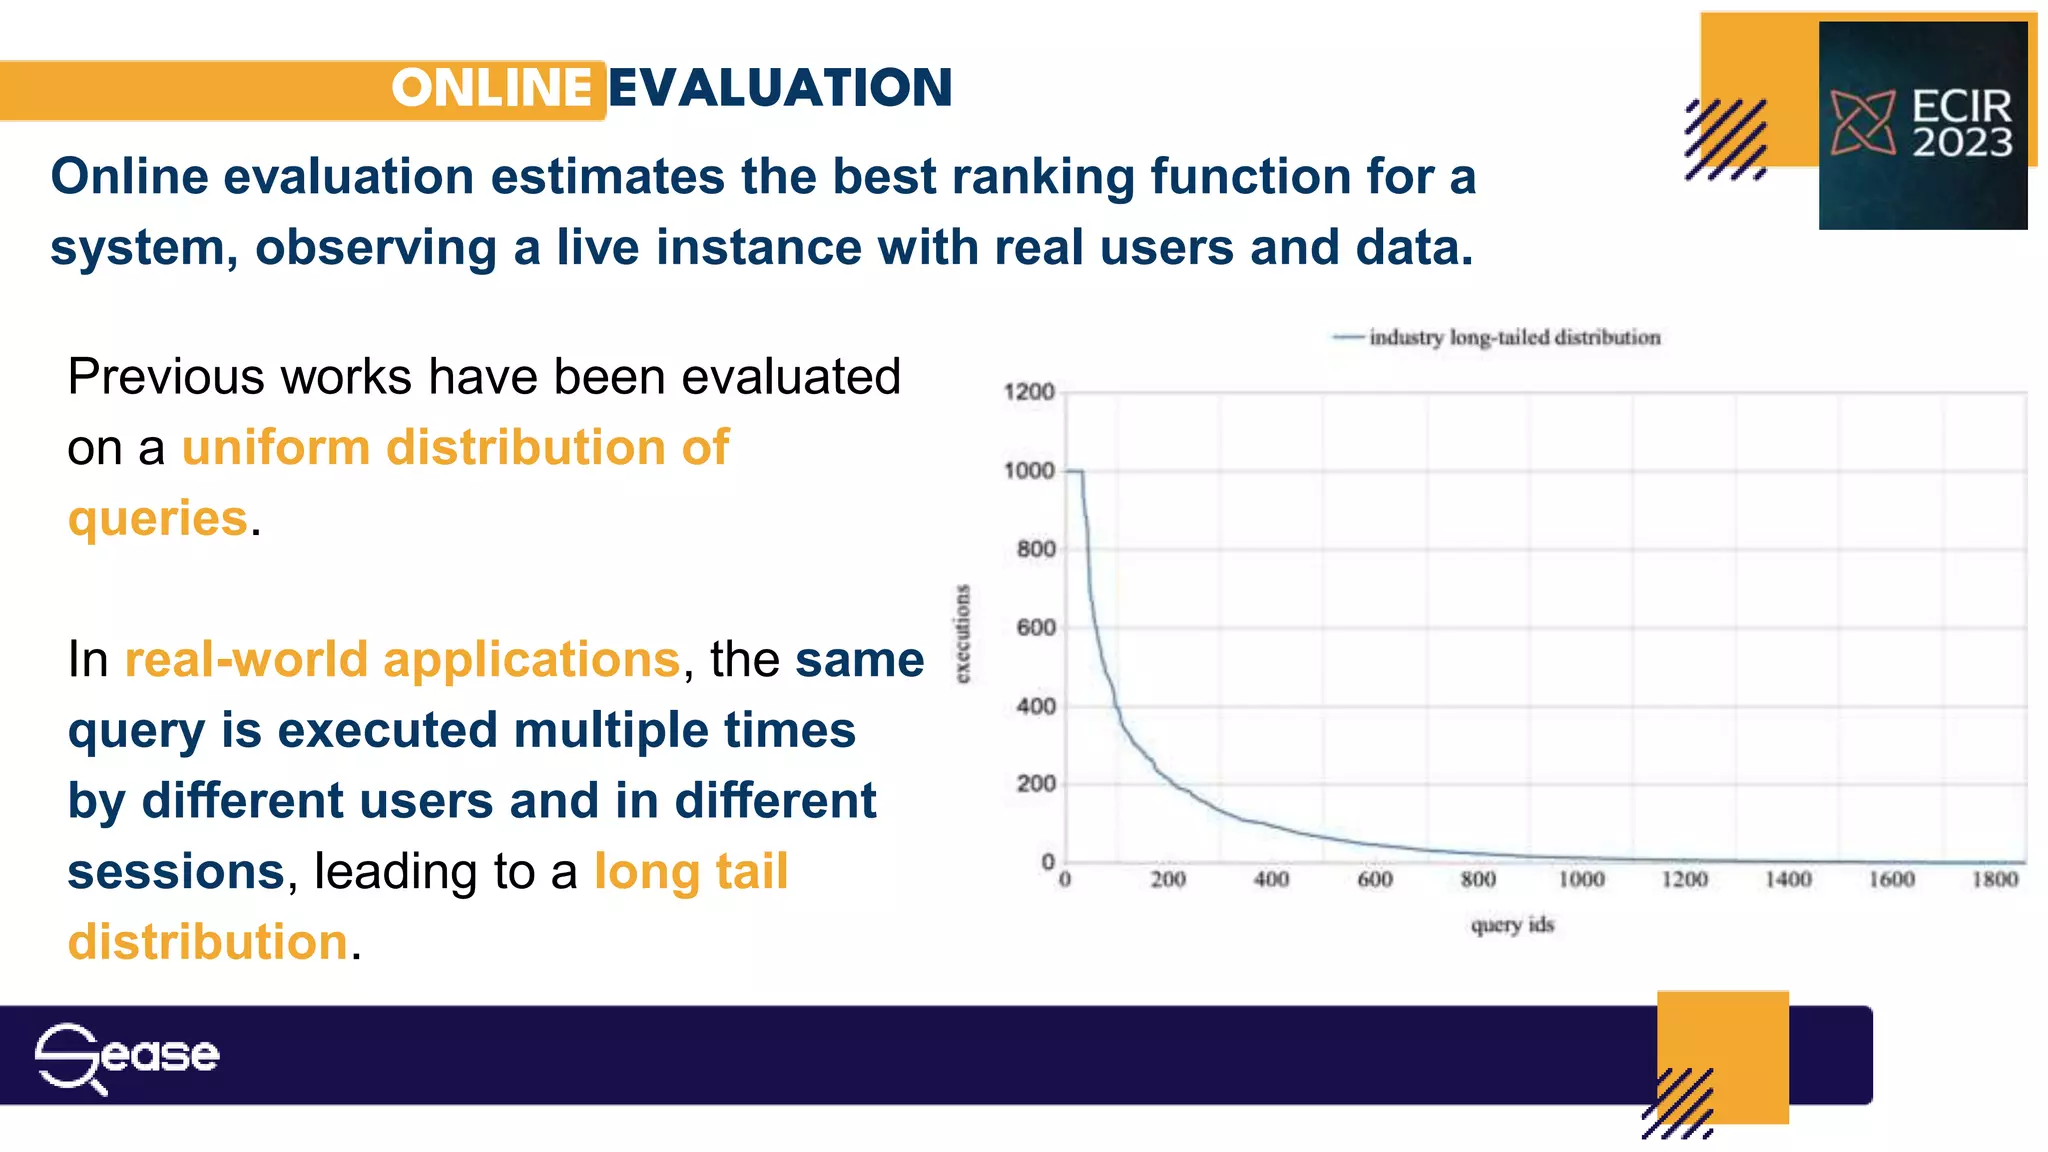
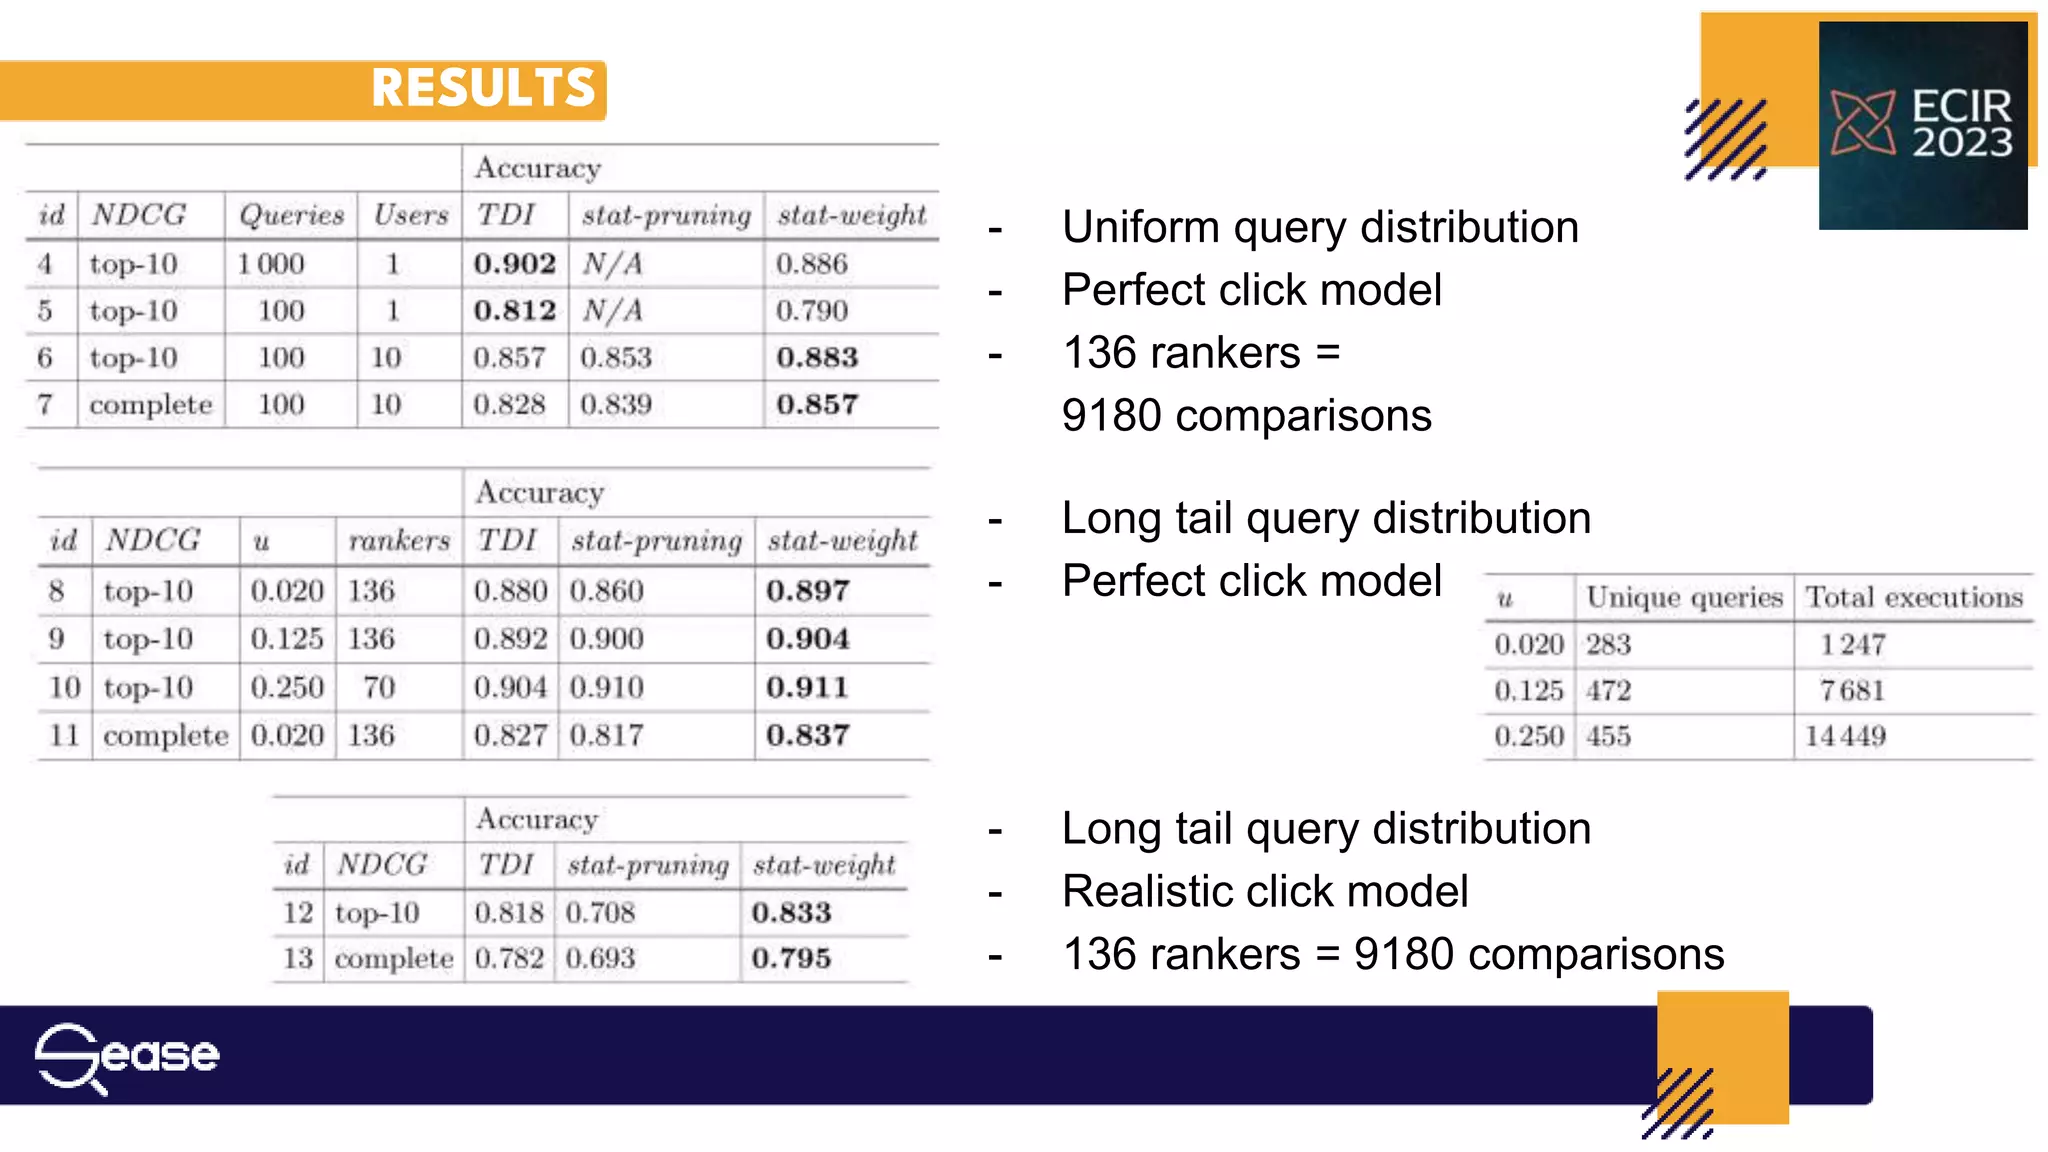
investigating the effect that different query distributions have on the
accuracy of interleaving.
Reason:
It is one of the most prominent surveys on interleaved methods and presents
an experimental setup that felt perfect to evaluate the long-tailed real-world
scenario.
[¹] https://dl.acm.org/doi/abs/10.1145/2063576.2063618](https://image.slidesharecdn.com/ecir2023stat-weightimprovingtheestimatorofinterleavedmethodsoutcomeswithstatisticalhypothesistesting-230503125349-2fa1b772/75/Stat-weight-Improving-the-Estimator-of-Interleaved-Methods-Outcomes-with-Statistical-Hypothesis-Testing-pptx-5-2048.jpg)

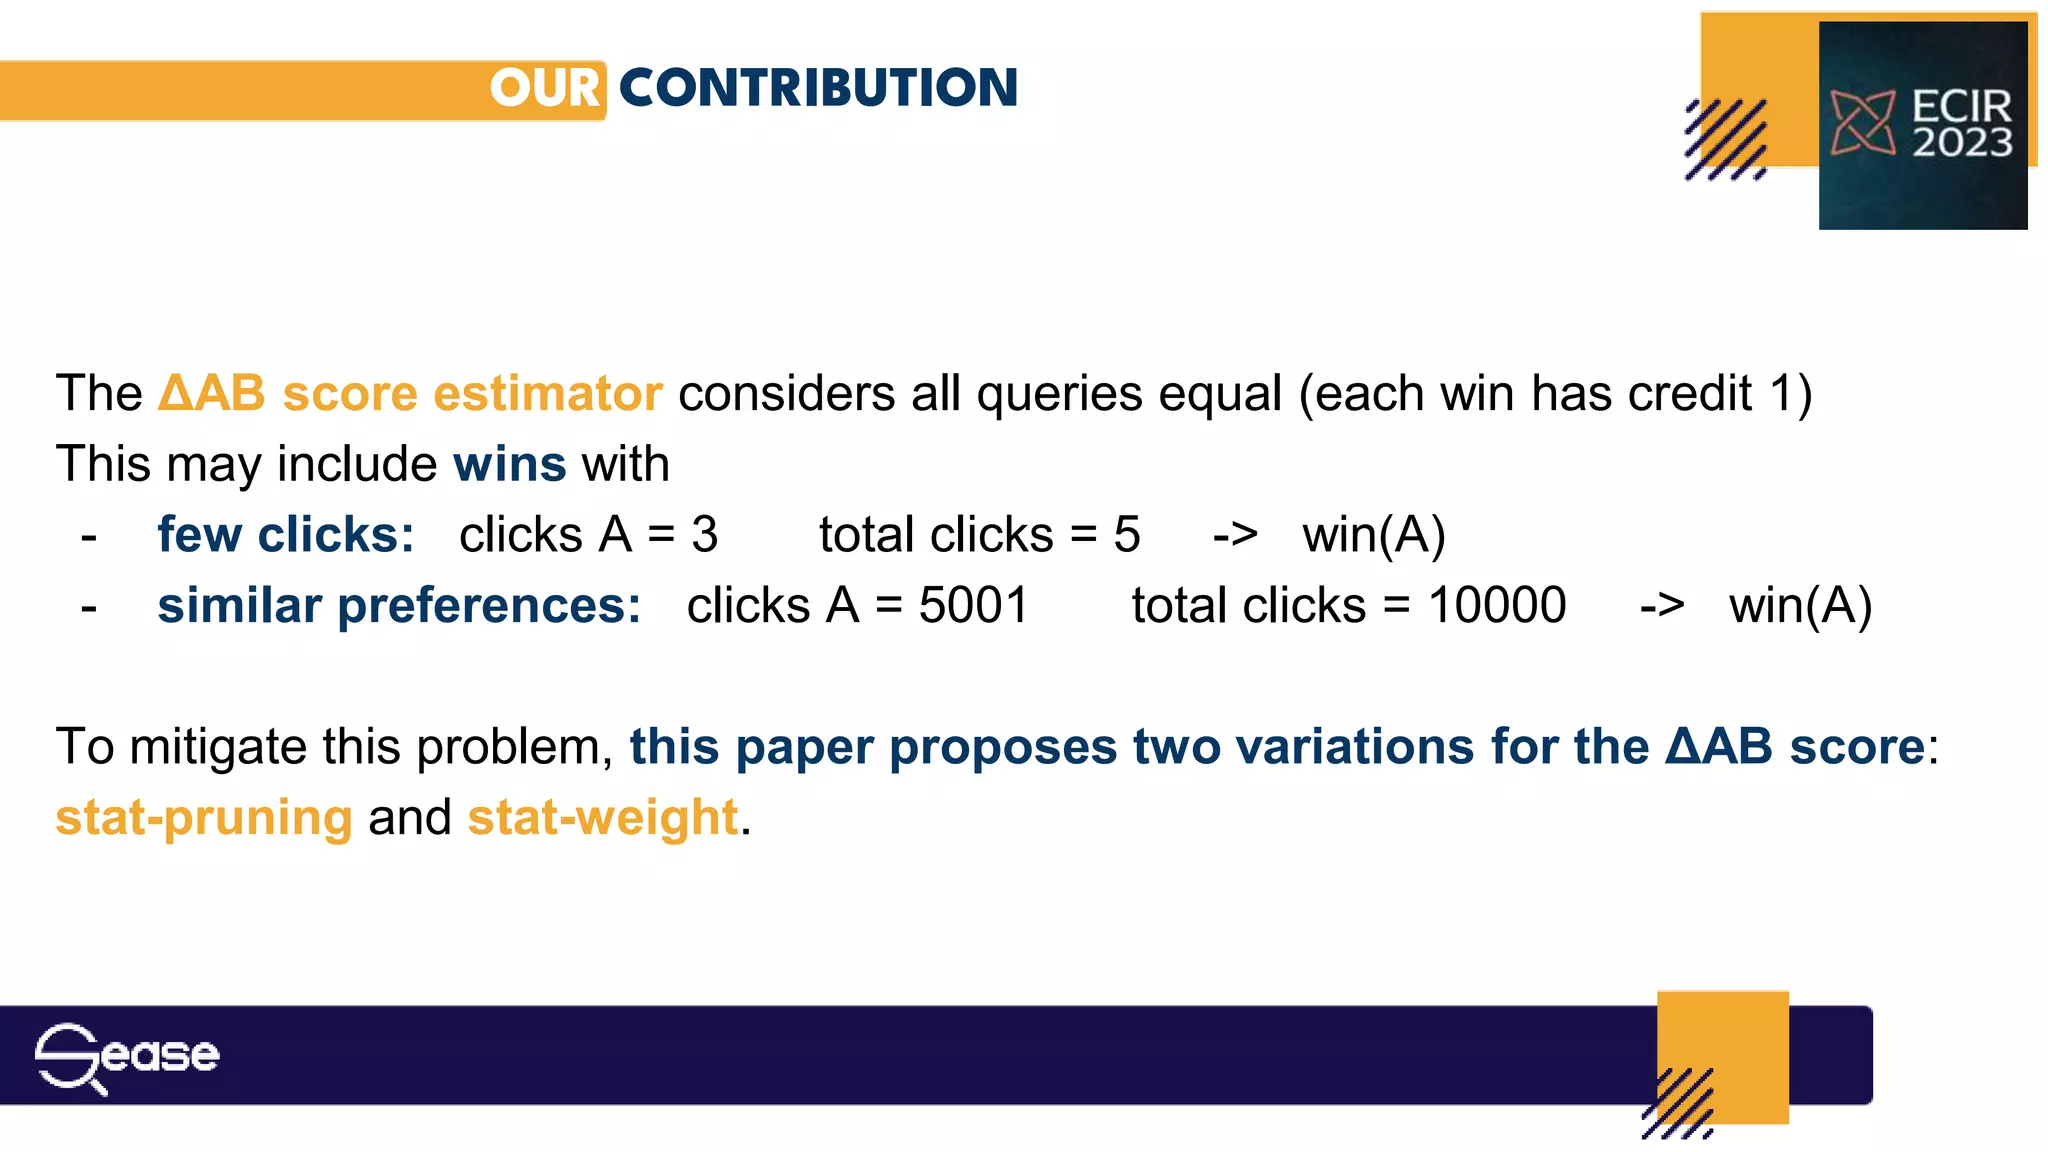
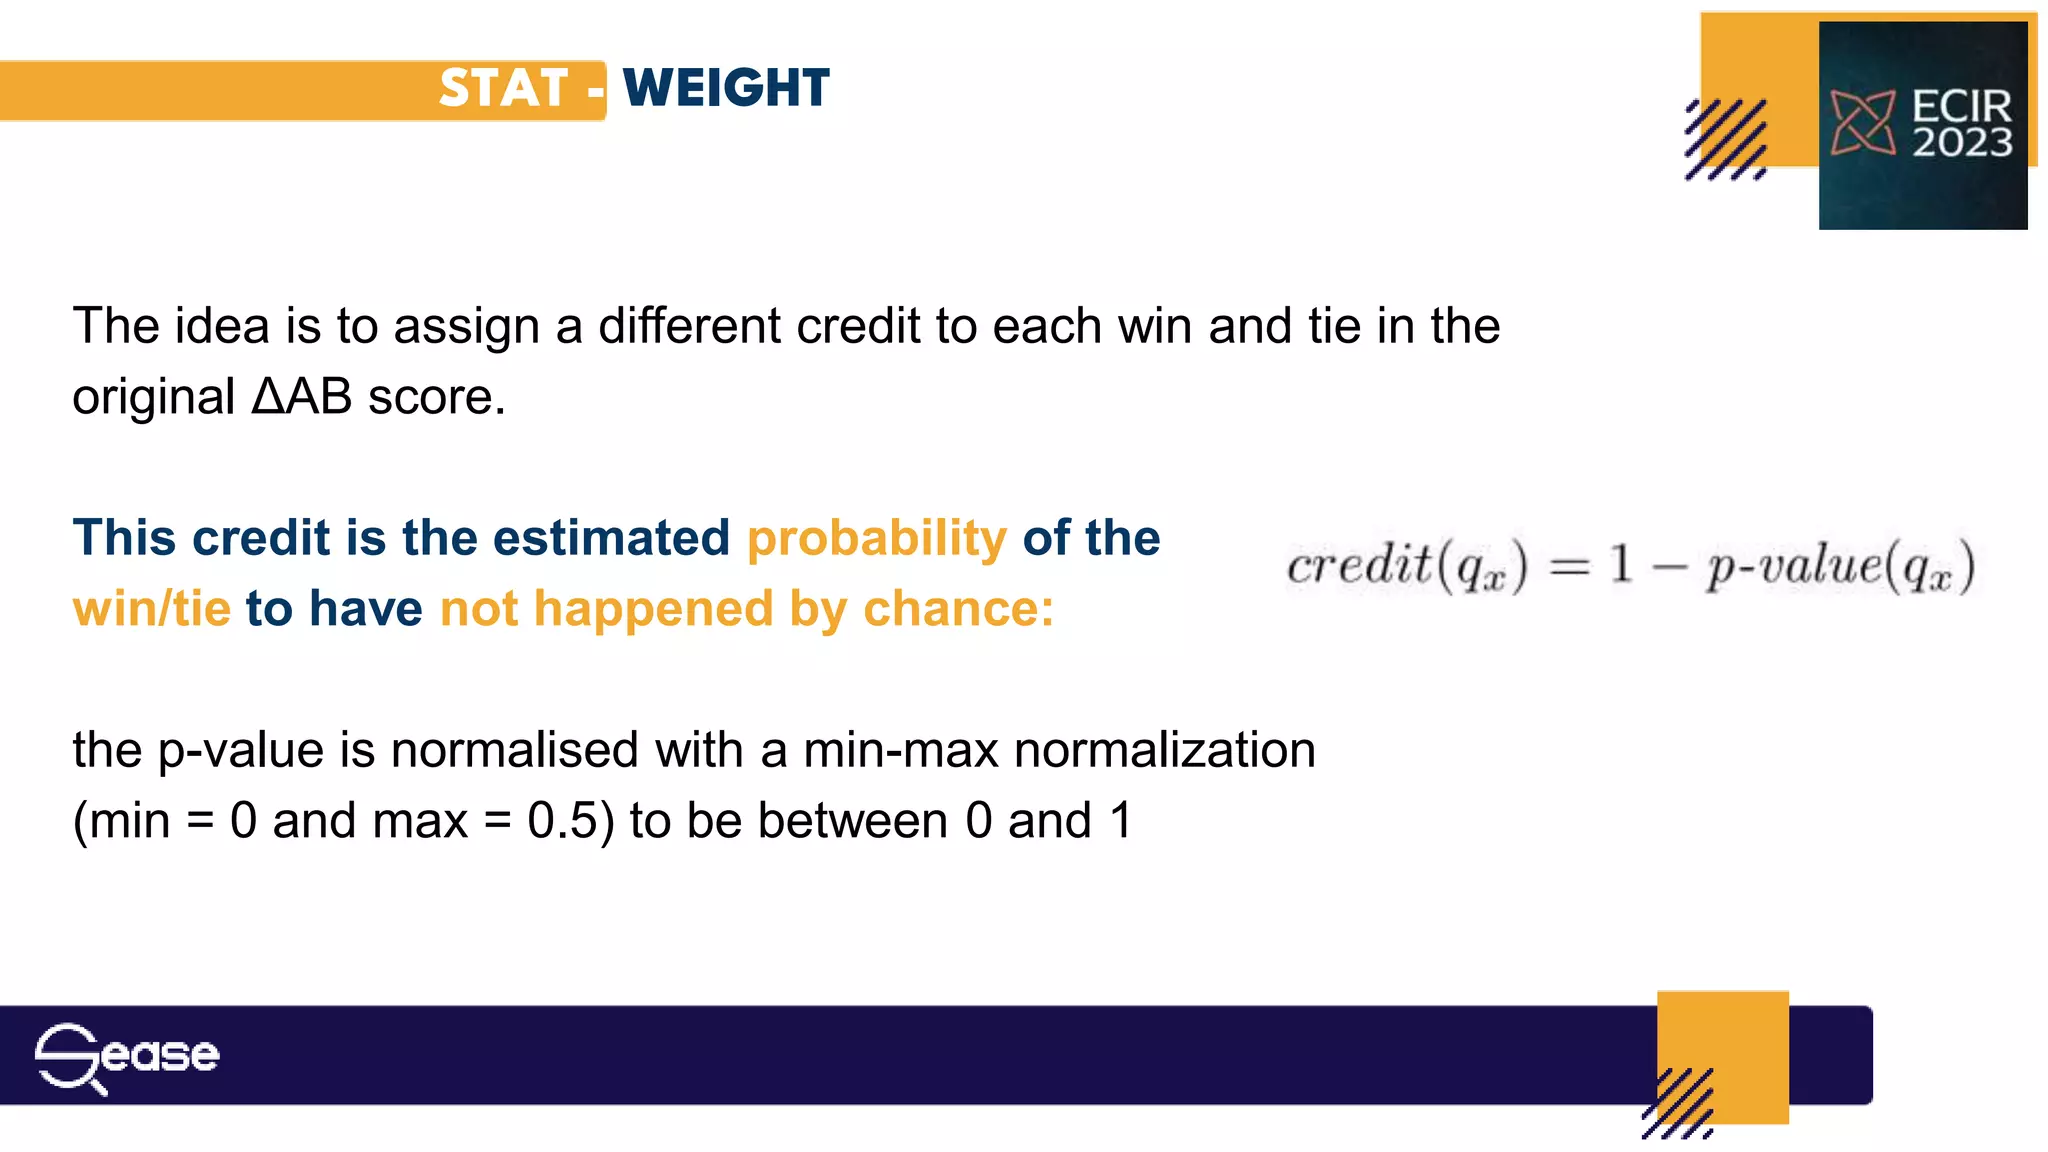
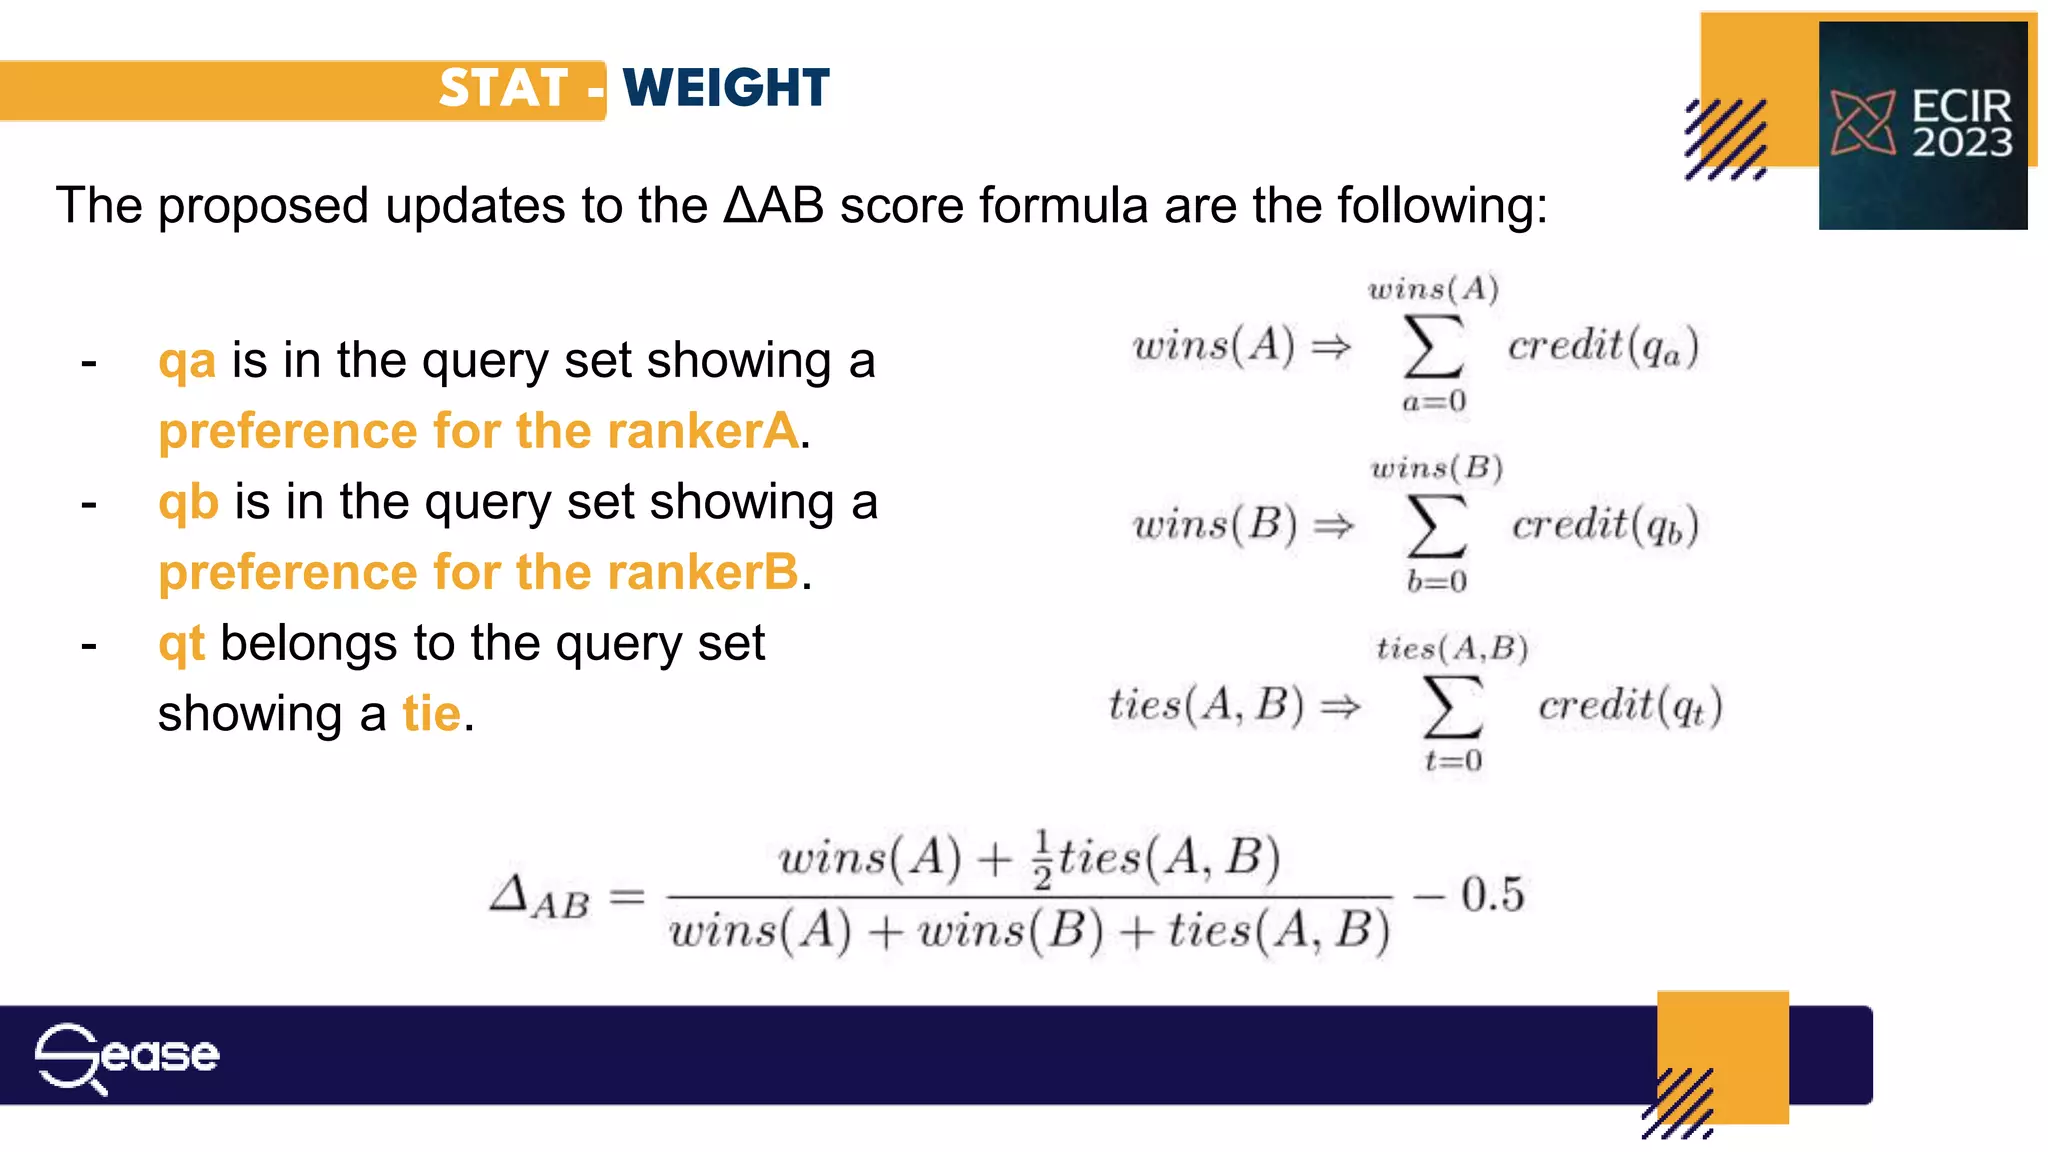
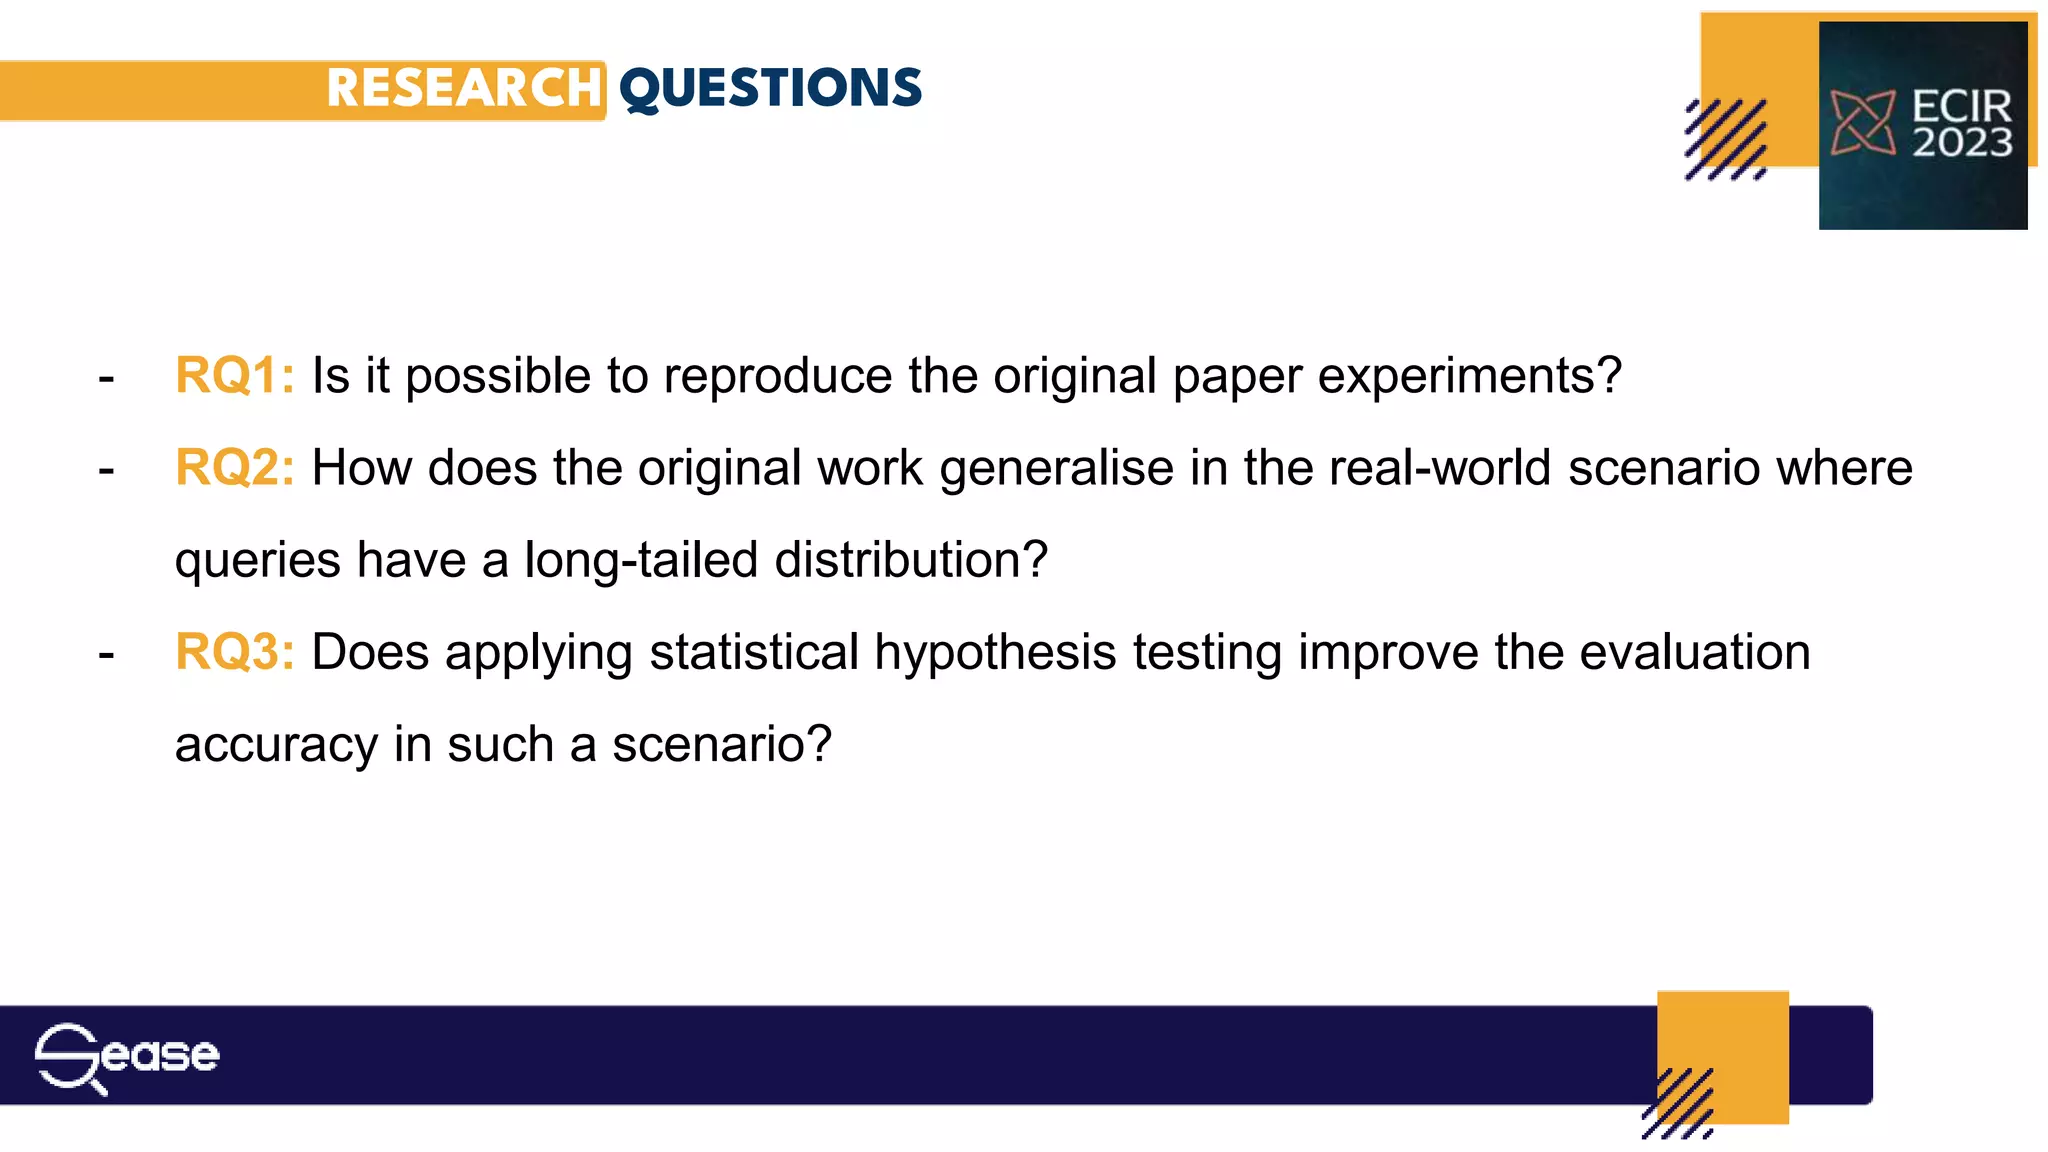
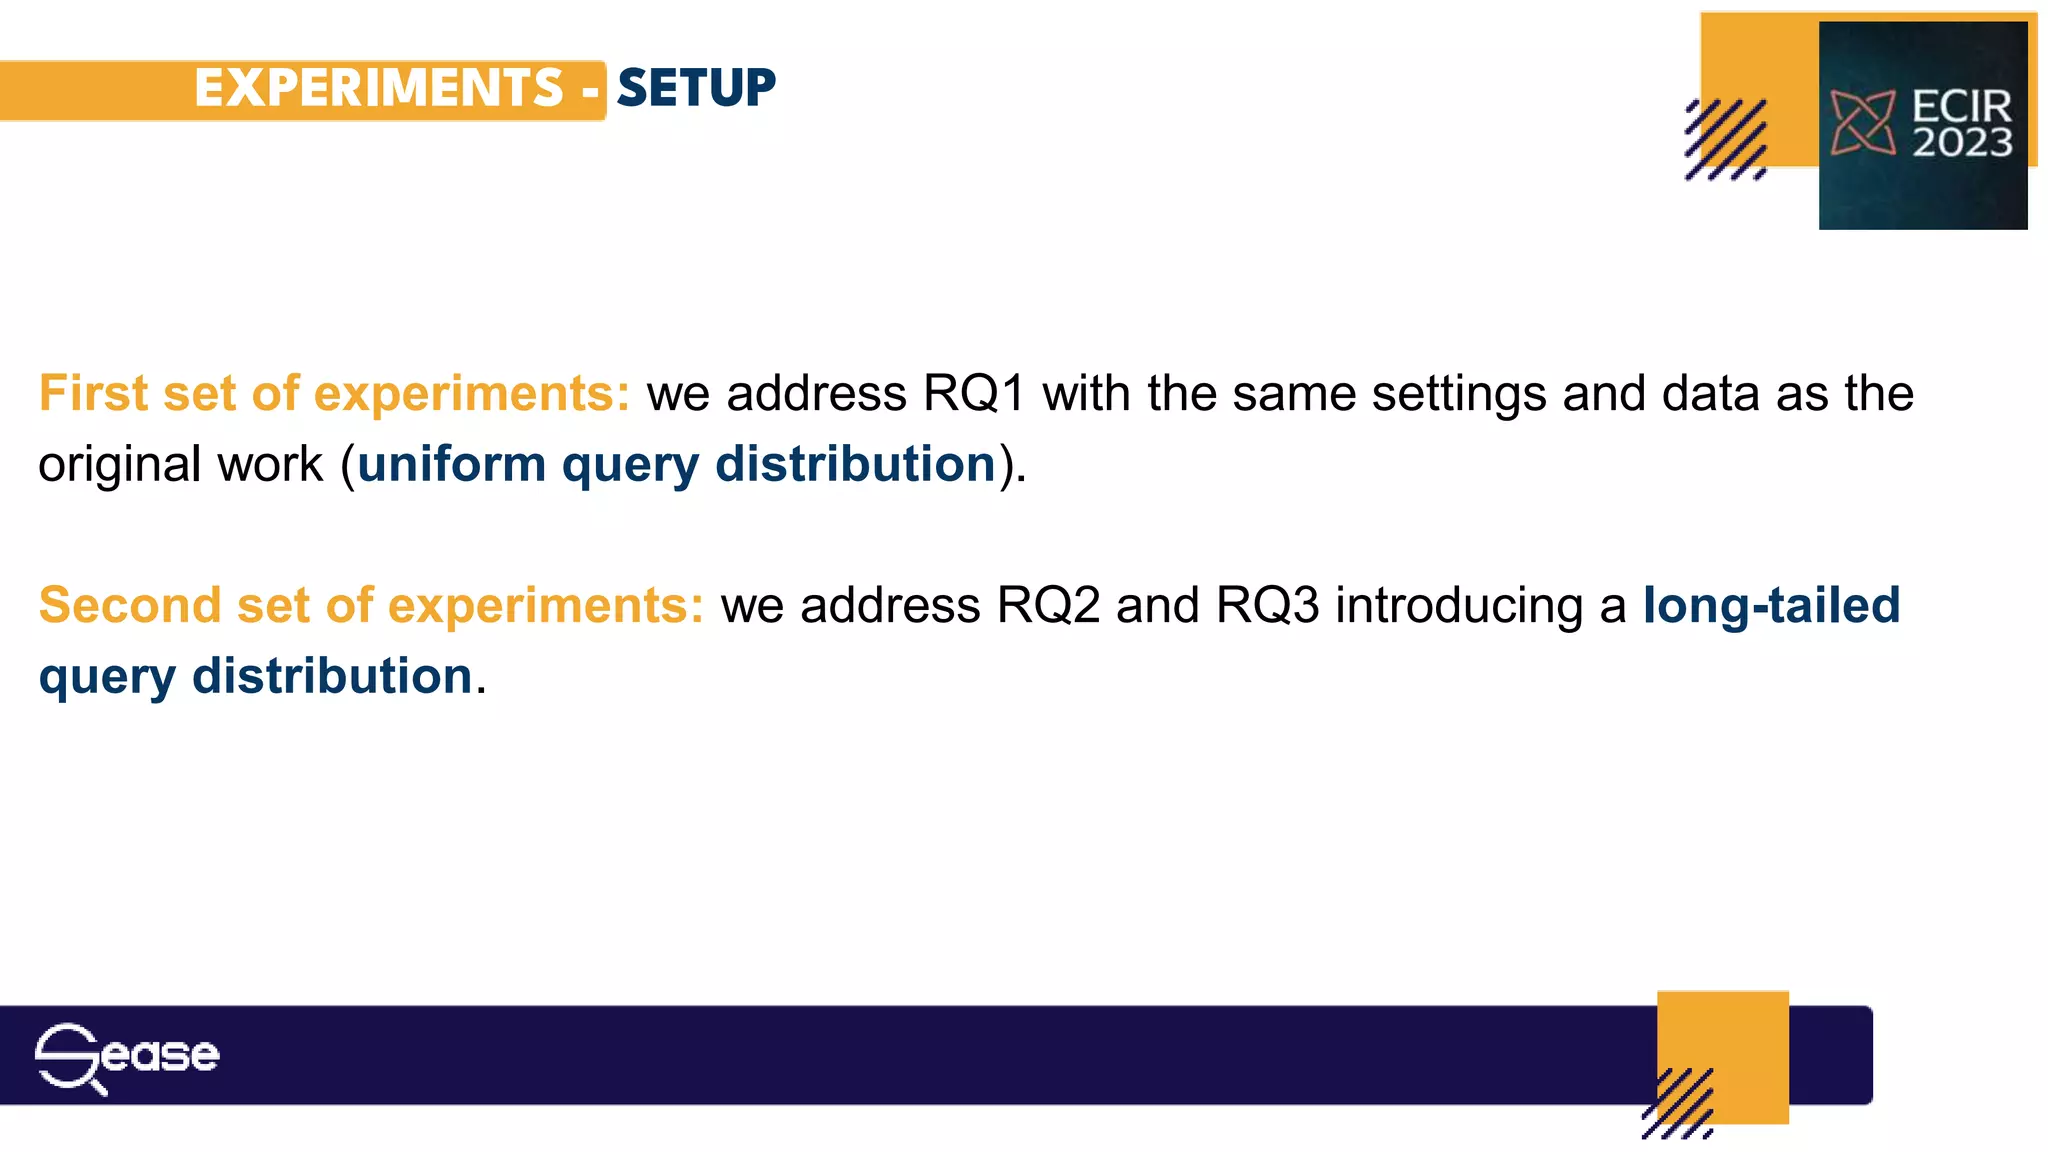


This document discusses the improvement of interleaved methods for estimating ranking function outcomes using statistical hypothesis testing, particularly in scenarios with long-tailed query distributions. The paper reproduces and evaluates previous work on interleaved methods, proposing two variations for the δab score estimator: stat-pruning and stat-weight, to enhance evaluation accuracy. Experiments reveal the limitations and benefits of these methods across differing query distributions, highlighting challenges in reproducing original findings due to incomplete information.


![Vibe Coding vs. Spec-Driven Development [Free Meetup]](https://cdn.slidesharecdn.com/ss_thumbnails/vibecodingvsspecdrivendevelopment-251209105622-43f455e7-thumbnail.jpg?width=640&height=640&fit=bounds)

