Downloaded 21 times


![μA(X)=avgu in AX(u)
μB(X)=avgu in BX(u)
Overall Evaluation Criterion
(OEC) for the group B
Overall Evaluation Criterion
(OEC) for the group A
Calculate the OEC for each
group as the mean value
Δ(x) VS 0
Δ(X) = μB(X) – μA(X)
the evaluated update is
positive or negative
Statistical
significance test
the difference is caused
by a noise or
the treatment effect
(e.g., Student’s t-test)
Overall Evaluation
Criterion (OEC)
[Kohavi et al., DMKD’2009]
Overall Acceptance
Criterion (OAC)
[Drutsa et al., CIKM’2015]](https://image.slidesharecdn.com/sigirindustrytalk2017-170914144233/85/Machine-Learning-Powered-A-B-Testing-4-320.jpg)


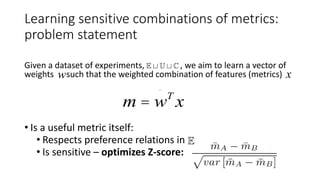
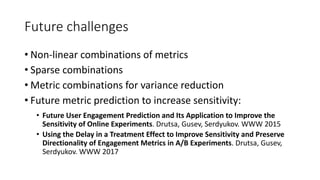
![Learning sensitive combinations of metrics:
definitions
• Dataset of A/B tests (to be split into train and test sets):
• - experiments with known true preference direction (A > B/B > A) [very few]
• Regular experiments with high confidence outcome w.r.t. ground-truth metric
• Degradation experiments
• - experiments with unknown preference (not statistically significant) [numerous],
• - A/A experiments [numerous]
• Each observation unit (e.g., a user) is represented by a feature vector
• A feature can be an A/B test metric itself (e.g, mean session time), or…
• Some possibly useful characteristic of a user
xx
x Î Ân](https://image.slidesharecdn.com/sigirindustrytalk2017-170914144233/85/Machine-Learning-Powered-A-B-Testing-9-320.jpg)


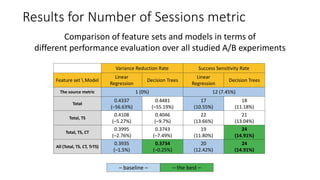

The document discusses using machine learning techniques to improve the sensitivity of A/B testing. It describes how A/B testing works by splitting users randomly into groups A and B that are exposed to different variants of a service. Key measures are calculated for each user and the groups are compared to determine if one variant is better. The document then discusses challenges with detecting small effects with limited user traffic. It proposes learning sensitive combinations of existing A/B testing metrics and predicting metrics to reduce variance as ways to improve sensitivity and the ability to detect smaller effects. Results show these machine learning approaches can increase sensitivity by detecting effects with less user data compared to traditional metrics.