StatMine (New Technologies and Techniques for Statistics)
•Download as PPTX, PDF•
1 like•660 views

This document describes StatMine, a prototype for improving how users interact with and understand data from Statistics Netherlands (SN). StatMine aims to address two key problems: 1) figures alone do not provide meaningful information, and 2) information is fragmented across different statistics. The prototype allows users to visualize data in charts and combine figures from multiple tables to gain insights. An initial test of StatMine 0.2 with SN employees and policymakers provided positive feedback and suggestions for further improving how uncertainty in data is represented.

More Related Content
What's hot
What's hot (8)
Viewers also liked
Viewers also liked (20)
Similar to StatMine (New Technologies and Techniques for Statistics)
Similar to StatMine (New Technologies and Techniques for Statistics) (20)
More from Edwin de Jonge
More from Edwin de Jonge (13)
Recently uploaded
Recently uploaded (20)
StatMine (New Technologies and Techniques for Statistics)
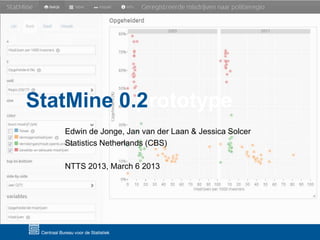
- 1. StatMine – prototype 0.2 Edwin de Jonge, Jan van der Laan & Jessica Solcer Statistics Netherlands (CBS) NTTS 2013, March 6 2013
- 2. StatMine Goal: Improve use figures Statistics Netherlands How: Add Analysis layer to OutputDB (StatLine) Working approach: • • • • Formulate improvement Develop software prototype Test prototype on (real) users Evaluate But why? StatMine 2
- 3. Mission SN “The mission of Statistics Netherlands is to publish reliable and coherent statistical information that meets the needs of society” (source: www.cbs.nl) StatMine 0.2 3
- 4. Mission SN “The mission of Statistics Netherlands is to publish reliable and coherent statistical information that meets the needs of society” (source: www.cbs.nl) StatMine 0.2 4
- 6. What is the state of the Netherlands? StatLine contains over 1.000.000.000 figures! StatMine 6
- 7. Problem 1 Figures ≠ Information StatMine 7
- 8. 1. Figures ≠ Information We know (from user study): • Some important user don’t get the most out of StatLine: • Data journalists • Policy makers • They don’t find and see interesting information, because of tabular presention (data = table) StatMine 0.2 8
- 11. 2. Fragmented information For policy makers and journalist most information in OutputDB is fragmented: • Users need to combine fragments from different statistics • Diabetes (insuline usage, hospital admissions, mortality, visits to doctor, obesity) • Energy consumption vs economic growth • Income vs economic growth • (Perceived) public safety vs registered crimes StatMine 0.2 11
- 12. 2. Solution: Let users combine tables (even if we wouldn’t …) StatMine 12
- 13. Prototype StatMine 0.2 Implements: • Visual interactive data browsing • Combining fragments of different tables Tested on: • 40 SN employees (++) • 40 policy makers (++) StatMine 0.2 13
- 14. Line chart Bar chart - Show development - Compare Bubble/scatter chart Mosaic chart - Show correlation - Show structure StatMine 0.2 14
- 16. StatMine 16
- 17. Technical HTML5 JSON R JavaScript CSS SVG • Runs on desktop • makkelijk over te zetten naar webserver StatMine 0.2 17
- 18. Currently (2013) • All Official Statistics have confidence interval. • StatMine 0.3 will test if showing uncertainty improves/changes understanding of (quality of) figures. • May lead to publishing interval estimates (in stead of point estimates). StatMine 18
- 19. Conclusion • Visual data browsing is promising for • Our own statisticians (quality control) • External policy makers and journalists • Using real end users for testing is very helpful: • Lots of suggestions for improvement from users • Users feel involved in innovation process of NSI StatMine 19