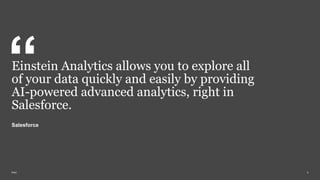
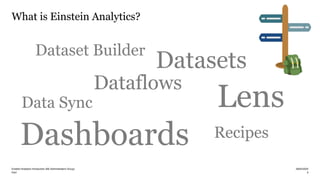
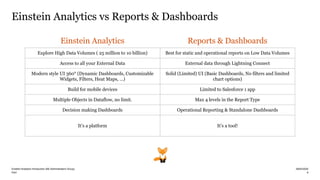
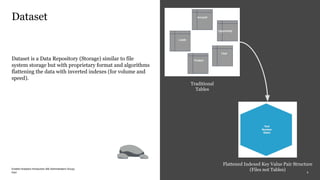
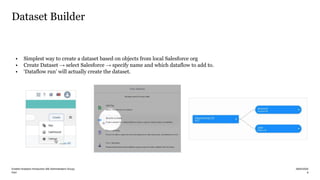
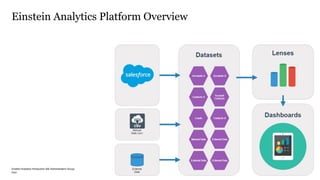
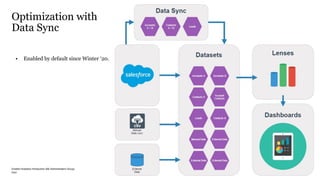
Presentation by Steven Hugo
April 2020
Introduction to Einstein
Analytics
Steven Hugo
Salesforce Lead Developer
www.stevenhugo.be
PwC
Einstein Analytics allows you to explore all
of your data quickly and easily by providing
AI-powered advanced analytics, right in
Salesforce.
Salesforce
3
PwC
Einstein Analytics Introduction (BE Administrators Group) 28/04/2020
• What is Einstein Analytics?
• Einstein Analytics vs Reports & Dashboards
• Einstein Analytics Platform Overview
• Optimization with Data Sync
• Demo
• Einstein Analytics vs Reports & Dashboards
• What’s next?
Agenda
4
PwC
Einstein Analytics Introduction (BE Administrators Group) 28/04/2020
What is Einstein Analytics?
5
Datasets
Dataset Builder
Dataflows
Recipes
Lens
Dashboards
Data Sync
PwC
Einstein Analytics Introduction (BE Administrators Group) 28/04/2020
Einstein Analytics vs Reports & Dashboards
6
Explore High Data Volumes ( 25 million to 10 billion) Best for static and operational reports on Low Data Volumes
Access to all your External Data External data through Lightning Connect
Modern style UI 360° (Dynamic Dashboards, Customizable
Widgets, Filters, Heat Maps, …)
Solid (Limited) UI (Basic Dashboards, No filters and limited
chart options)
Build for mobile devices Limited to Salesforce 1 app
Multiple Objects in Dataflow, no limit. Max 4 levels in the Report Type
Decision making Dashboards Operational Reporting & Standalone Dashboards
It’s a platform It’s a tool!
Einstein Analytics Reports & Dashboards
PwC
Einstein Analytics Introduction (BE Administrators Group) 28/04/2020
What is Einstein Analytics?
7
Datasets
Dataset Builder
Dataflows
Recipes
Lens
Dashboards
Data Sync
PwC
Einstein Analytics Introduction (BE Administrators Group) 28/04/2020
Dataset is a Data Repository (Storage) similar to file
system storage but with proprietary format and algorithms
flattening the data with inverted indexes (for volume and
speed).
Dataset
8
Traditional
Tables
Flattened Indexed Key Value Pair Structure
(Files not Tables)
PwC
Einstein Analytics Introduction (BE Administrators Group) 28/04/2020
Dataset Builder
• Simplest way to create a dataset based on objects from local Salesforce org
• Create Dataset → select Salesforce → specify name and which dataflow to add to.
• ‘Dataflow run’ will actually create the dataset.
9
PwC
Einstein Analytics Introduction (BE Administrators Group) 28/04/2020
A dataflow is a process using instructions for creating a
dataset plus some transformations as the data is being read
and moved around
● When you build a dataset using the dataset builder the
instructions get automatically added to the dataflow in a
format describing the objects, fields and transformations.
● When the dataflow runs, the data engine executes the
instructions in the file and creates the final results as a
dataset.
● Dataflows run based on either a scheduled time or
manually (Run Now).
● Dataflow files can be downloaded, backed-up, edited, or
uploaded.
Dataflow
10
PwC
Einstein Analytics Introduction (BE Administrators Group) 28/04/2020
Recipes (the friendly Data Analyst UI)
• Recipes are used to prepare & clean data and/or combine multiple datasets into one.
• Recipes always start with a dataset or more, and result in a new dataset.
11
PwC
Einstein Analytics Introduction (BE Administrators Group) 28/04/2020
A lens is a view into a dataset used to get insight to a
specific business question. The lens can be saved and
shared independently. It can also be clipped to a
dashboard.
• Chart mode
• Table mode (Values, Compare & Pivot)
• SAQL Mode (Write your own queries)
• Edit Data fields
Lens & Explorer
12
PwC
Einstein Analytics Introduction (BE Administrators Group) 28/04/2020
A dashboard is a set of charts, metrics, and tables based on
the data in one or more lenses.
• Pages
• Interactive Widgets
• Global Filters
• Unique Dashboard layouts for all your devices
• ...
Dashboard
13
PwC
Einstein Analytics Introduction (BE Administrators Group) 28/04/2020
Einstein Analytics Platform Overview
14
PwC
Einstein Analytics Introduction (BE Administrators Group) 28/04/2020
Optimization with
Data Sync
• Enabled by default since Winter ‘20.
15
PwC
Einstein Analytics Introduction (BE Administrators Group) 28/04/2020
Einstein Analytics Connectors
16
Demo
d
PwC
Einstein Analytics Introduction (BE Administrators Group) 28/04/2020
Einstein Analytics vs Reports & Dashboards
18
Explore High Data Volumes ( 25 million to 10 billion) Best for static and operational reports on Low Data Volumes
Access to all your External Data External data through Lightning Connect
Modern style UI 360° (Dynamic Dashboards, Customizable
Widgets, Filters, Heat Maps, …)
Solid (Limited) UI (Basic Dashboards, No filters and limited
chart options)
Build for mobile devices Limited to Salesforce 1 app
Multiple Objects in Dataflow, no limit. Max 4 levels in the Report Type
Decision making Dashboards Operational Reporting & Standalone Dashboards
It’s a platform It’s a tool!
Einstein Analytics Reports & Dashboards
PwC
Einstein Analytics Introduction (BE Administrators Group) 28/04/2020
• Einstein Analytics Learning Map
• Einstein Analytics Plus Training
• Learn Einstein Analytics Plus Trailmix
• Build Interactive Einstein Analytics Dashboards Video
Series
• Einstein Analytics Apps Basics
• Gain Insight with Einstein Discovery
What’s next?
19
www.pwc.be
Thank you

Introduction to einstein analytics

  • 1.
    Presentation by StevenHugo April 2020 Introduction to Einstein Analytics
  • 2.
    Steven Hugo Salesforce LeadDeveloper www.stevenhugo.be
  • 3.
    PwC Einstein Analytics allowsyou to explore all of your data quickly and easily by providing AI-powered advanced analytics, right in Salesforce. Salesforce 3
  • 4.
    PwC Einstein Analytics Introduction(BE Administrators Group) 28/04/2020 • What is Einstein Analytics? • Einstein Analytics vs Reports & Dashboards • Einstein Analytics Platform Overview • Optimization with Data Sync • Demo • Einstein Analytics vs Reports & Dashboards • What’s next? Agenda 4
  • 5.
    PwC Einstein Analytics Introduction(BE Administrators Group) 28/04/2020 What is Einstein Analytics? 5 Datasets Dataset Builder Dataflows Recipes Lens Dashboards Data Sync
  • 6.
    PwC Einstein Analytics Introduction(BE Administrators Group) 28/04/2020 Einstein Analytics vs Reports & Dashboards 6 Explore High Data Volumes ( 25 million to 10 billion) Best for static and operational reports on Low Data Volumes Access to all your External Data External data through Lightning Connect Modern style UI 360° (Dynamic Dashboards, Customizable Widgets, Filters, Heat Maps, …) Solid (Limited) UI (Basic Dashboards, No filters and limited chart options) Build for mobile devices Limited to Salesforce 1 app Multiple Objects in Dataflow, no limit. Max 4 levels in the Report Type Decision making Dashboards Operational Reporting & Standalone Dashboards It’s a platform It’s a tool! Einstein Analytics Reports & Dashboards
  • 7.
    PwC Einstein Analytics Introduction(BE Administrators Group) 28/04/2020 What is Einstein Analytics? 7 Datasets Dataset Builder Dataflows Recipes Lens Dashboards Data Sync
  • 8.
    PwC Einstein Analytics Introduction(BE Administrators Group) 28/04/2020 Dataset is a Data Repository (Storage) similar to file system storage but with proprietary format and algorithms flattening the data with inverted indexes (for volume and speed). Dataset 8 Traditional Tables Flattened Indexed Key Value Pair Structure (Files not Tables)
  • 9.
    PwC Einstein Analytics Introduction(BE Administrators Group) 28/04/2020 Dataset Builder • Simplest way to create a dataset based on objects from local Salesforce org • Create Dataset → select Salesforce → specify name and which dataflow to add to. • ‘Dataflow run’ will actually create the dataset. 9
  • 10.
    PwC Einstein Analytics Introduction(BE Administrators Group) 28/04/2020 A dataflow is a process using instructions for creating a dataset plus some transformations as the data is being read and moved around ● When you build a dataset using the dataset builder the instructions get automatically added to the dataflow in a format describing the objects, fields and transformations. ● When the dataflow runs, the data engine executes the instructions in the file and creates the final results as a dataset. ● Dataflows run based on either a scheduled time or manually (Run Now). ● Dataflow files can be downloaded, backed-up, edited, or uploaded. Dataflow 10
  • 11.
    PwC Einstein Analytics Introduction(BE Administrators Group) 28/04/2020 Recipes (the friendly Data Analyst UI) • Recipes are used to prepare & clean data and/or combine multiple datasets into one. • Recipes always start with a dataset or more, and result in a new dataset. 11
  • 12.
    PwC Einstein Analytics Introduction(BE Administrators Group) 28/04/2020 A lens is a view into a dataset used to get insight to a specific business question. The lens can be saved and shared independently. It can also be clipped to a dashboard. • Chart mode • Table mode (Values, Compare & Pivot) • SAQL Mode (Write your own queries) • Edit Data fields Lens & Explorer 12
  • 13.
    PwC Einstein Analytics Introduction(BE Administrators Group) 28/04/2020 A dashboard is a set of charts, metrics, and tables based on the data in one or more lenses. • Pages • Interactive Widgets • Global Filters • Unique Dashboard layouts for all your devices • ... Dashboard 13
  • 14.
    PwC Einstein Analytics Introduction(BE Administrators Group) 28/04/2020 Einstein Analytics Platform Overview 14
  • 15.
    PwC Einstein Analytics Introduction(BE Administrators Group) 28/04/2020 Optimization with Data Sync • Enabled by default since Winter ‘20. 15
  • 16.
    PwC Einstein Analytics Introduction(BE Administrators Group) 28/04/2020 Einstein Analytics Connectors 16
  • 17.
  • 18.
    PwC Einstein Analytics Introduction(BE Administrators Group) 28/04/2020 Einstein Analytics vs Reports & Dashboards 18 Explore High Data Volumes ( 25 million to 10 billion) Best for static and operational reports on Low Data Volumes Access to all your External Data External data through Lightning Connect Modern style UI 360° (Dynamic Dashboards, Customizable Widgets, Filters, Heat Maps, …) Solid (Limited) UI (Basic Dashboards, No filters and limited chart options) Build for mobile devices Limited to Salesforce 1 app Multiple Objects in Dataflow, no limit. Max 4 levels in the Report Type Decision making Dashboards Operational Reporting & Standalone Dashboards It’s a platform It’s a tool! Einstein Analytics Reports & Dashboards
  • 19.
    PwC Einstein Analytics Introduction(BE Administrators Group) 28/04/2020 • Einstein Analytics Learning Map • Einstein Analytics Plus Training • Learn Einstein Analytics Plus Trailmix • Build Interactive Einstein Analytics Dashboards Video Series • Einstein Analytics Apps Basics • Gain Insight with Einstein Discovery What’s next? 19
  • 20.