SlideShare a Scribd company logo
1 of 21
StatMine, – prototype
StatMine
an exploration of dissemination data

Edwin de Jonge
Statistics Netherlands
25 September 2012, Seoul
an exploration of dissemination data: StatMine

2
an exploration of dissemination data: StatMine

3
StatMine, from numbers to analysis

4
Why StatMine?
• Statistics Netherlands (SN) mission produce
relevant information for:
•
•
•
•
•
•
•

Policy makers
Journalists
Citizens
Enterprises
Economists
Social scientists
Etc.

an exploration of dissemination data: StatMine

5
Numbers ≠ Information
StatLine is SN’s online DB (over 1 billion figures)
We know from a user study that:
1. Many interesting patterns in StatLine are not
spotted by users
2. Many important topics in StatLine are scattered
across multiple tables

an exploration of dissemination data: StatMine

6
Example of problem 2
• Policymaker interested in patients with diabetes:
•
•
•
•
•

Visits to medical doctor
Hospital admissions
Mortality
Medication consumption (insuline)
Obesity

Are all different statistical products (from different
sources)!

an exploration of dissemination data: StatMine

7
Data analysis = Data insight
Goal research project StatMine is to provide data
insight by:
• (I) Using data visualisation
• (II) Combining data table fragments
• (III) Deriving variables

All hypotheses (will be) tested with a prototype with
internal and external users.
(I), tested and succesful
(II, III,… ) is work in progress
an exploration of dissemination data: StatMine

8
Chart types
Bar chart
Line chart
Mosaic chart
Bubble/scatter chart

Comparison
Development
Structure
Correlation

an exploration of dissemination data: StatMine

9
Chart type – bar chart

an exploration of dissemination data: StatMine

10
Chart type – line chart

an exploration of dissemination data: StatMine

11
Chart type – mosaic chart

an exploration of dissemination data: StatMine

12
Chart type – bubble chart

an exploration of dissemination data: StatMine

13
Small multiples




Split chart into different subpopulations
Goal: compare subpopulations
Very little tools offer this functionality!

an exploration of dissemination data: StatMine

14
Small multiples

an exploration of dissemination data: StatMine

15
Composing a chart
Example:
• Year x Region x Gender x Age
• Count
• Mean income
• Employment

categorical variables /
dimensions
Numeric variables / topics

an exploration of dissemination data: StatMine

16
Prototype
• Built in php, javascript (d3)
• Imported 10 StatLine example tables
• Complex tables, e.g.
• Labor participation x gender x cohorts
• Labor market flow per quarter (employed/unemployed)
• Enterprise birth, death and growth x economic activity x
quarter

• Tested on:
• Internal users
• Owners of data
an exploration of dissemination data: StatMine

17
Demo

an exploration of dissemination data: StatMine

18
Evaluation
• Part I : very succesful
• Owners of data want prototype to check their own
data
• Provides insights
• Easy detection of anomalies

an exploration of dissemination data: StatMine

19
Work in progress
• II, Combination of different fragments
• Testing with policymakers (end this year)
• Or “How to glue statistical tables?”

• III, Derive variables + analysis
• Absolute vs relative (per population unit)
• Turnover / # employees
• Etc

an exploration of dissemination data: StatMine

20
Questions?

an exploration of dissemination data: StatMine

21

More Related Content

Similar to StatMine, visual exploration of output data

Responsible Data Science at Statistics Netherlands
Responsible Data Science at Statistics NetherlandsResponsible Data Science at Statistics Netherlands
Responsible Data Science at Statistics NetherlandsPiet J.H. Daas
 
Strata Big data presentation
Strata Big data presentationStrata Big data presentation
Strata Big data presentationPiet J.H. Daas
 
Big data as a source for official statistics
Big data as a source for official statisticsBig data as a source for official statistics
Big data as a source for official statisticsEdwin de Jonge
 
big data analytics pgpmx2015
big data analytics pgpmx2015big data analytics pgpmx2015
big data analytics pgpmx2015Sanmeet Dhokay
 
On Information Quality: Can Your Data Do The Job? (SCECR 2015 Keynote)
On Information Quality: Can Your Data Do The Job? (SCECR 2015 Keynote)On Information Quality: Can Your Data Do The Job? (SCECR 2015 Keynote)
On Information Quality: Can Your Data Do The Job? (SCECR 2015 Keynote)Galit Shmueli
 
Introduction to Data4Impact
Introduction to Data4ImpactIntroduction to Data4Impact
Introduction to Data4ImpactData4Impact
 
Social Media Mining - Chapter 5 (Data Mining Essentials)
Social Media Mining - Chapter 5 (Data Mining Essentials)Social Media Mining - Chapter 5 (Data Mining Essentials)
Social Media Mining - Chapter 5 (Data Mining Essentials)SocialMediaMining
 
Data + Audience: Connecting to Create Impact
Data + Audience: Connecting to Create ImpactData + Audience: Connecting to Create Impact
Data + Audience: Connecting to Create ImpactCourtney Clark
 
2014.09.09 - NAEC Seminar_Young SMEs, growth and job creation
2014.09.09 - NAEC Seminar_Young SMEs, growth and job creation2014.09.09 - NAEC Seminar_Young SMEs, growth and job creation
2014.09.09 - NAEC Seminar_Young SMEs, growth and job creationOECD_NAEC
 
Data Visualization1.pptx
Data Visualization1.pptxData Visualization1.pptx
Data Visualization1.pptxqwtadhsaber
 
Big Data and HR - Talk @SwissHR Congress
Big Data and HR - Talk @SwissHR CongressBig Data and HR - Talk @SwissHR Congress
Big Data and HR - Talk @SwissHR CongressMarcel Blattner, PhD
 
Τweetfix: Data Analytics on Match Fixing
Τweetfix: Data Analytics on Match FixingΤweetfix: Data Analytics on Match Fixing
Τweetfix: Data Analytics on Match FixingAntigoni-Maria Founta
 
Uncertainty visualisation
Uncertainty visualisationUncertainty visualisation
Uncertainty visualisationEdwin de Jonge
 
Leading with Data: Boost Your ROI with Open and Big Data
Leading with Data: Boost Your ROI with Open and Big DataLeading with Data: Boost Your ROI with Open and Big Data
Leading with Data: Boost Your ROI with Open and Big DataMcGraw-Hill Professional
 
DELSA/GOV 3rd Health meeting - Barbara UBALDI
DELSA/GOV 3rd Health meeting - Barbara UBALDIDELSA/GOV 3rd Health meeting - Barbara UBALDI
DELSA/GOV 3rd Health meeting - Barbara UBALDIOECD Governance
 
Opportunities and methodological challenges of Big Data for official statist...
Opportunities and methodological challenges of  Big Data for official statist...Opportunities and methodological challenges of  Big Data for official statist...
Opportunities and methodological challenges of Big Data for official statist...Piet J.H. Daas
 
IBM Case Study Agility & Analytics
IBM Case Study Agility & AnalyticsIBM Case Study Agility & Analytics
IBM Case Study Agility & AnalyticsVivastream
 
P. Struijs, Toward the Use of Big Data for European Statistics
P. Struijs, Toward the Use of Big Data for European StatisticsP. Struijs, Toward the Use of Big Data for European Statistics
P. Struijs, Toward the Use of Big Data for European StatisticsIstituto nazionale di statistica
 
Introduction to data science
Introduction to data scienceIntroduction to data science
Introduction to data scienceSpartan60
 

Similar to StatMine, visual exploration of output data (20)

Measuring the promise of Open Data: Development of the Impact Monitoring Fram...
Measuring the promise of Open Data: Development of the Impact Monitoring Fram...Measuring the promise of Open Data: Development of the Impact Monitoring Fram...
Measuring the promise of Open Data: Development of the Impact Monitoring Fram...
 
Responsible Data Science at Statistics Netherlands
Responsible Data Science at Statistics NetherlandsResponsible Data Science at Statistics Netherlands
Responsible Data Science at Statistics Netherlands
 
Strata Big data presentation
Strata Big data presentationStrata Big data presentation
Strata Big data presentation
 
Big data as a source for official statistics
Big data as a source for official statisticsBig data as a source for official statistics
Big data as a source for official statistics
 
big data analytics pgpmx2015
big data analytics pgpmx2015big data analytics pgpmx2015
big data analytics pgpmx2015
 
On Information Quality: Can Your Data Do The Job? (SCECR 2015 Keynote)
On Information Quality: Can Your Data Do The Job? (SCECR 2015 Keynote)On Information Quality: Can Your Data Do The Job? (SCECR 2015 Keynote)
On Information Quality: Can Your Data Do The Job? (SCECR 2015 Keynote)
 
Introduction to Data4Impact
Introduction to Data4ImpactIntroduction to Data4Impact
Introduction to Data4Impact
 
Social Media Mining - Chapter 5 (Data Mining Essentials)
Social Media Mining - Chapter 5 (Data Mining Essentials)Social Media Mining - Chapter 5 (Data Mining Essentials)
Social Media Mining - Chapter 5 (Data Mining Essentials)
 
Data + Audience: Connecting to Create Impact
Data + Audience: Connecting to Create ImpactData + Audience: Connecting to Create Impact
Data + Audience: Connecting to Create Impact
 
2014.09.09 - NAEC Seminar_Young SMEs, growth and job creation
2014.09.09 - NAEC Seminar_Young SMEs, growth and job creation2014.09.09 - NAEC Seminar_Young SMEs, growth and job creation
2014.09.09 - NAEC Seminar_Young SMEs, growth and job creation
 
Data Visualization1.pptx
Data Visualization1.pptxData Visualization1.pptx
Data Visualization1.pptx
 
Big Data and HR - Talk @SwissHR Congress
Big Data and HR - Talk @SwissHR CongressBig Data and HR - Talk @SwissHR Congress
Big Data and HR - Talk @SwissHR Congress
 
Τweetfix: Data Analytics on Match Fixing
Τweetfix: Data Analytics on Match FixingΤweetfix: Data Analytics on Match Fixing
Τweetfix: Data Analytics on Match Fixing
 
Uncertainty visualisation
Uncertainty visualisationUncertainty visualisation
Uncertainty visualisation
 
Leading with Data: Boost Your ROI with Open and Big Data
Leading with Data: Boost Your ROI with Open and Big DataLeading with Data: Boost Your ROI with Open and Big Data
Leading with Data: Boost Your ROI with Open and Big Data
 
DELSA/GOV 3rd Health meeting - Barbara UBALDI
DELSA/GOV 3rd Health meeting - Barbara UBALDIDELSA/GOV 3rd Health meeting - Barbara UBALDI
DELSA/GOV 3rd Health meeting - Barbara UBALDI
 
Opportunities and methodological challenges of Big Data for official statist...
Opportunities and methodological challenges of  Big Data for official statist...Opportunities and methodological challenges of  Big Data for official statist...
Opportunities and methodological challenges of Big Data for official statist...
 
IBM Case Study Agility & Analytics
IBM Case Study Agility & AnalyticsIBM Case Study Agility & Analytics
IBM Case Study Agility & Analytics
 
P. Struijs, Toward the Use of Big Data for European Statistics
P. Struijs, Toward the Use of Big Data for European StatisticsP. Struijs, Toward the Use of Big Data for European Statistics
P. Struijs, Toward the Use of Big Data for European Statistics
 
Introduction to data science
Introduction to data scienceIntroduction to data science
Introduction to data science
 

More from Edwin de Jonge

Validatetools, resolve and simplify contradictive or data validation rules
Validatetools, resolve and simplify contradictive or data validation rulesValidatetools, resolve and simplify contradictive or data validation rules
Validatetools, resolve and simplify contradictive or data validation rulesEdwin de Jonge
 
Data error! But where?
Data error! But where?Data error! But where?
Data error! But where?Edwin de Jonge
 
Daff: diff, patch and merge for data.frame
Daff: diff, patch and merge for data.frameDaff: diff, patch and merge for data.frame
Daff: diff, patch and merge for data.frameEdwin de Jonge
 
Chunked, dplyr for large text files
Chunked, dplyr for large text filesChunked, dplyr for large text files
Chunked, dplyr for large text filesEdwin de Jonge
 
Heatmaps best practices Strata Hadoop
Heatmaps best practices Strata HadoopHeatmaps best practices Strata Hadoop
Heatmaps best practices Strata HadoopEdwin de Jonge
 
Docopt, beautiful command-line options for R, user2014
Docopt, beautiful command-line options for R,  user2014Docopt, beautiful command-line options for R,  user2014
Docopt, beautiful command-line options for R, user2014Edwin de Jonge
 
Big Data Visualization
Big Data VisualizationBig Data Visualization
Big Data VisualizationEdwin de Jonge
 
ffbase, statistical functions for large datasets
ffbase, statistical functions for large datasetsffbase, statistical functions for large datasets
ffbase, statistical functions for large datasetsEdwin de Jonge
 
Statmine, Visuele dataexploratie
Statmine, Visuele dataexploratieStatmine, Visuele dataexploratie
Statmine, Visuele dataexploratieEdwin de Jonge
 

More from Edwin de Jonge (11)

sdcSpatial user!2019
sdcSpatial user!2019sdcSpatial user!2019
sdcSpatial user!2019
 
Validatetools, resolve and simplify contradictive or data validation rules
Validatetools, resolve and simplify contradictive or data validation rulesValidatetools, resolve and simplify contradictive or data validation rules
Validatetools, resolve and simplify contradictive or data validation rules
 
Data error! But where?
Data error! But where?Data error! But where?
Data error! But where?
 
Daff: diff, patch and merge for data.frame
Daff: diff, patch and merge for data.frameDaff: diff, patch and merge for data.frame
Daff: diff, patch and merge for data.frame
 
Chunked, dplyr for large text files
Chunked, dplyr for large text filesChunked, dplyr for large text files
Chunked, dplyr for large text files
 
Heatmaps best practices Strata Hadoop
Heatmaps best practices Strata HadoopHeatmaps best practices Strata Hadoop
Heatmaps best practices Strata Hadoop
 
Docopt, beautiful command-line options for R, user2014
Docopt, beautiful command-line options for R,  user2014Docopt, beautiful command-line options for R,  user2014
Docopt, beautiful command-line options for R, user2014
 
Big data experiments
Big data experimentsBig data experiments
Big data experiments
 
Big Data Visualization
Big Data VisualizationBig Data Visualization
Big Data Visualization
 
ffbase, statistical functions for large datasets
ffbase, statistical functions for large datasetsffbase, statistical functions for large datasets
ffbase, statistical functions for large datasets
 
Statmine, Visuele dataexploratie
Statmine, Visuele dataexploratieStatmine, Visuele dataexploratie
Statmine, Visuele dataexploratie
 

Recently uploaded

Advanced Test Driven-Development @ php[tek] 2024
Advanced Test Driven-Development @ php[tek] 2024Advanced Test Driven-Development @ php[tek] 2024
Advanced Test Driven-Development @ php[tek] 2024Scott Keck-Warren
 
Streamlining Python Development: A Guide to a Modern Project Setup
Streamlining Python Development: A Guide to a Modern Project SetupStreamlining Python Development: A Guide to a Modern Project Setup
Streamlining Python Development: A Guide to a Modern Project SetupFlorian Wilhelm
 
"LLMs for Python Engineers: Advanced Data Analysis and Semantic Kernel",Oleks...
"LLMs for Python Engineers: Advanced Data Analysis and Semantic Kernel",Oleks..."LLMs for Python Engineers: Advanced Data Analysis and Semantic Kernel",Oleks...
"LLMs for Python Engineers: Advanced Data Analysis and Semantic Kernel",Oleks...Fwdays
 
Automating Business Process via MuleSoft Composer | Bangalore MuleSoft Meetup...
Automating Business Process via MuleSoft Composer | Bangalore MuleSoft Meetup...Automating Business Process via MuleSoft Composer | Bangalore MuleSoft Meetup...
Automating Business Process via MuleSoft Composer | Bangalore MuleSoft Meetup...shyamraj55
 
#StandardsGoals for 2024: What’s new for BISAC - Tech Forum 2024
#StandardsGoals for 2024: What’s new for BISAC - Tech Forum 2024#StandardsGoals for 2024: What’s new for BISAC - Tech Forum 2024
#StandardsGoals for 2024: What’s new for BISAC - Tech Forum 2024BookNet Canada
 
Swan(sea) Song – personal research during my six years at Swansea ... and bey...
Swan(sea) Song – personal research during my six years at Swansea ... and bey...Swan(sea) Song – personal research during my six years at Swansea ... and bey...
Swan(sea) Song – personal research during my six years at Swansea ... and bey...Alan Dix
 
Benefits Of Flutter Compared To Other Frameworks
Benefits Of Flutter Compared To Other FrameworksBenefits Of Flutter Compared To Other Frameworks
Benefits Of Flutter Compared To Other FrameworksSoftradix Technologies
 
Transcript: New from BookNet Canada for 2024: BNC BiblioShare - Tech Forum 2024
Transcript: New from BookNet Canada for 2024: BNC BiblioShare - Tech Forum 2024Transcript: New from BookNet Canada for 2024: BNC BiblioShare - Tech Forum 2024
Transcript: New from BookNet Canada for 2024: BNC BiblioShare - Tech Forum 2024BookNet Canada
 
Are Multi-Cloud and Serverless Good or Bad?
Are Multi-Cloud and Serverless Good or Bad?Are Multi-Cloud and Serverless Good or Bad?
Are Multi-Cloud and Serverless Good or Bad?Mattias Andersson
 
Making_way_through_DLL_hollowing_inspite_of_CFG_by_Debjeet Banerjee.pptx
Making_way_through_DLL_hollowing_inspite_of_CFG_by_Debjeet Banerjee.pptxMaking_way_through_DLL_hollowing_inspite_of_CFG_by_Debjeet Banerjee.pptx
Making_way_through_DLL_hollowing_inspite_of_CFG_by_Debjeet Banerjee.pptxnull - The Open Security Community
 
Install Stable Diffusion in windows machine
Install Stable Diffusion in windows machineInstall Stable Diffusion in windows machine
Install Stable Diffusion in windows machinePadma Pradeep
 
Scanning the Internet for External Cloud Exposures via SSL Certs
Scanning the Internet for External Cloud Exposures via SSL CertsScanning the Internet for External Cloud Exposures via SSL Certs
Scanning the Internet for External Cloud Exposures via SSL CertsRizwan Syed
 
Unblocking The Main Thread Solving ANRs and Frozen Frames
Unblocking The Main Thread Solving ANRs and Frozen FramesUnblocking The Main Thread Solving ANRs and Frozen Frames
Unblocking The Main Thread Solving ANRs and Frozen FramesSinan KOZAK
 
Artificial intelligence in the post-deep learning era
Artificial intelligence in the post-deep learning eraArtificial intelligence in the post-deep learning era
Artificial intelligence in the post-deep learning eraDeakin University
 
Connect Wave/ connectwave Pitch Deck Presentation
Connect Wave/ connectwave Pitch Deck PresentationConnect Wave/ connectwave Pitch Deck Presentation
Connect Wave/ connectwave Pitch Deck PresentationSlibray Presentation
 
AI as an Interface for Commercial Buildings
AI as an Interface for Commercial BuildingsAI as an Interface for Commercial Buildings
AI as an Interface for Commercial BuildingsMemoori
 
Key Features Of Token Development (1).pptx
Key  Features Of Token  Development (1).pptxKey  Features Of Token  Development (1).pptx
Key Features Of Token Development (1).pptxLBM Solutions
 
Kotlin Multiplatform & Compose Multiplatform - Starter kit for pragmatics
Kotlin Multiplatform & Compose Multiplatform - Starter kit for pragmaticsKotlin Multiplatform & Compose Multiplatform - Starter kit for pragmatics
Kotlin Multiplatform & Compose Multiplatform - Starter kit for pragmaticsAndrey Dotsenko
 

Recently uploaded (20)

Vulnerability_Management_GRC_by Sohang Sengupta.pptx
Vulnerability_Management_GRC_by Sohang Sengupta.pptxVulnerability_Management_GRC_by Sohang Sengupta.pptx
Vulnerability_Management_GRC_by Sohang Sengupta.pptx
 
Advanced Test Driven-Development @ php[tek] 2024
Advanced Test Driven-Development @ php[tek] 2024Advanced Test Driven-Development @ php[tek] 2024
Advanced Test Driven-Development @ php[tek] 2024
 
Streamlining Python Development: A Guide to a Modern Project Setup
Streamlining Python Development: A Guide to a Modern Project SetupStreamlining Python Development: A Guide to a Modern Project Setup
Streamlining Python Development: A Guide to a Modern Project Setup
 
"LLMs for Python Engineers: Advanced Data Analysis and Semantic Kernel",Oleks...
"LLMs for Python Engineers: Advanced Data Analysis and Semantic Kernel",Oleks..."LLMs for Python Engineers: Advanced Data Analysis and Semantic Kernel",Oleks...
"LLMs for Python Engineers: Advanced Data Analysis and Semantic Kernel",Oleks...
 
DMCC Future of Trade Web3 - Special Edition
DMCC Future of Trade Web3 - Special EditionDMCC Future of Trade Web3 - Special Edition
DMCC Future of Trade Web3 - Special Edition
 
Automating Business Process via MuleSoft Composer | Bangalore MuleSoft Meetup...
Automating Business Process via MuleSoft Composer | Bangalore MuleSoft Meetup...Automating Business Process via MuleSoft Composer | Bangalore MuleSoft Meetup...
Automating Business Process via MuleSoft Composer | Bangalore MuleSoft Meetup...
 
#StandardsGoals for 2024: What’s new for BISAC - Tech Forum 2024
#StandardsGoals for 2024: What’s new for BISAC - Tech Forum 2024#StandardsGoals for 2024: What’s new for BISAC - Tech Forum 2024
#StandardsGoals for 2024: What’s new for BISAC - Tech Forum 2024
 
Swan(sea) Song – personal research during my six years at Swansea ... and bey...
Swan(sea) Song – personal research during my six years at Swansea ... and bey...Swan(sea) Song – personal research during my six years at Swansea ... and bey...
Swan(sea) Song – personal research during my six years at Swansea ... and bey...
 
Benefits Of Flutter Compared To Other Frameworks
Benefits Of Flutter Compared To Other FrameworksBenefits Of Flutter Compared To Other Frameworks
Benefits Of Flutter Compared To Other Frameworks
 
Transcript: New from BookNet Canada for 2024: BNC BiblioShare - Tech Forum 2024
Transcript: New from BookNet Canada for 2024: BNC BiblioShare - Tech Forum 2024Transcript: New from BookNet Canada for 2024: BNC BiblioShare - Tech Forum 2024
Transcript: New from BookNet Canada for 2024: BNC BiblioShare - Tech Forum 2024
 
Are Multi-Cloud and Serverless Good or Bad?
Are Multi-Cloud and Serverless Good or Bad?Are Multi-Cloud and Serverless Good or Bad?
Are Multi-Cloud and Serverless Good or Bad?
 
Making_way_through_DLL_hollowing_inspite_of_CFG_by_Debjeet Banerjee.pptx
Making_way_through_DLL_hollowing_inspite_of_CFG_by_Debjeet Banerjee.pptxMaking_way_through_DLL_hollowing_inspite_of_CFG_by_Debjeet Banerjee.pptx
Making_way_through_DLL_hollowing_inspite_of_CFG_by_Debjeet Banerjee.pptx
 
Install Stable Diffusion in windows machine
Install Stable Diffusion in windows machineInstall Stable Diffusion in windows machine
Install Stable Diffusion in windows machine
 
Scanning the Internet for External Cloud Exposures via SSL Certs
Scanning the Internet for External Cloud Exposures via SSL CertsScanning the Internet for External Cloud Exposures via SSL Certs
Scanning the Internet for External Cloud Exposures via SSL Certs
 
Unblocking The Main Thread Solving ANRs and Frozen Frames
Unblocking The Main Thread Solving ANRs and Frozen FramesUnblocking The Main Thread Solving ANRs and Frozen Frames
Unblocking The Main Thread Solving ANRs and Frozen Frames
 
Artificial intelligence in the post-deep learning era
Artificial intelligence in the post-deep learning eraArtificial intelligence in the post-deep learning era
Artificial intelligence in the post-deep learning era
 
Connect Wave/ connectwave Pitch Deck Presentation
Connect Wave/ connectwave Pitch Deck PresentationConnect Wave/ connectwave Pitch Deck Presentation
Connect Wave/ connectwave Pitch Deck Presentation
 
AI as an Interface for Commercial Buildings
AI as an Interface for Commercial BuildingsAI as an Interface for Commercial Buildings
AI as an Interface for Commercial Buildings
 
Key Features Of Token Development (1).pptx
Key  Features Of Token  Development (1).pptxKey  Features Of Token  Development (1).pptx
Key Features Of Token Development (1).pptx
 
Kotlin Multiplatform & Compose Multiplatform - Starter kit for pragmatics
Kotlin Multiplatform & Compose Multiplatform - Starter kit for pragmaticsKotlin Multiplatform & Compose Multiplatform - Starter kit for pragmatics
Kotlin Multiplatform & Compose Multiplatform - Starter kit for pragmatics
 

StatMine, visual exploration of output data

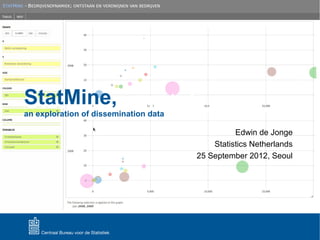
  • 1. StatMine, – prototype StatMine an exploration of dissemination data Edwin de Jonge Statistics Netherlands 25 September 2012, Seoul
  • 2. an exploration of dissemination data: StatMine 2
  • 3. an exploration of dissemination data: StatMine 3
  • 4. StatMine, from numbers to analysis 4
  • 5. Why StatMine? • Statistics Netherlands (SN) mission produce relevant information for: • • • • • • • Policy makers Journalists Citizens Enterprises Economists Social scientists Etc. an exploration of dissemination data: StatMine 5
  • 6. Numbers ≠ Information StatLine is SN’s online DB (over 1 billion figures) We know from a user study that: 1. Many interesting patterns in StatLine are not spotted by users 2. Many important topics in StatLine are scattered across multiple tables an exploration of dissemination data: StatMine 6
  • 7. Example of problem 2 • Policymaker interested in patients with diabetes: • • • • • Visits to medical doctor Hospital admissions Mortality Medication consumption (insuline) Obesity Are all different statistical products (from different sources)! an exploration of dissemination data: StatMine 7
  • 8. Data analysis = Data insight Goal research project StatMine is to provide data insight by: • (I) Using data visualisation • (II) Combining data table fragments • (III) Deriving variables All hypotheses (will be) tested with a prototype with internal and external users. (I), tested and succesful (II, III,… ) is work in progress an exploration of dissemination data: StatMine 8
  • 9. Chart types Bar chart Line chart Mosaic chart Bubble/scatter chart Comparison Development Structure Correlation an exploration of dissemination data: StatMine 9
  • 10. Chart type – bar chart an exploration of dissemination data: StatMine 10
  • 11. Chart type – line chart an exploration of dissemination data: StatMine 11
  • 12. Chart type – mosaic chart an exploration of dissemination data: StatMine 12
  • 13. Chart type – bubble chart an exploration of dissemination data: StatMine 13
  • 14. Small multiples    Split chart into different subpopulations Goal: compare subpopulations Very little tools offer this functionality! an exploration of dissemination data: StatMine 14
  • 15. Small multiples an exploration of dissemination data: StatMine 15
  • 16. Composing a chart Example: • Year x Region x Gender x Age • Count • Mean income • Employment categorical variables / dimensions Numeric variables / topics an exploration of dissemination data: StatMine 16
  • 17. Prototype • Built in php, javascript (d3) • Imported 10 StatLine example tables • Complex tables, e.g. • Labor participation x gender x cohorts • Labor market flow per quarter (employed/unemployed) • Enterprise birth, death and growth x economic activity x quarter • Tested on: • Internal users • Owners of data an exploration of dissemination data: StatMine 17
  • 18. Demo an exploration of dissemination data: StatMine 18
  • 19. Evaluation • Part I : very succesful • Owners of data want prototype to check their own data • Provides insights • Easy detection of anomalies an exploration of dissemination data: StatMine 19
  • 20. Work in progress • II, Combination of different fragments • Testing with policymakers (end this year) • Or “How to glue statistical tables?” • III, Derive variables + analysis • Absolute vs relative (per population unit) • Turnover / # employees • Etc an exploration of dissemination data: StatMine 20
  • 21. Questions? an exploration of dissemination data: StatMine 21