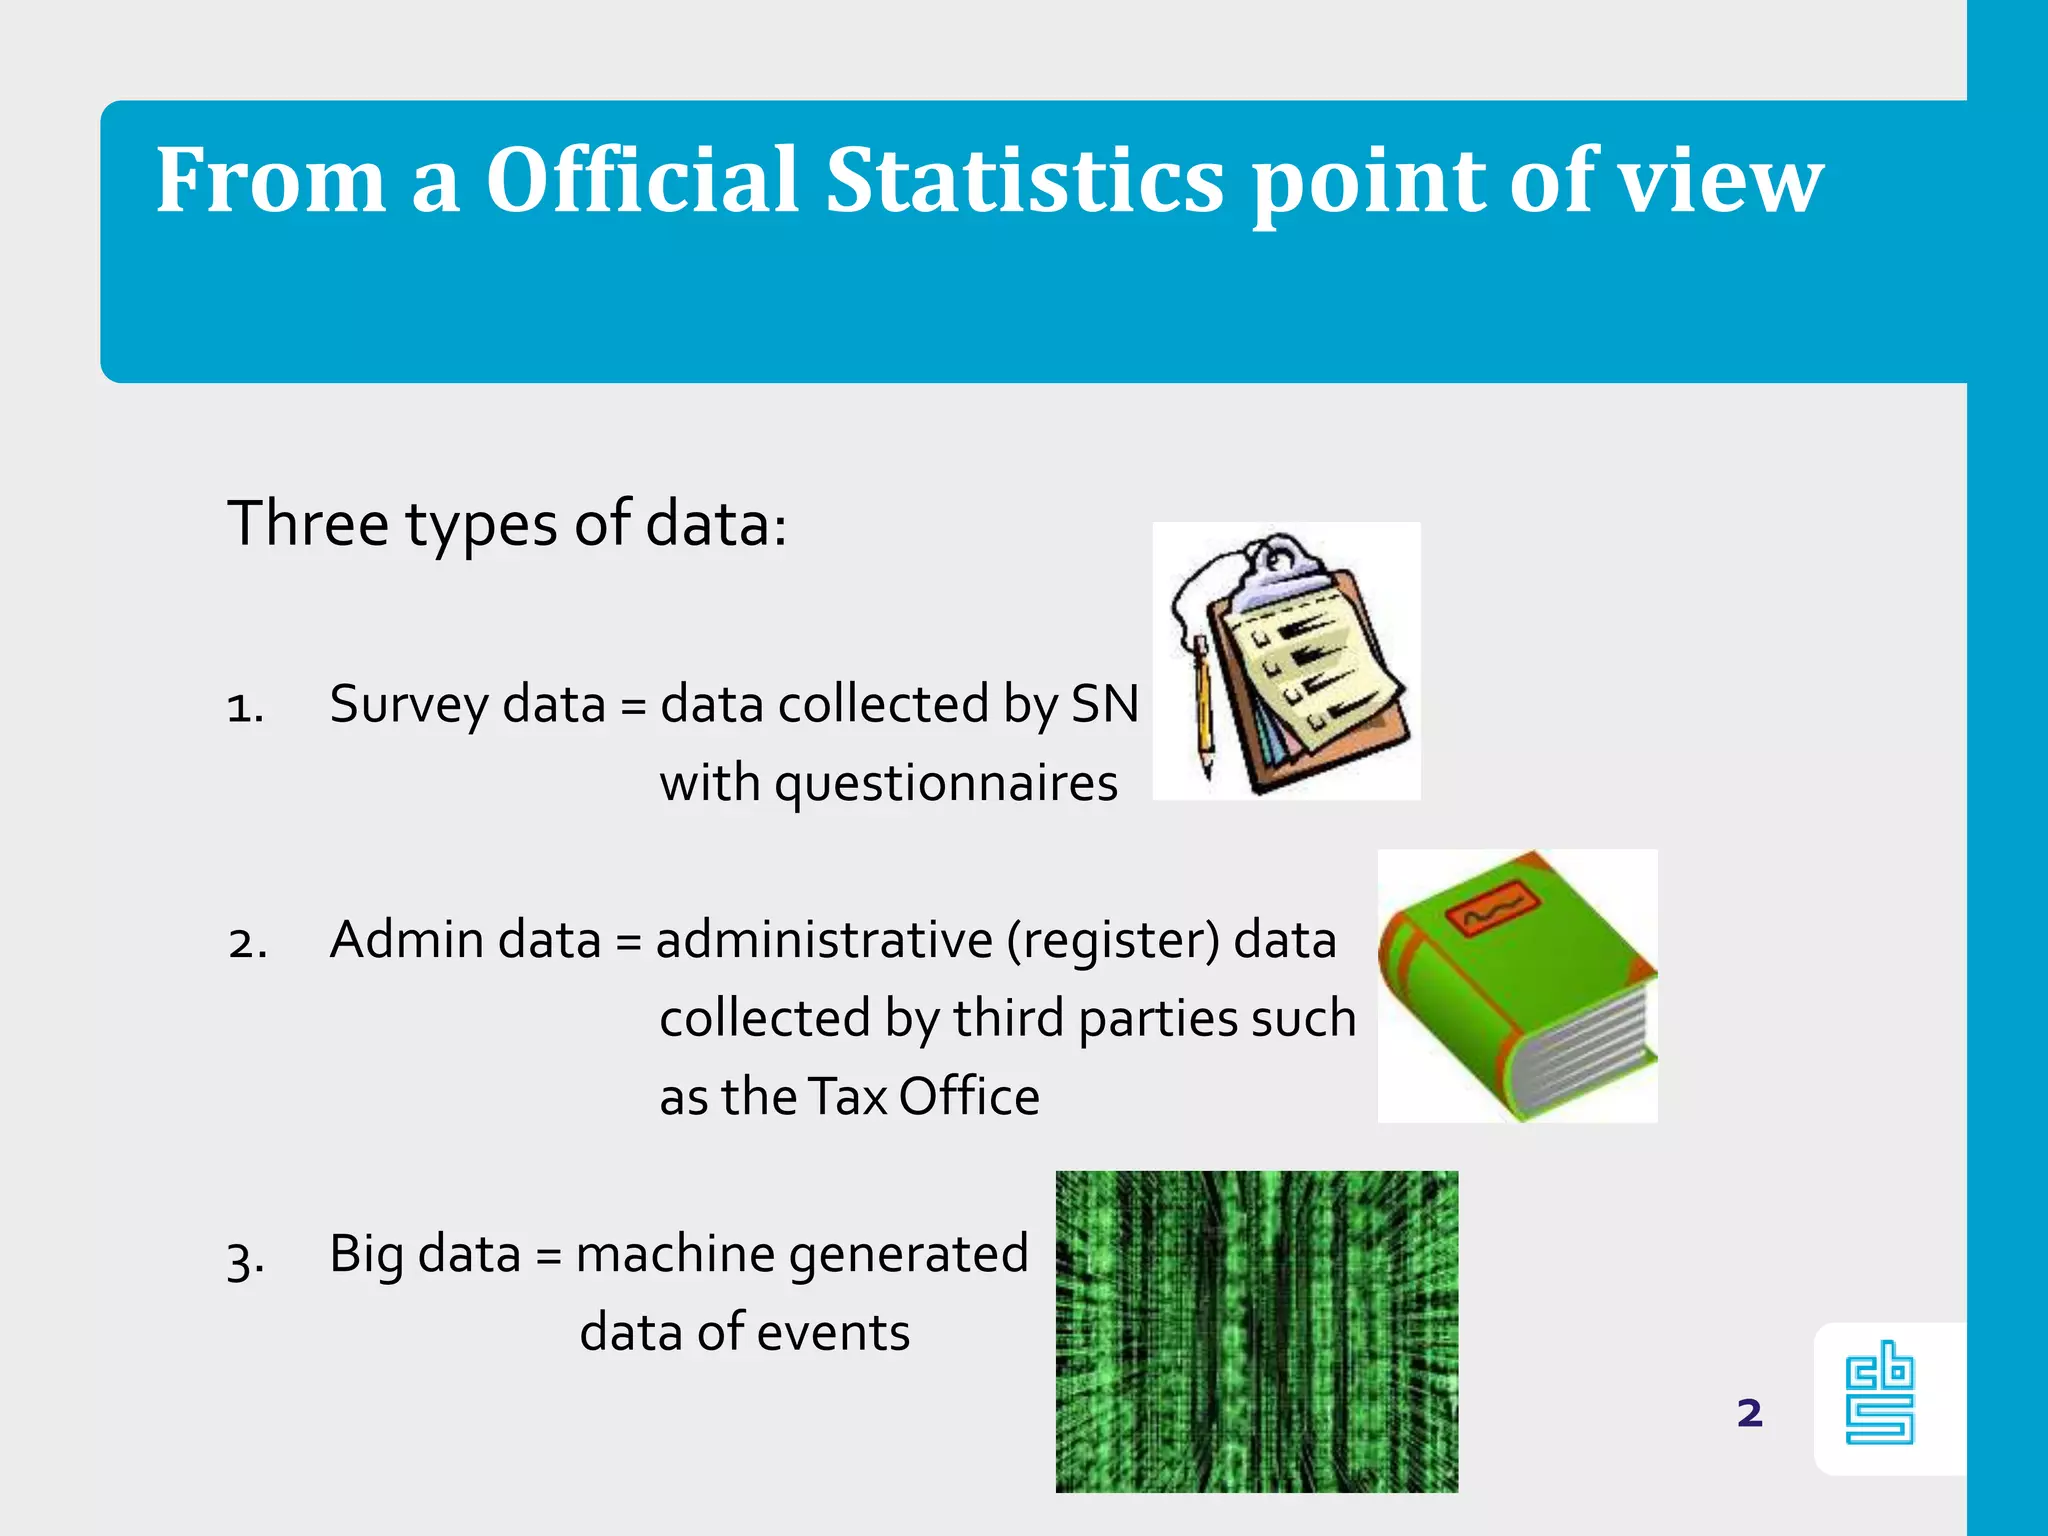
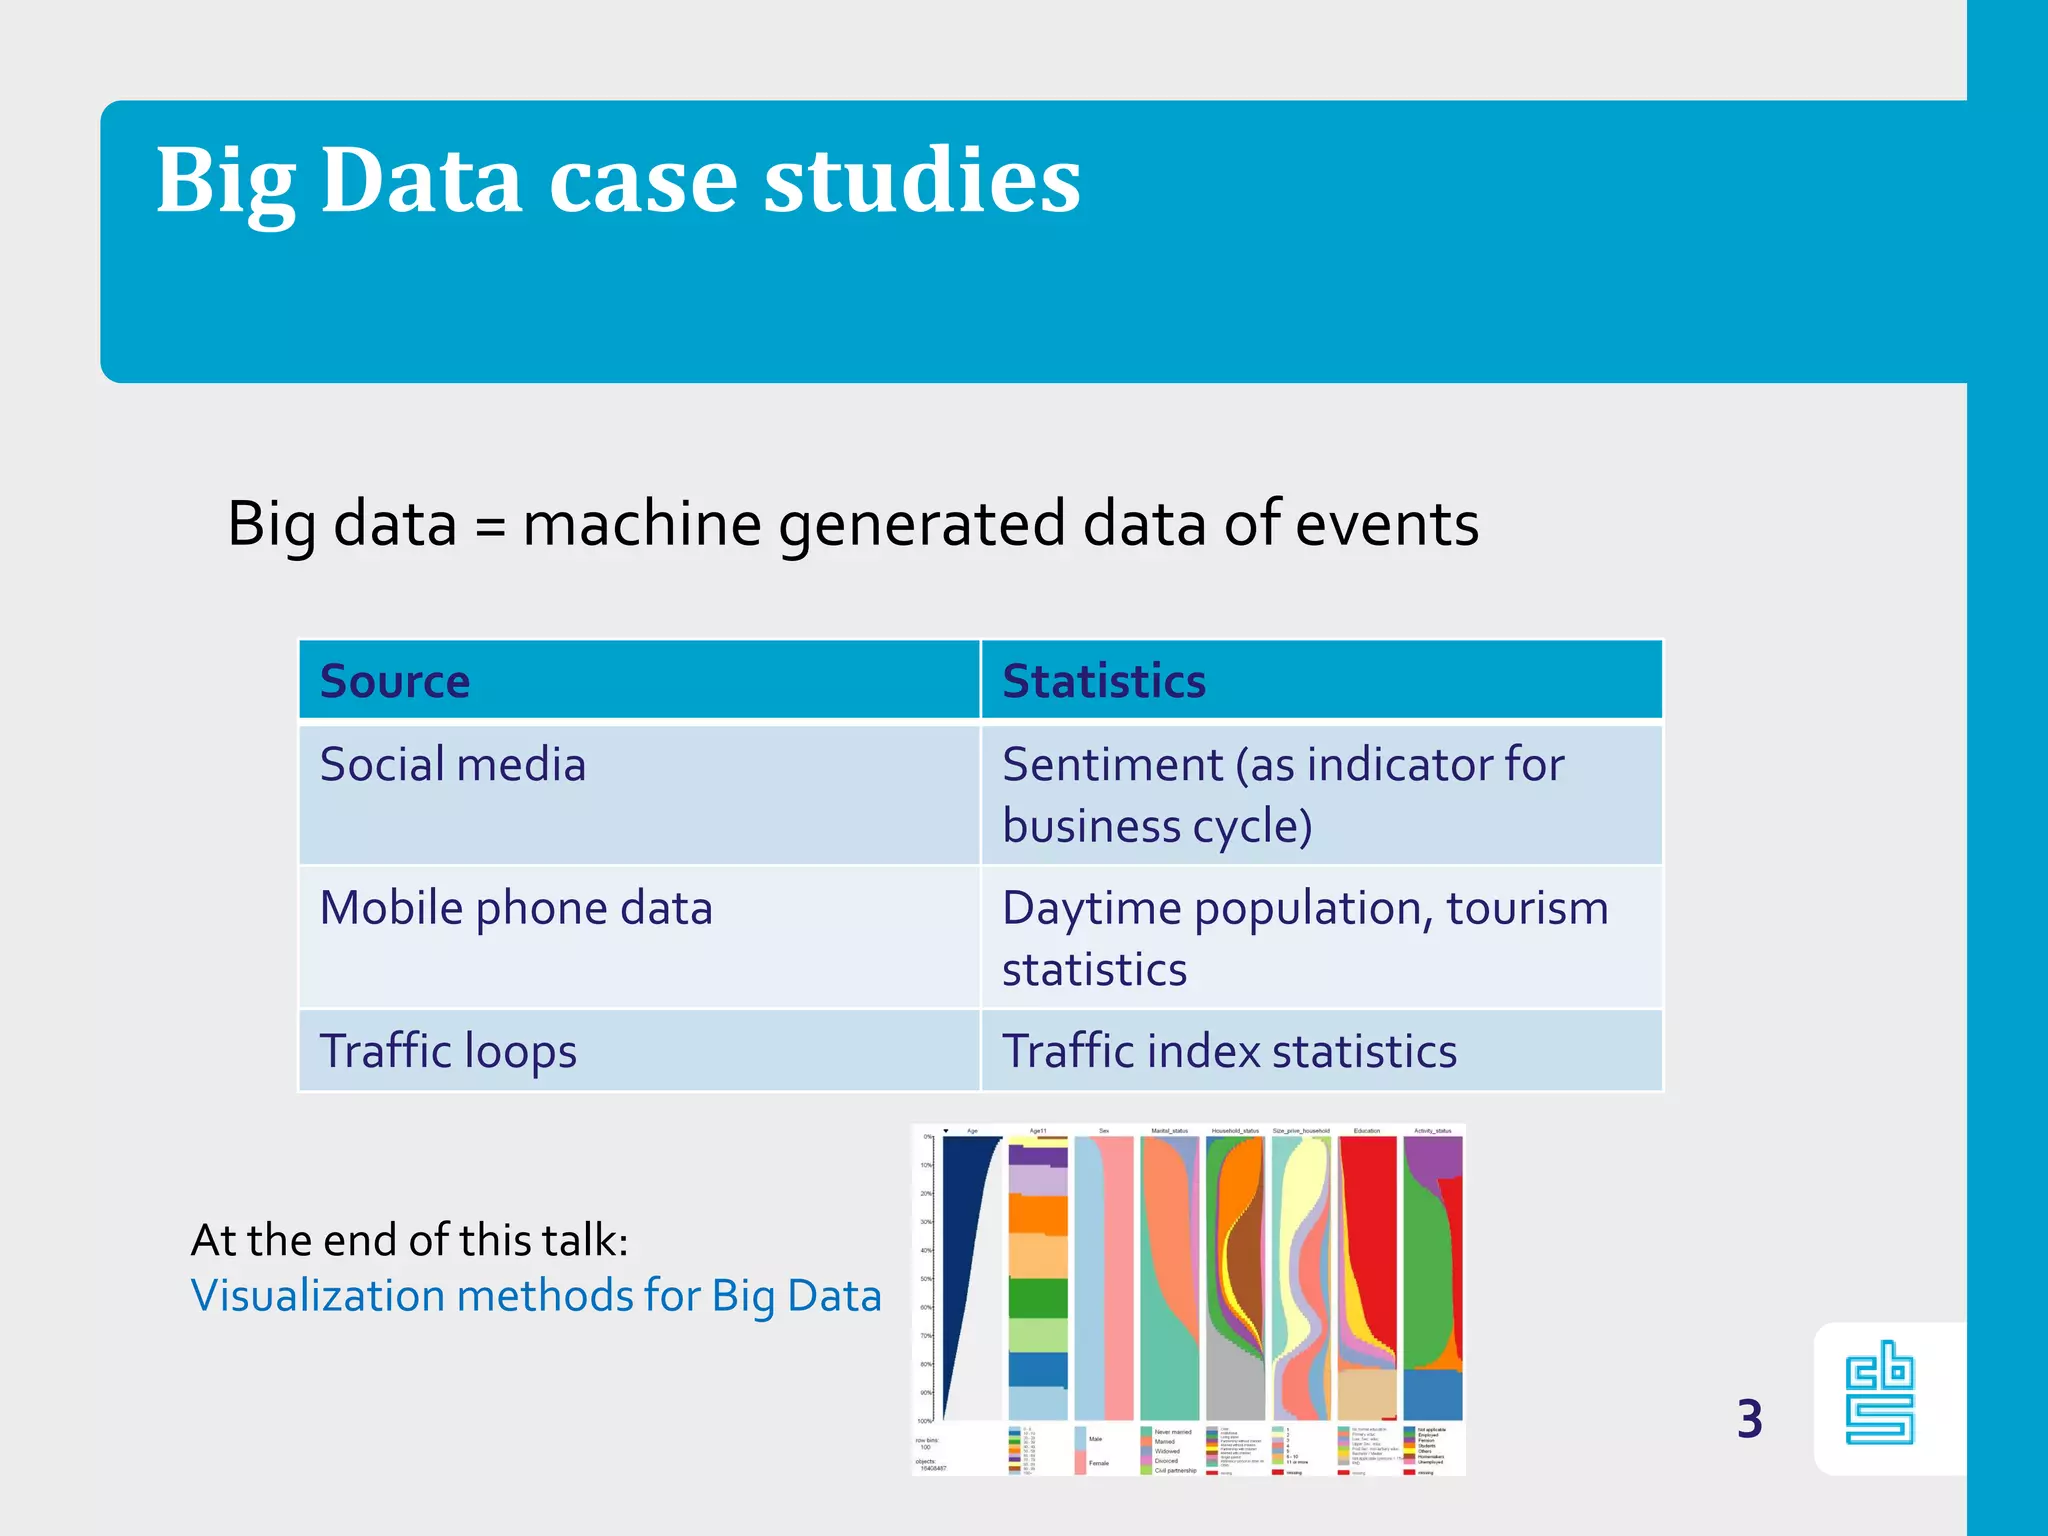
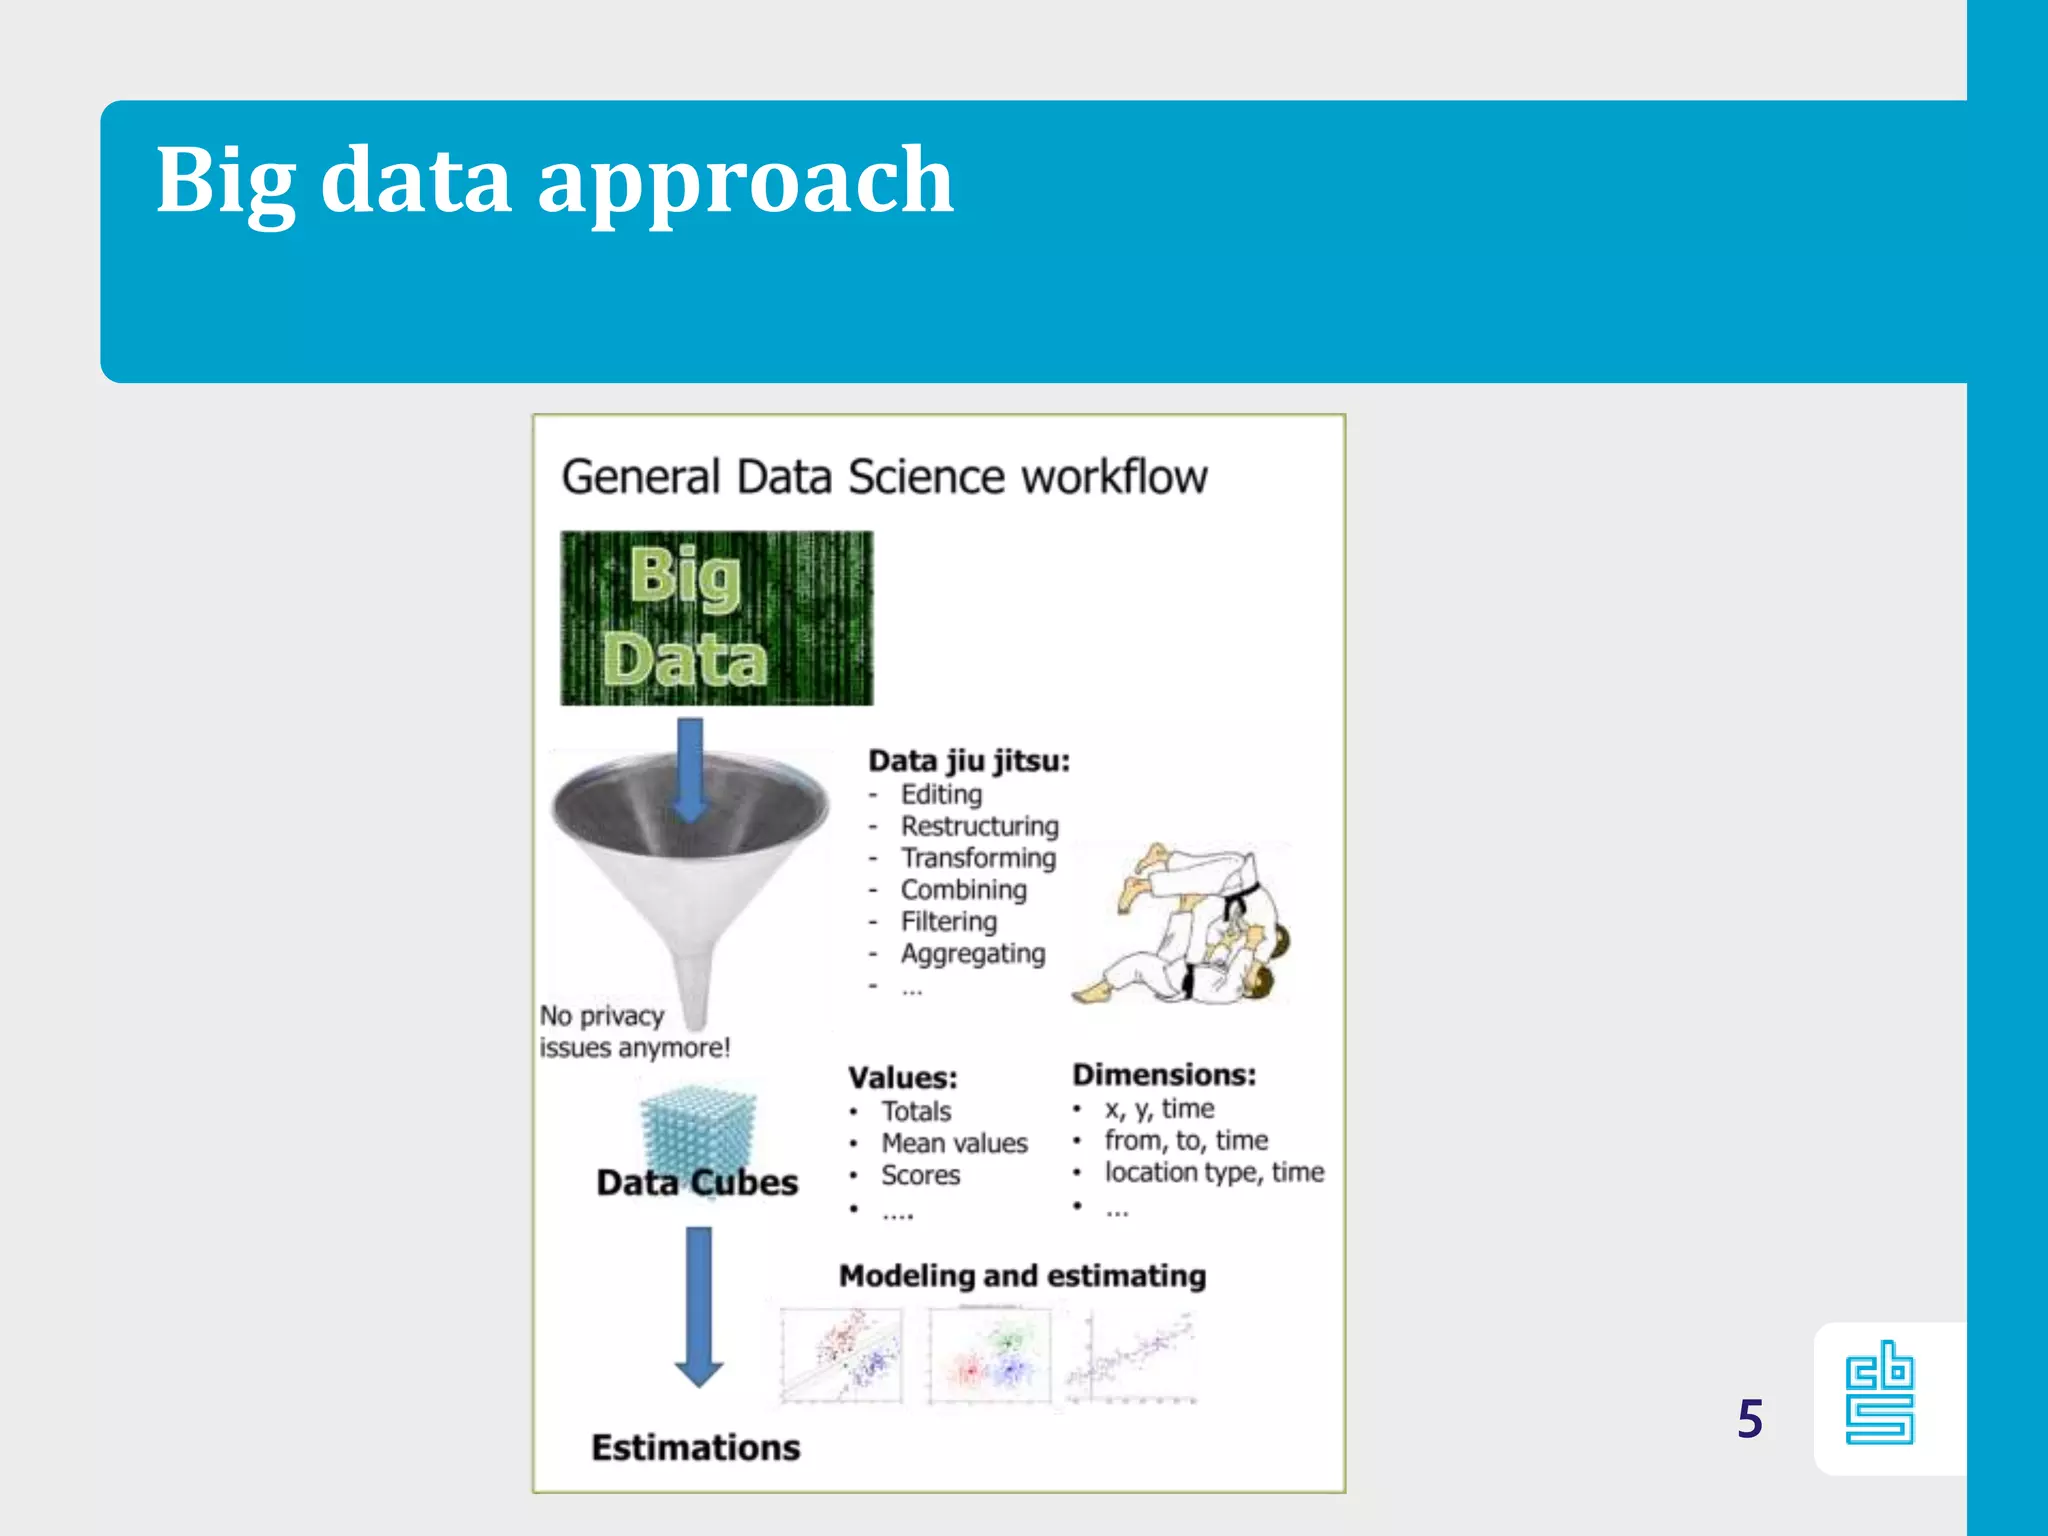
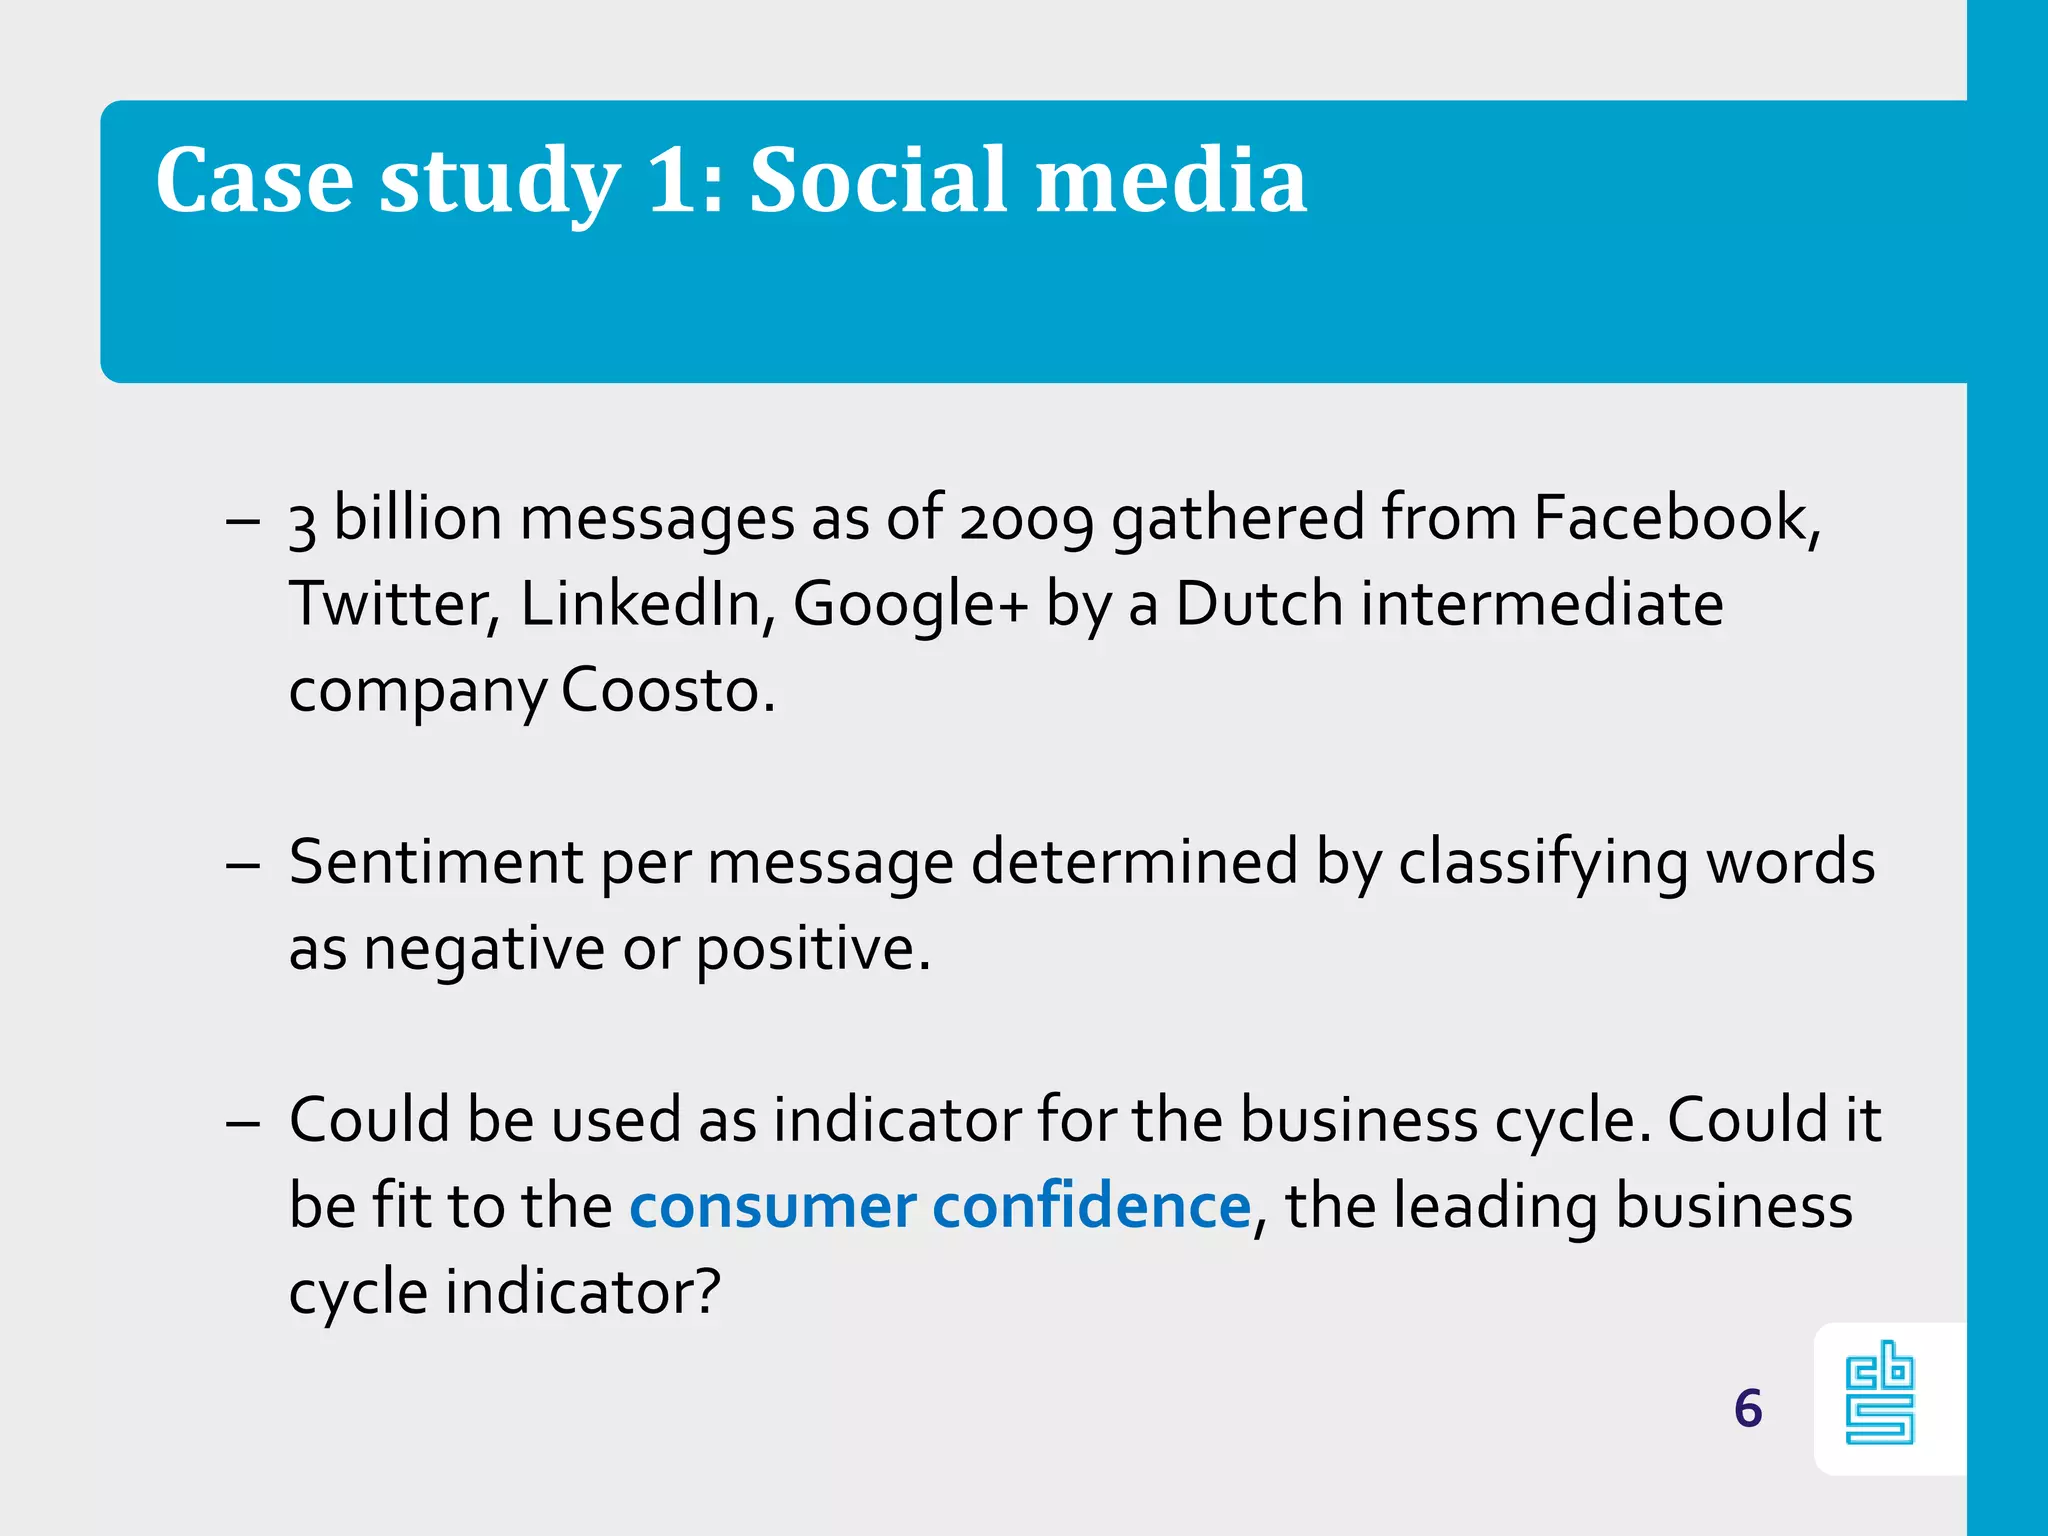
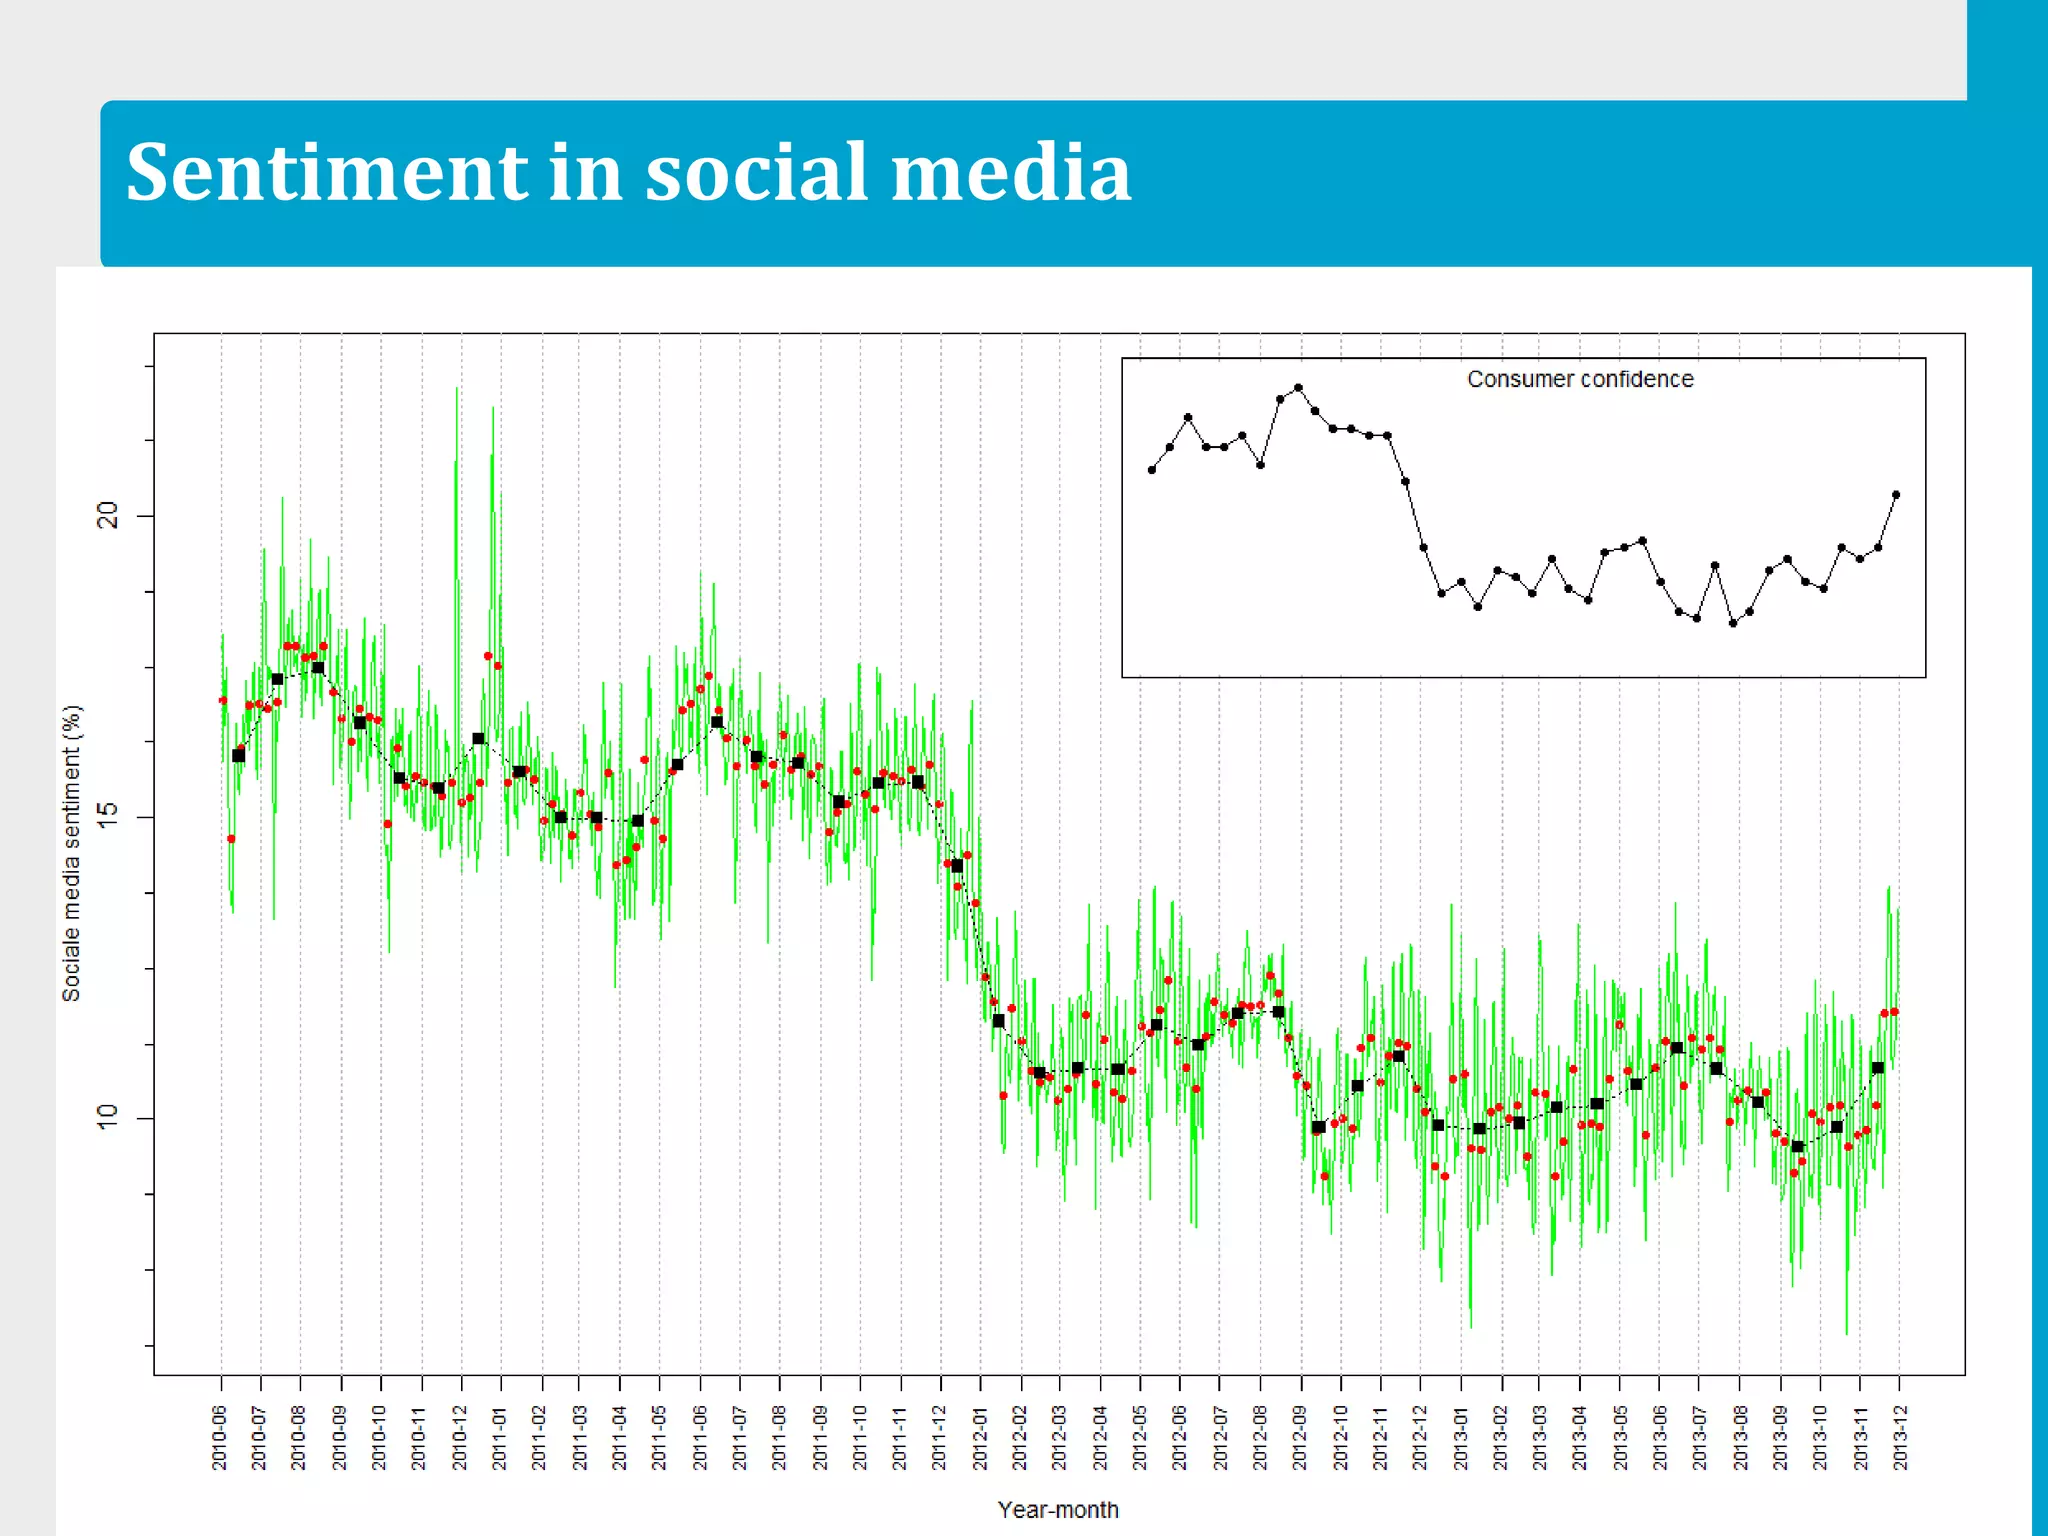
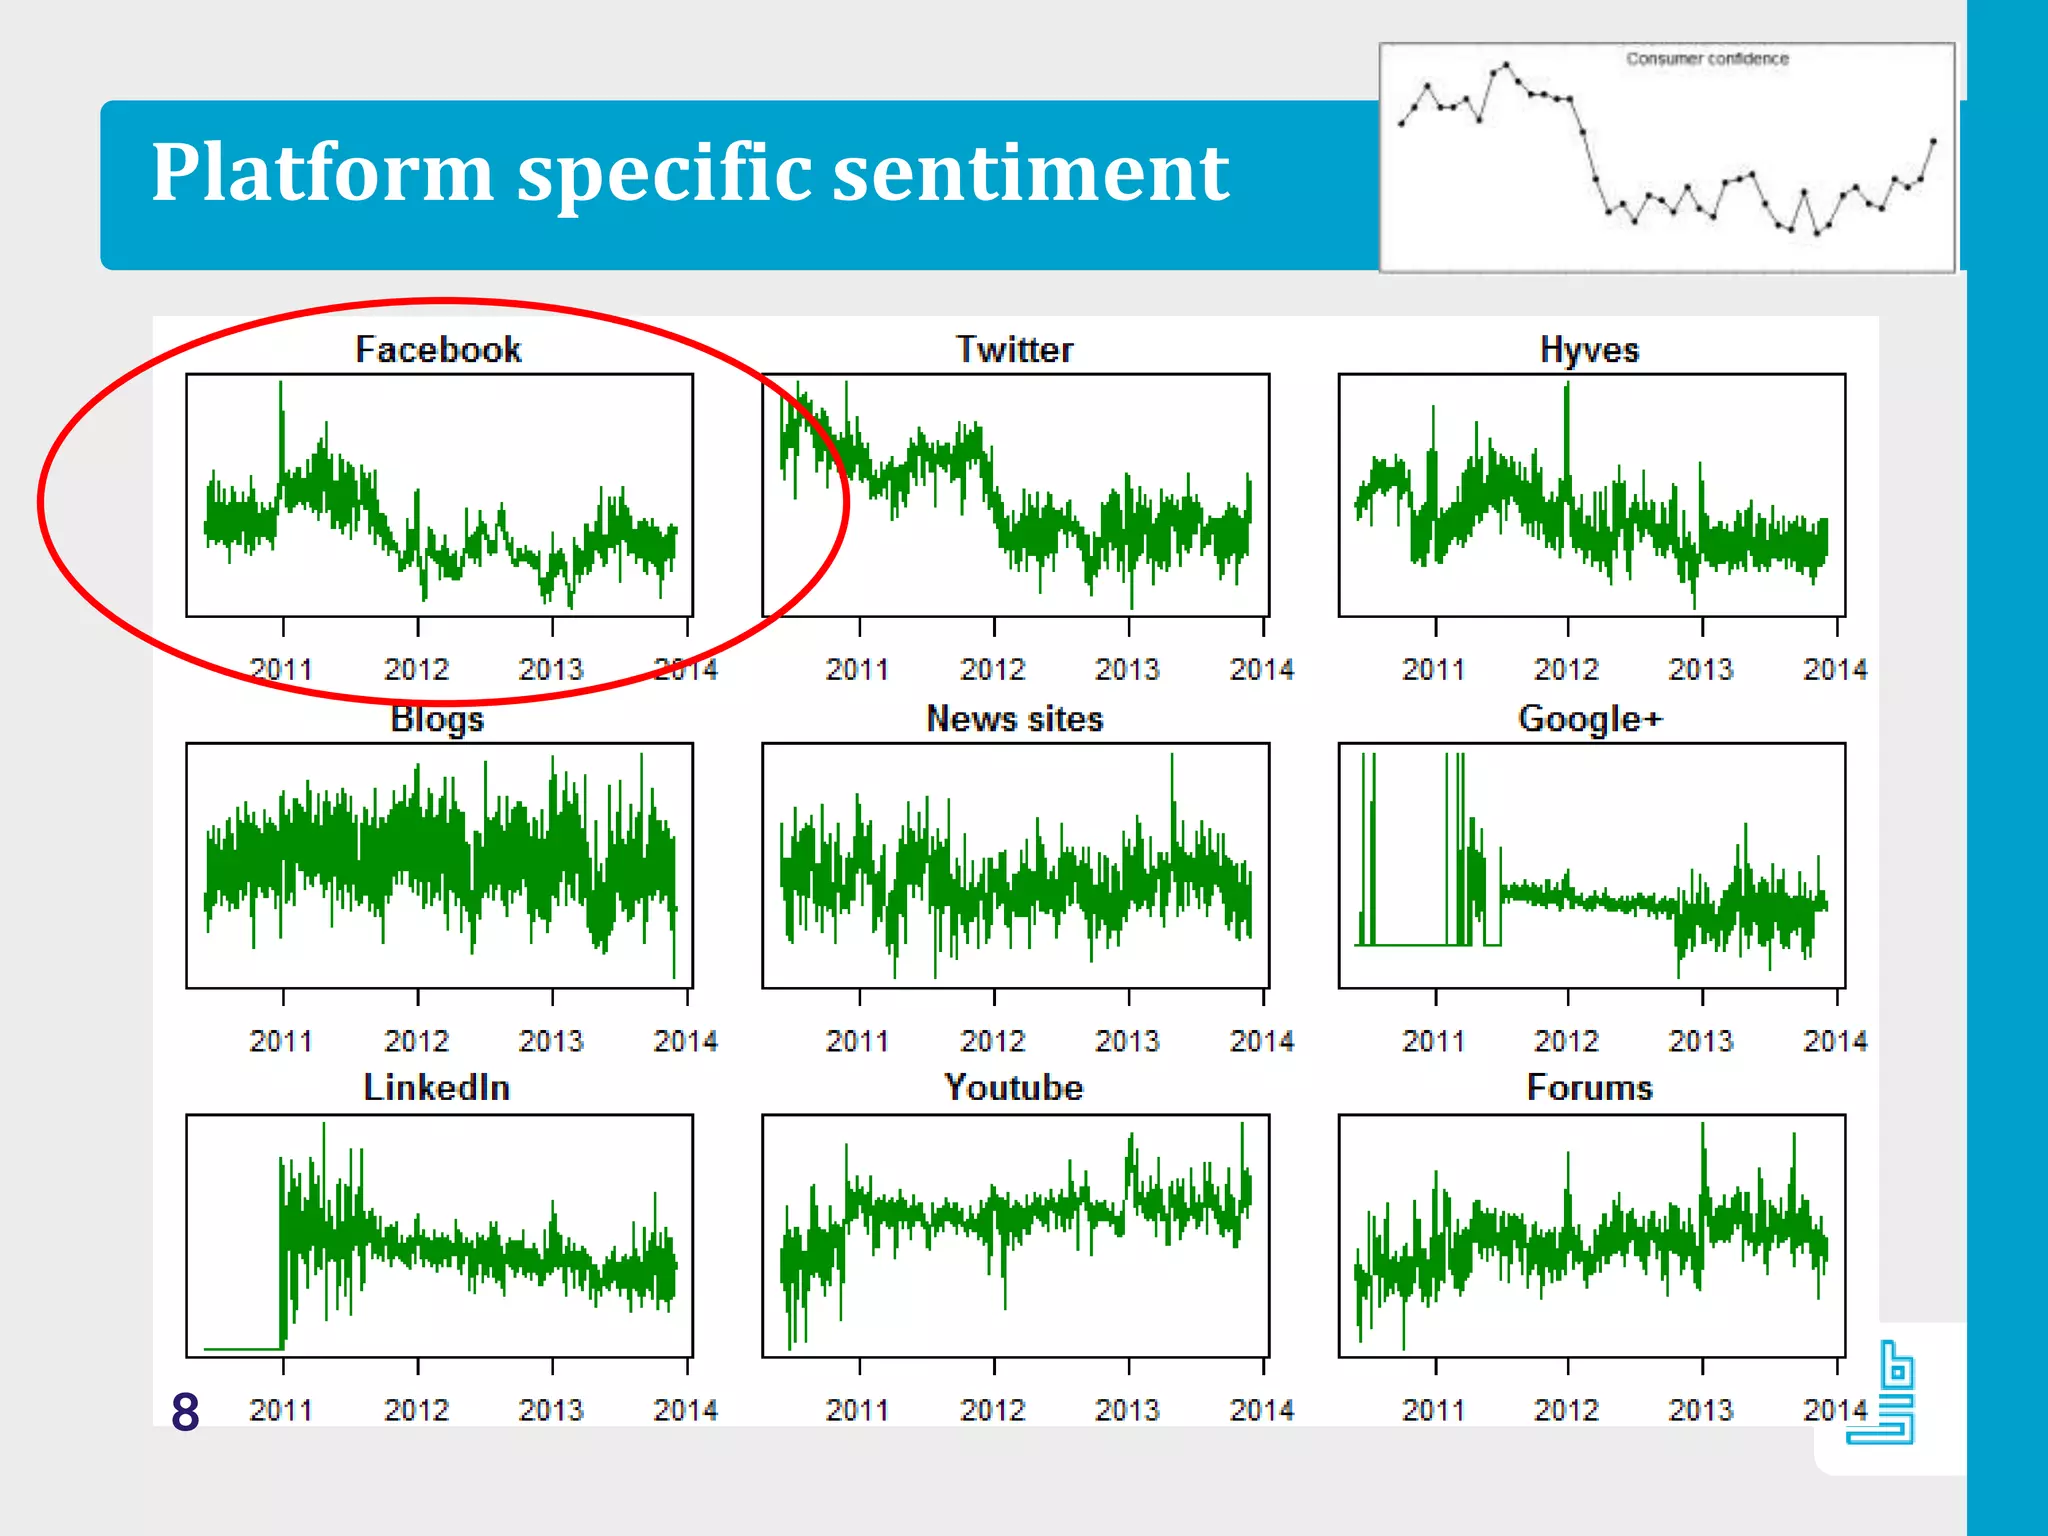
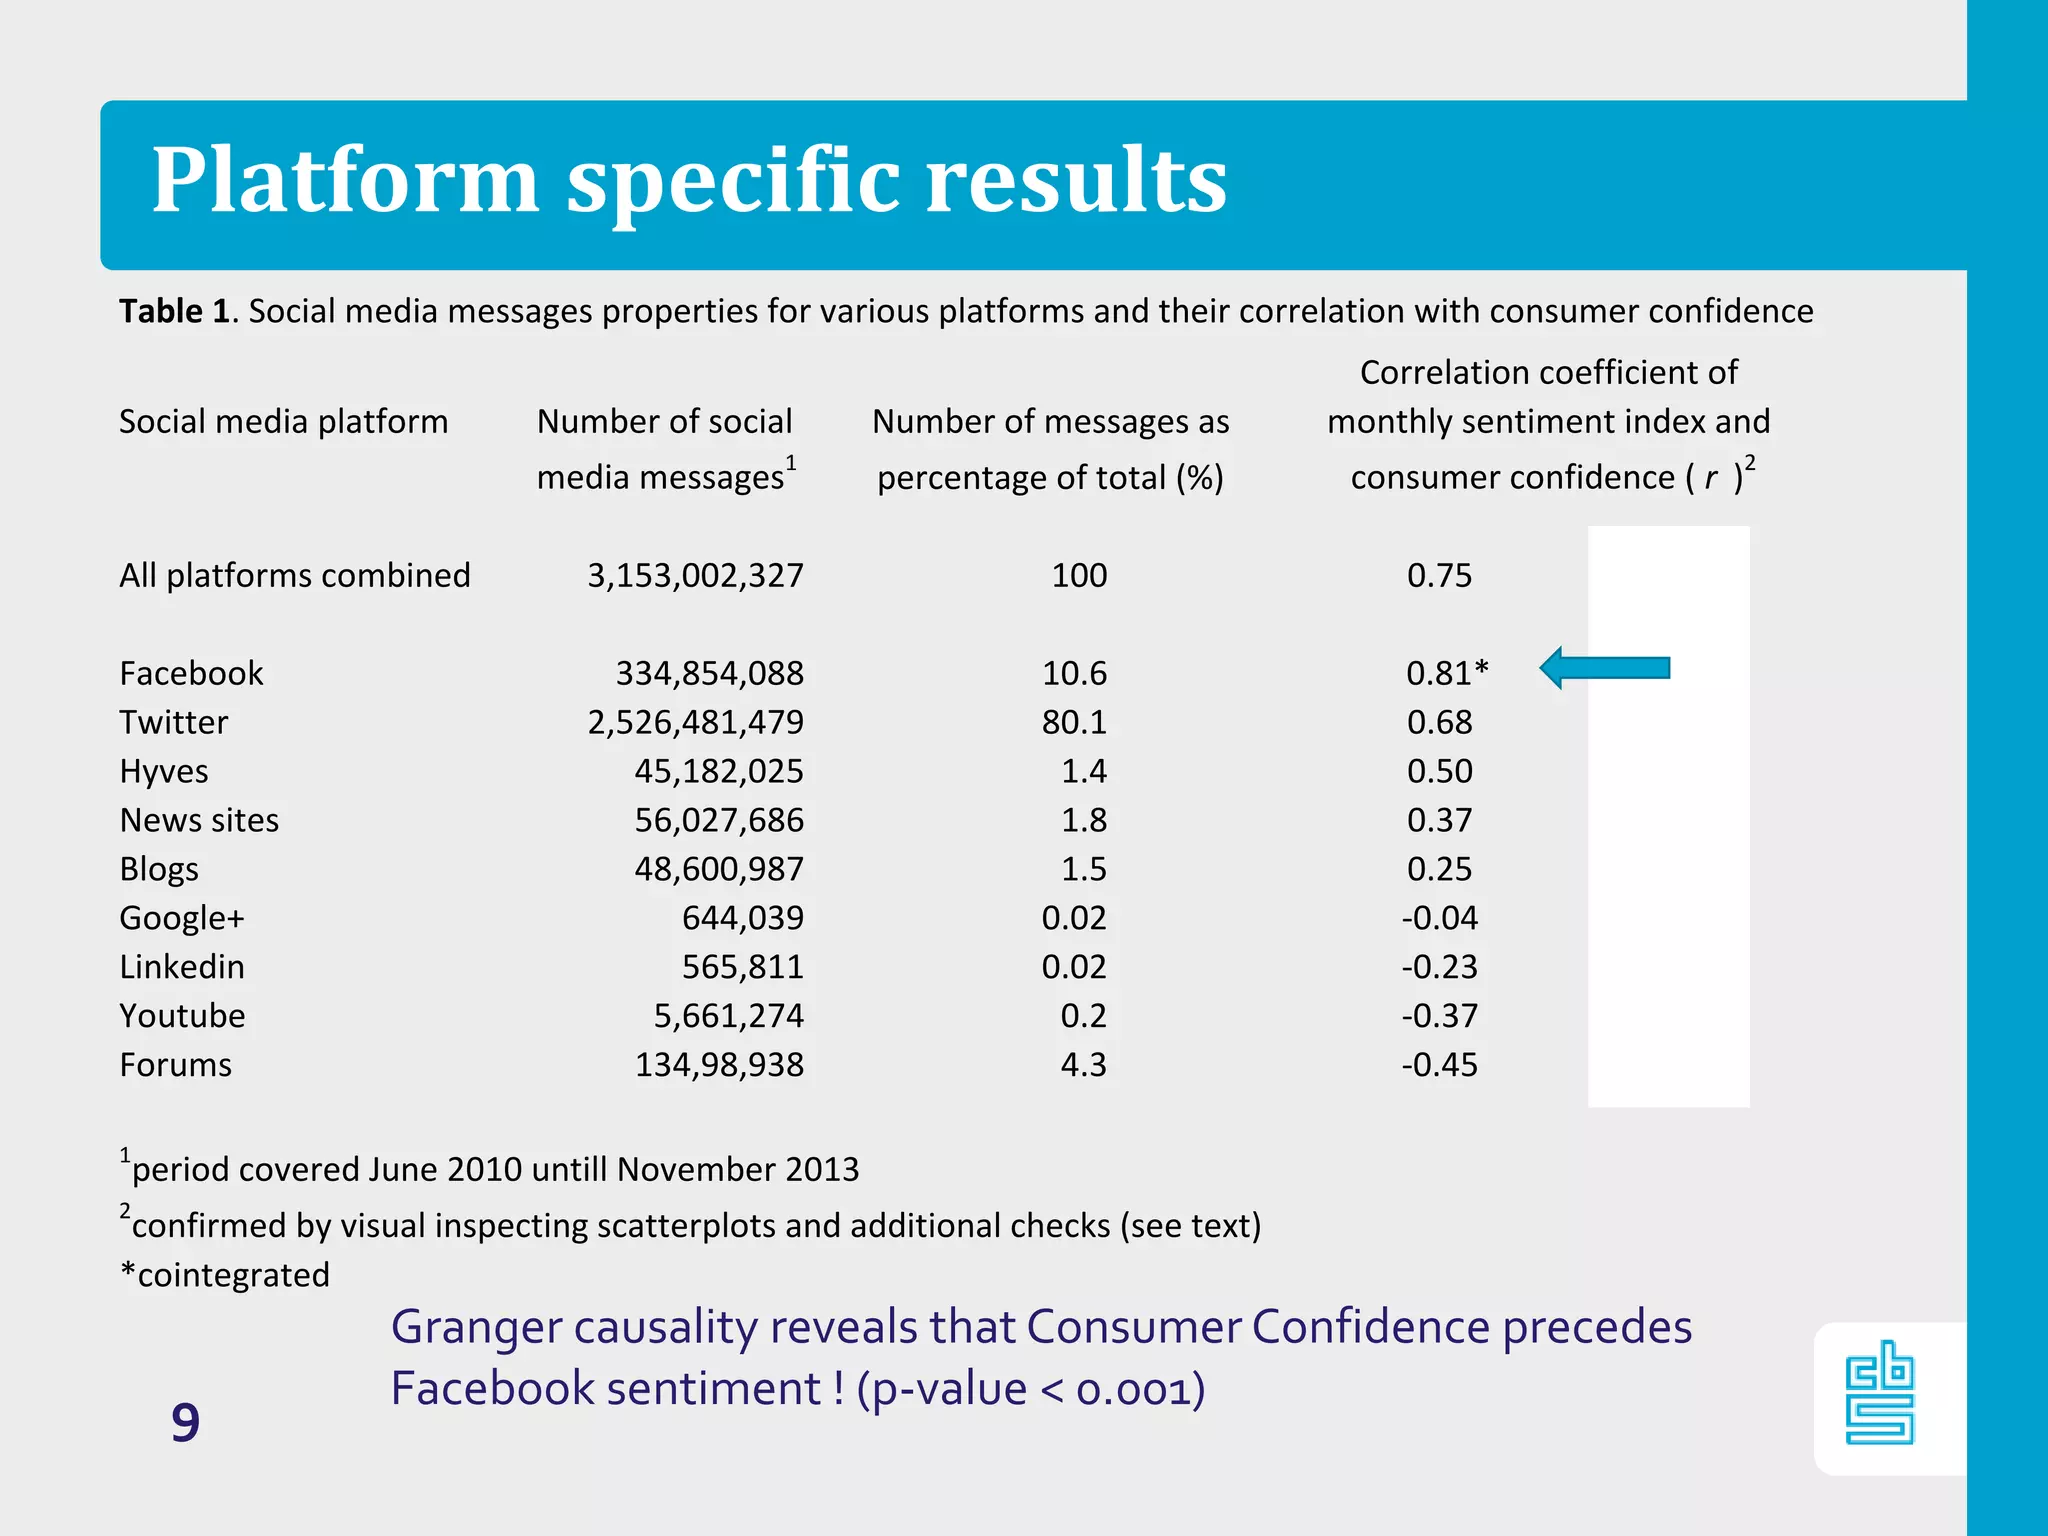
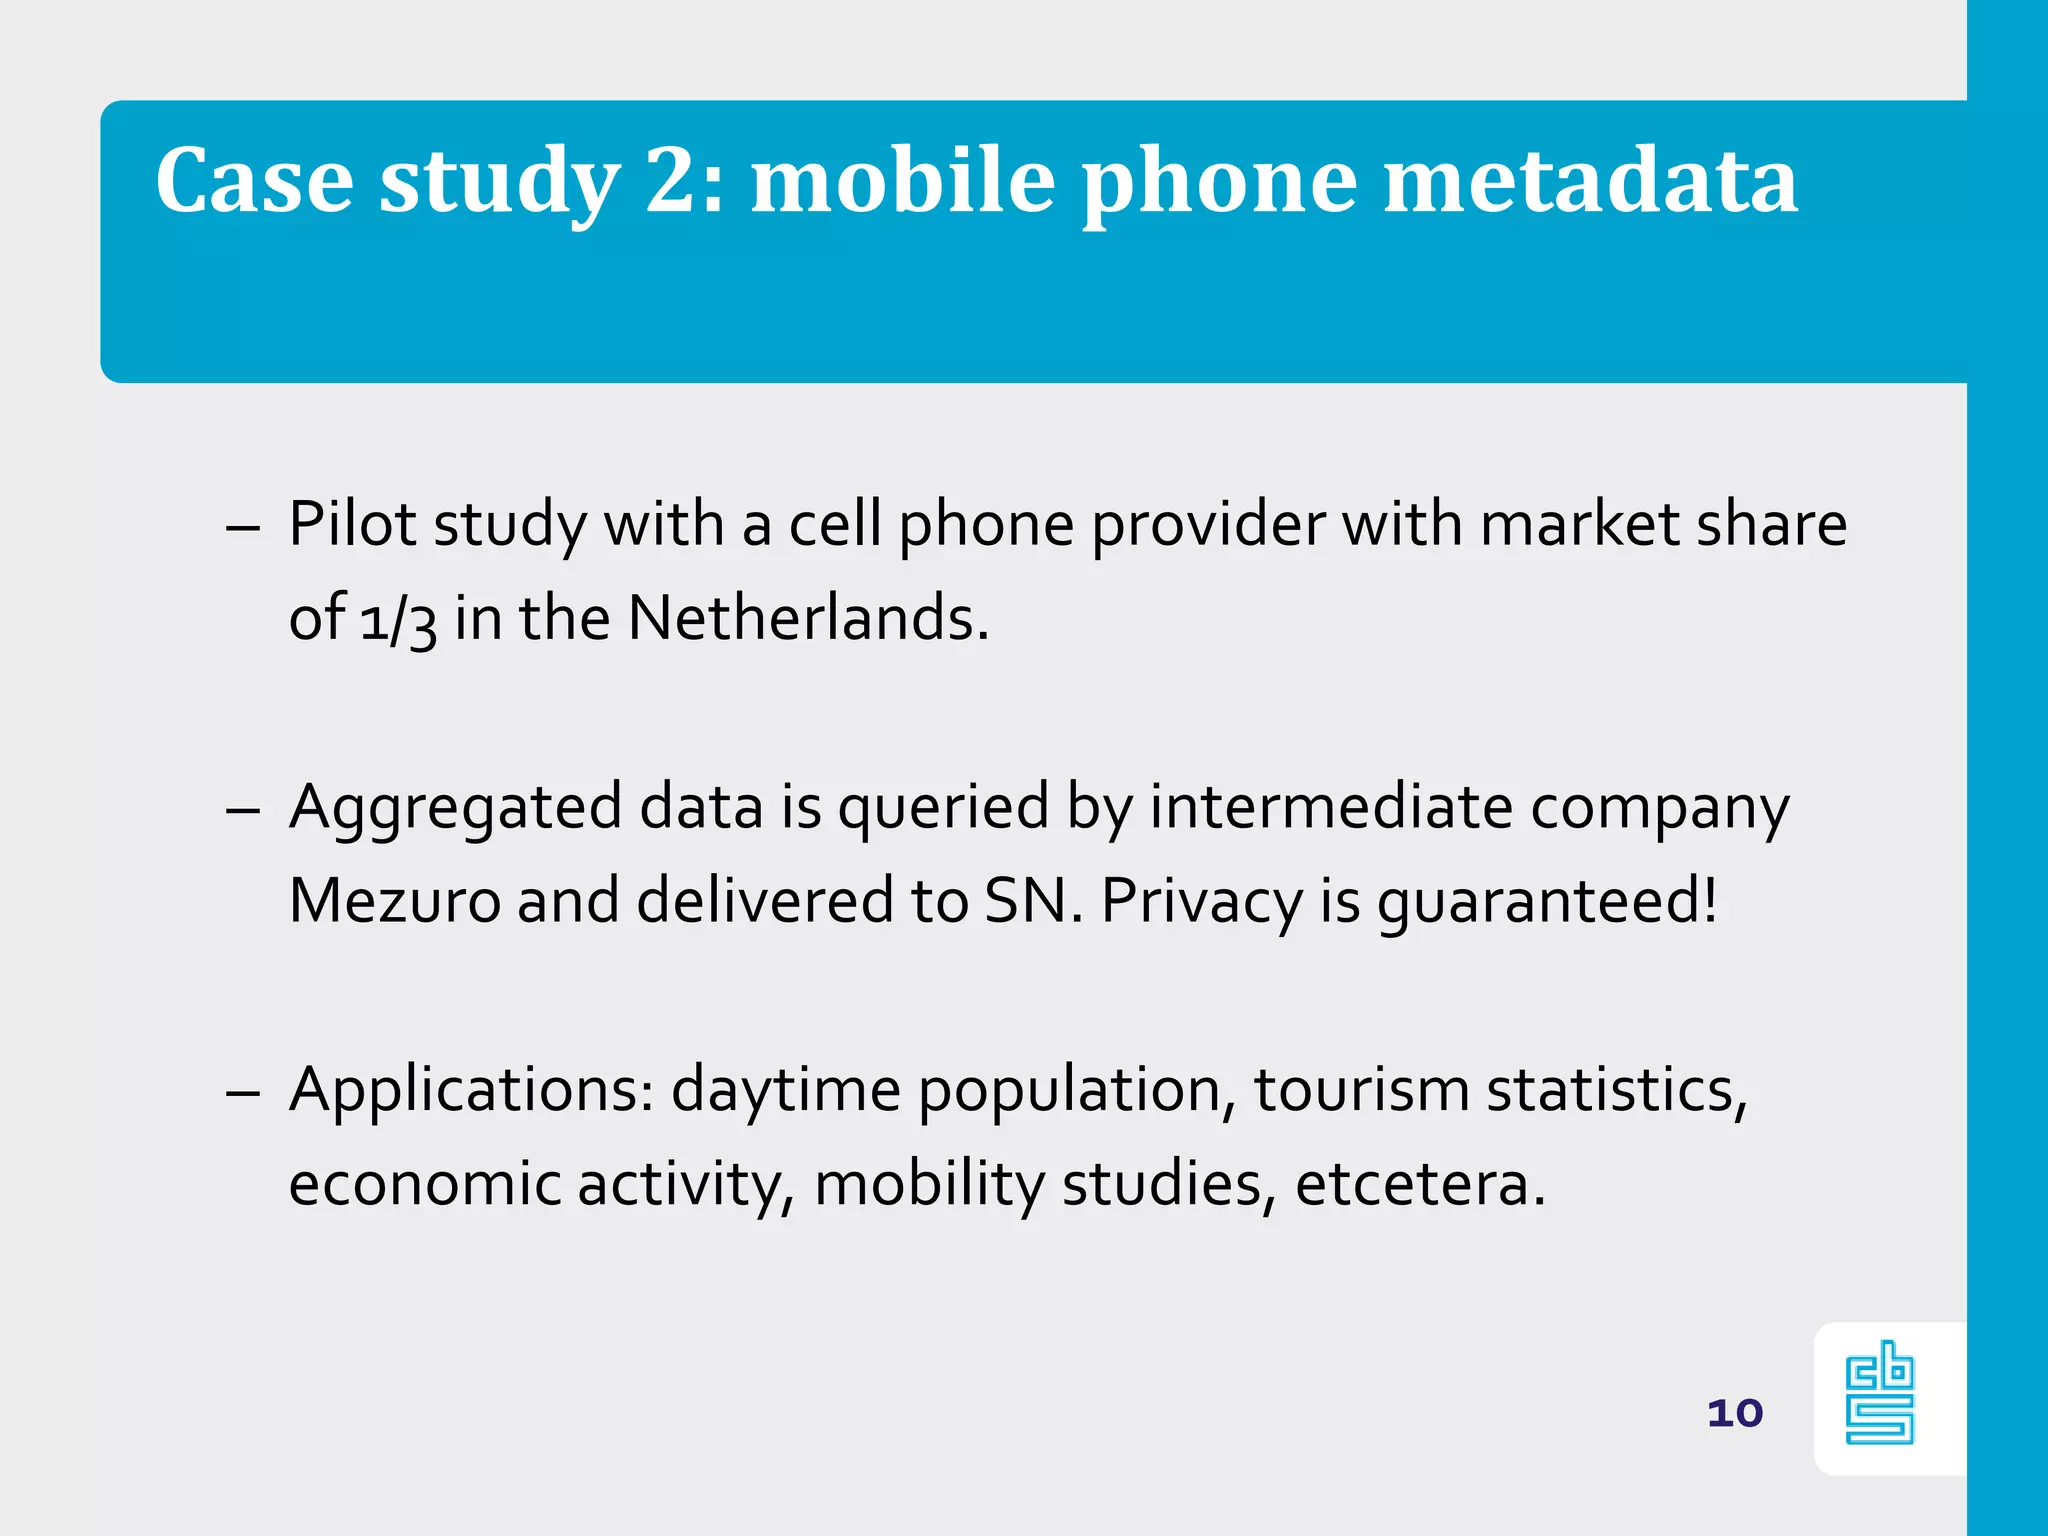
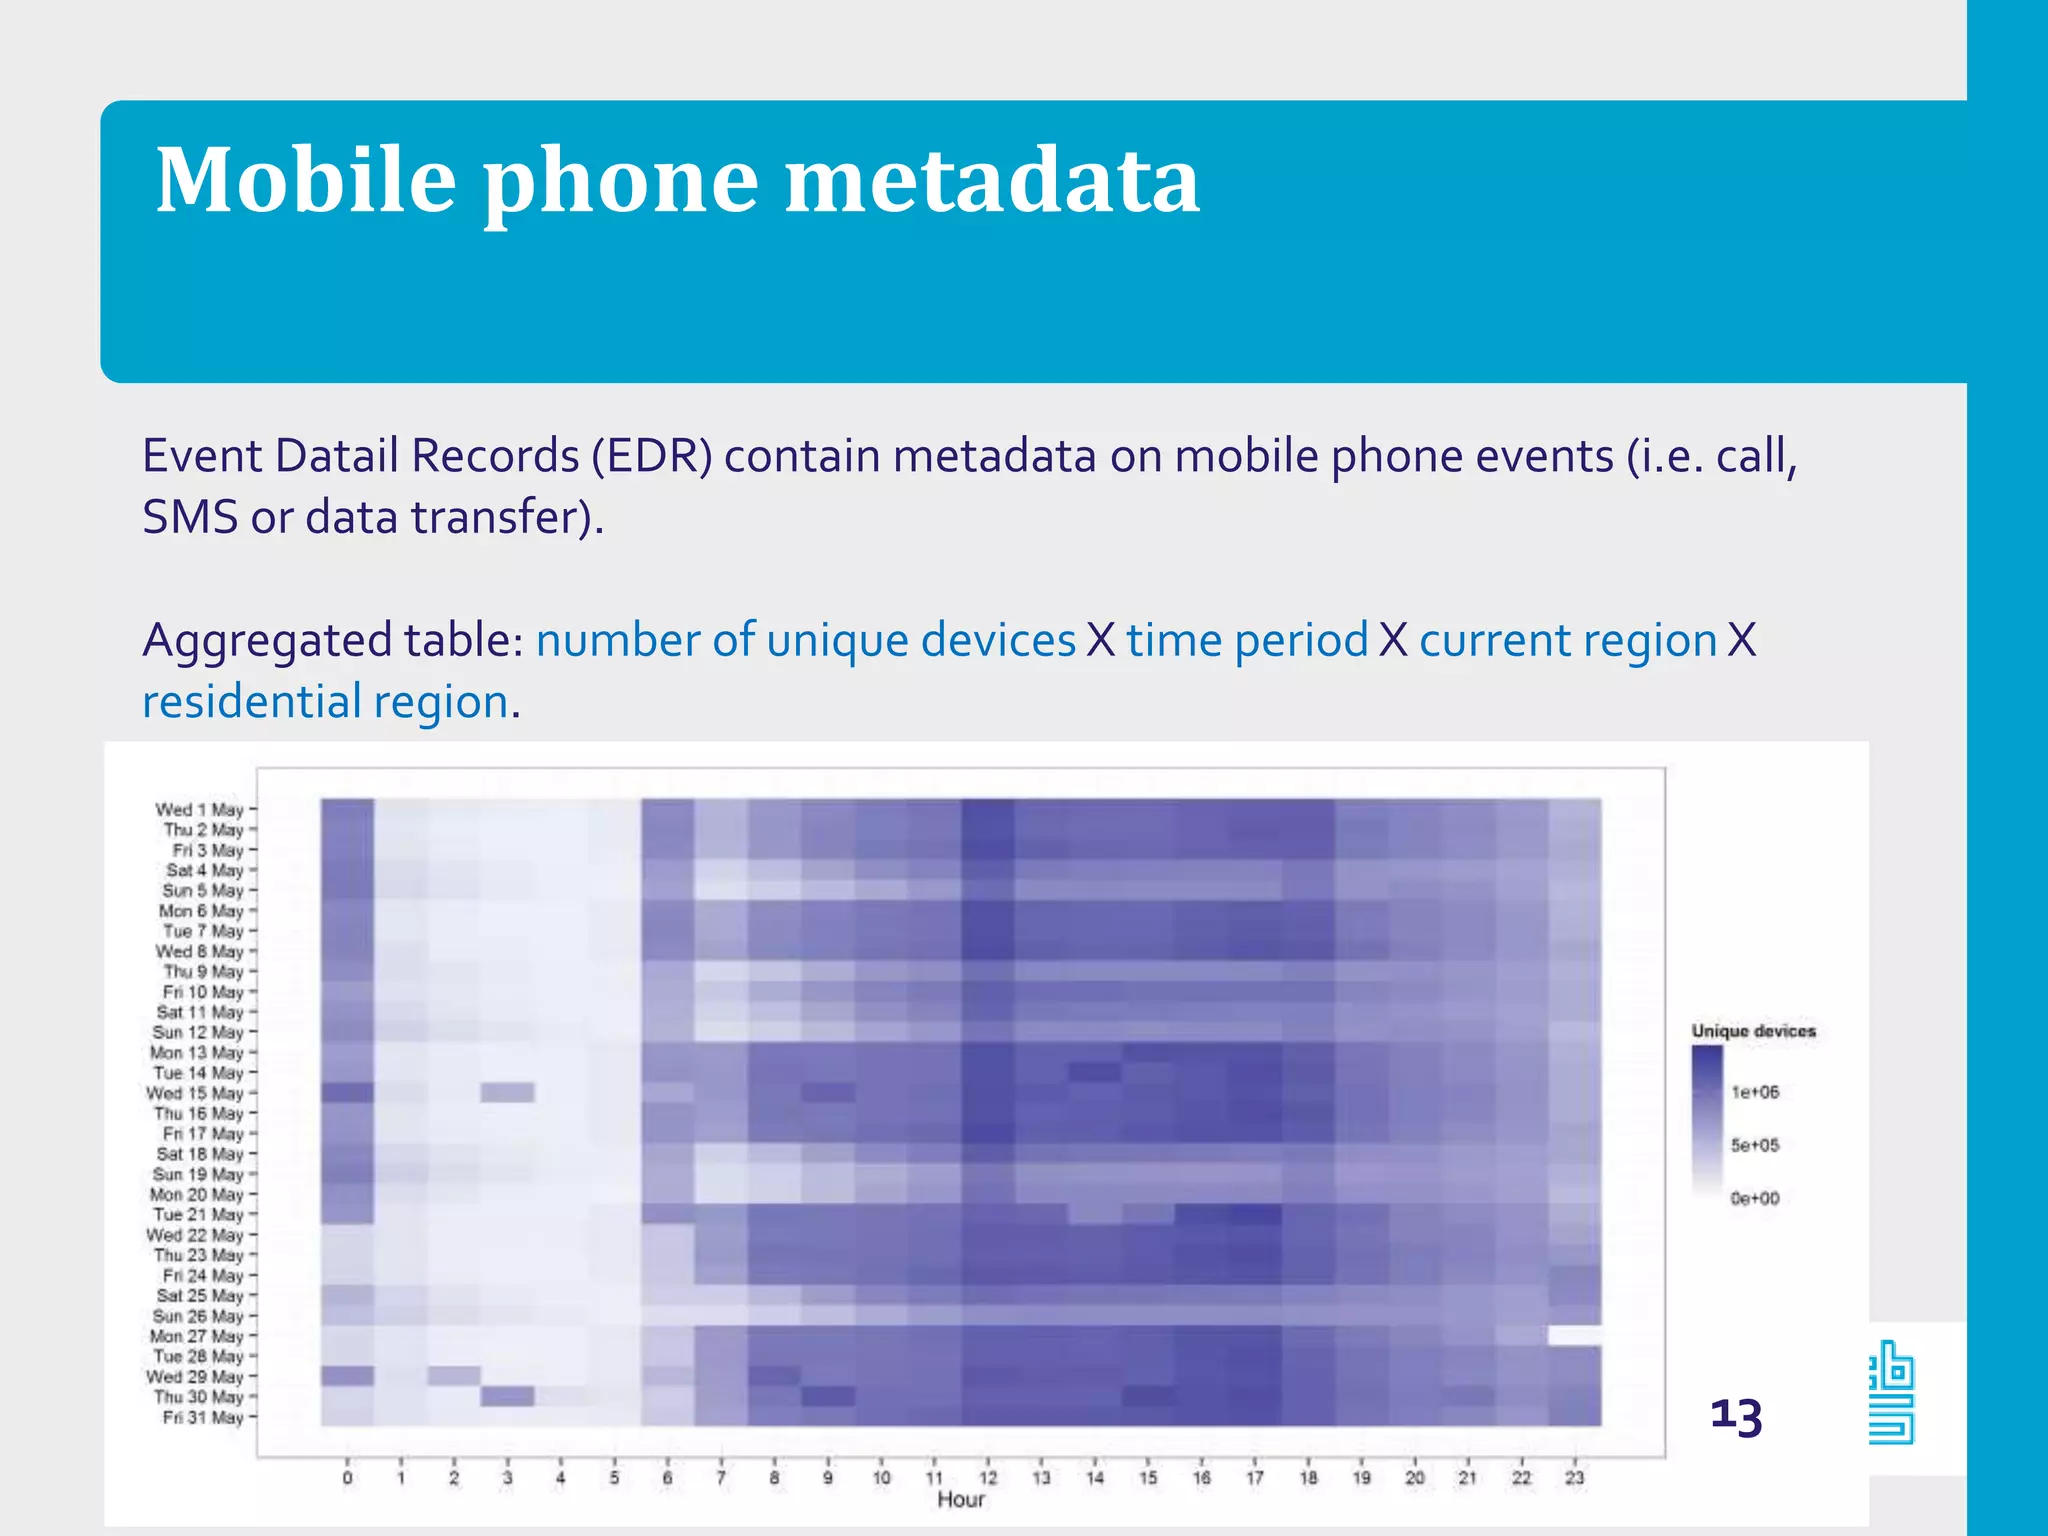
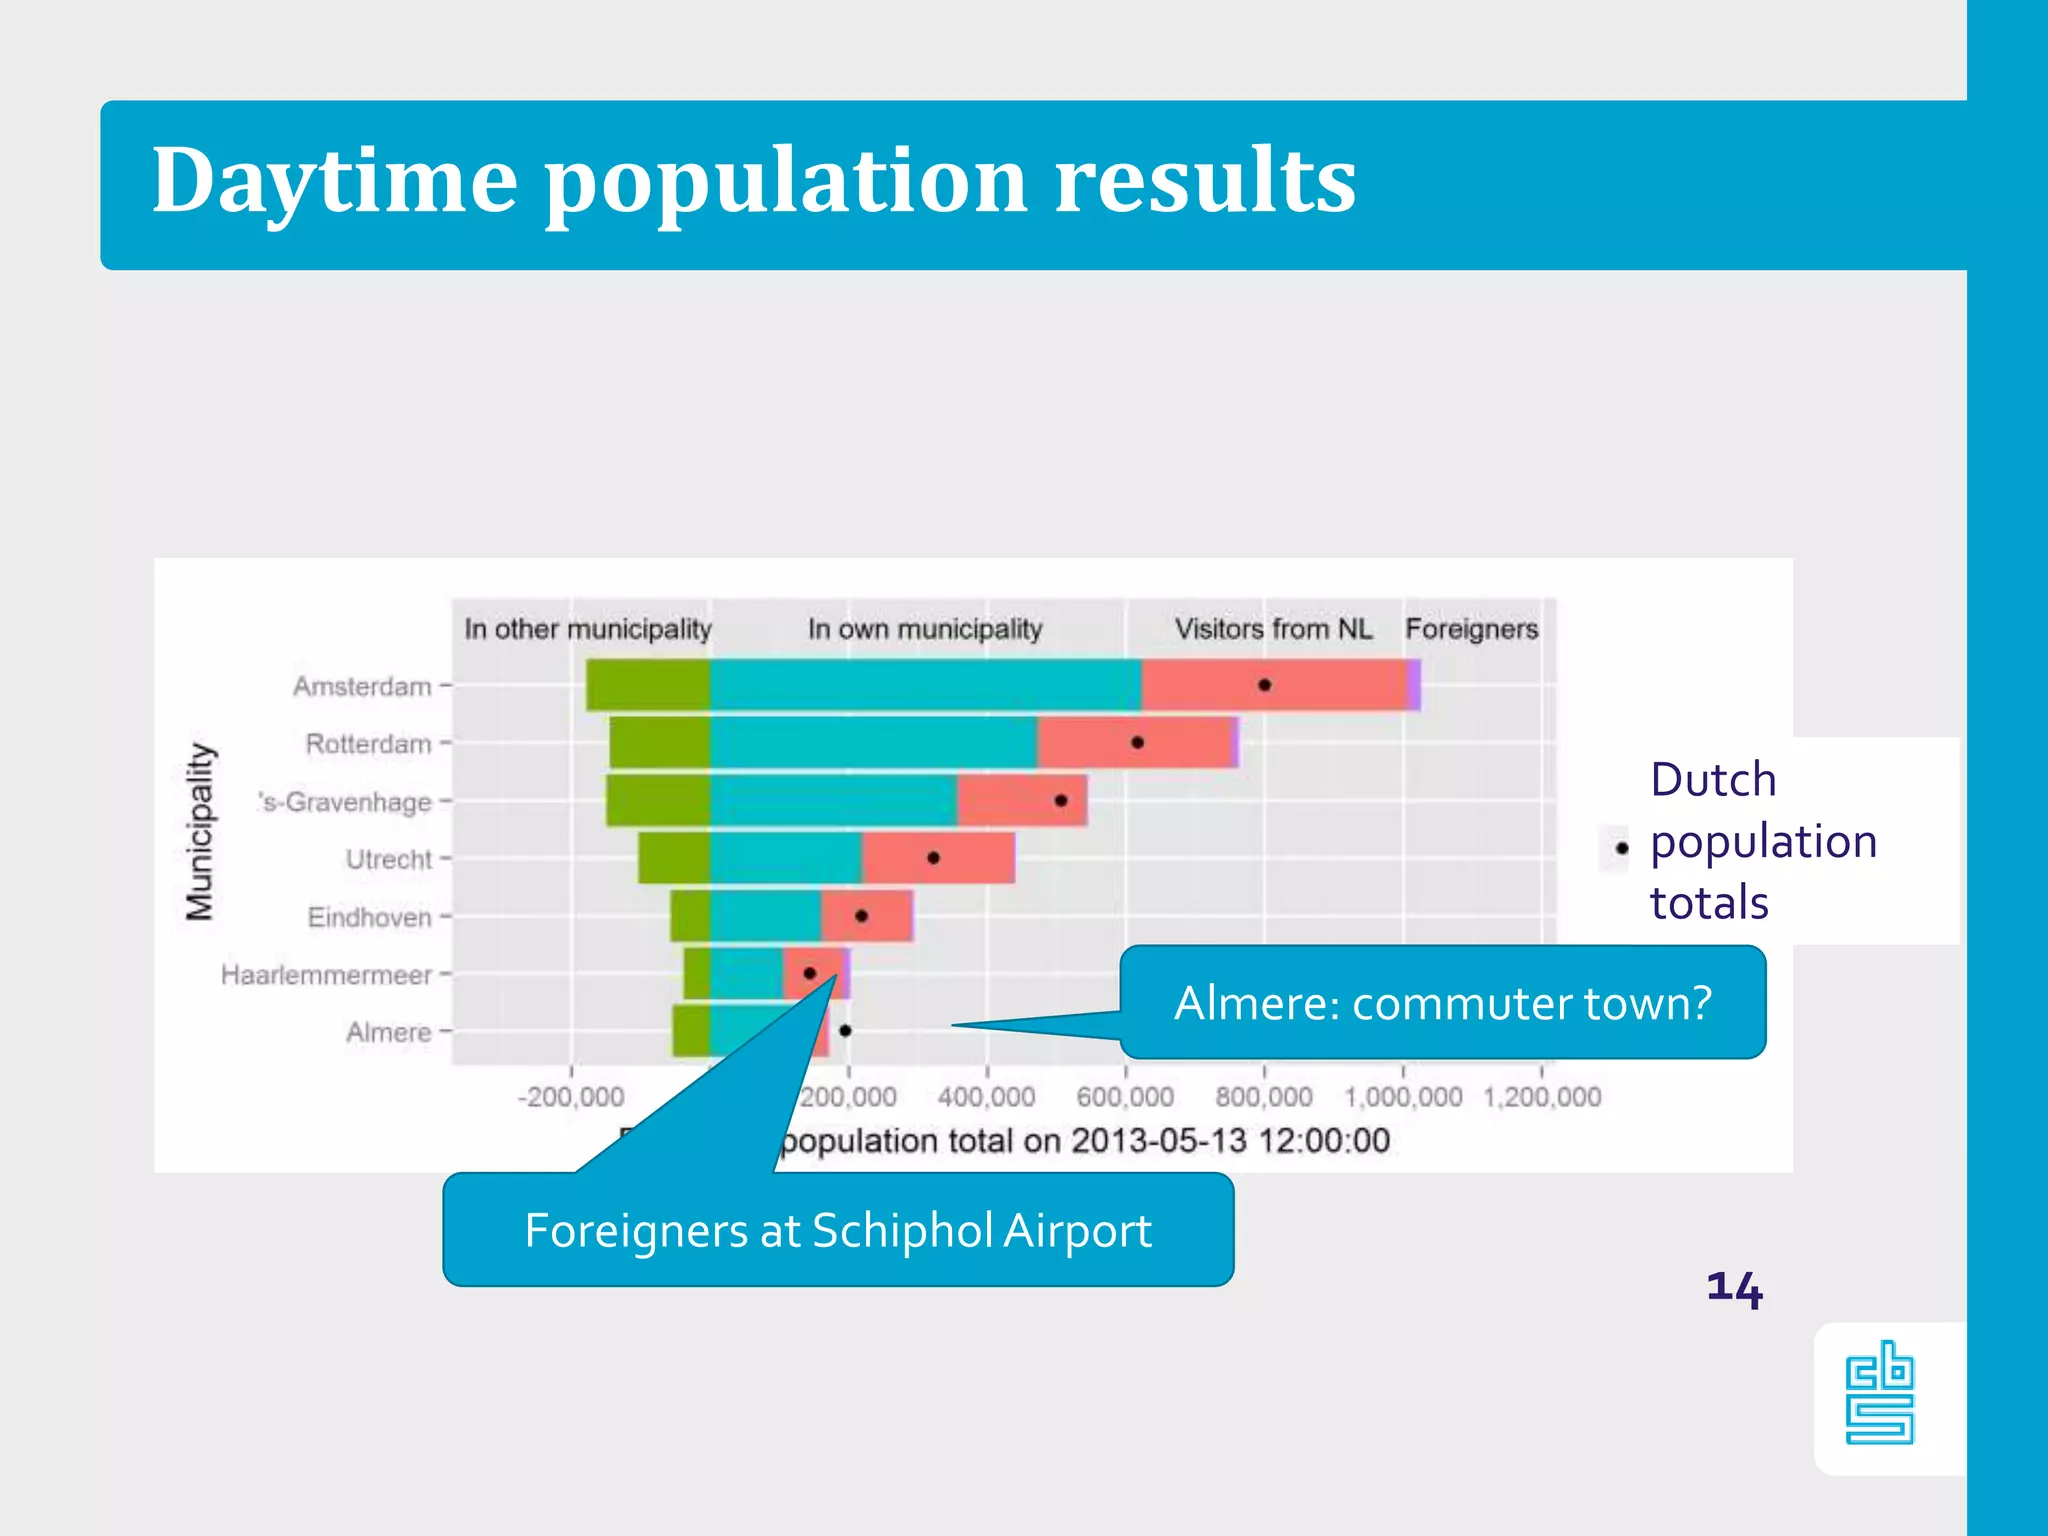
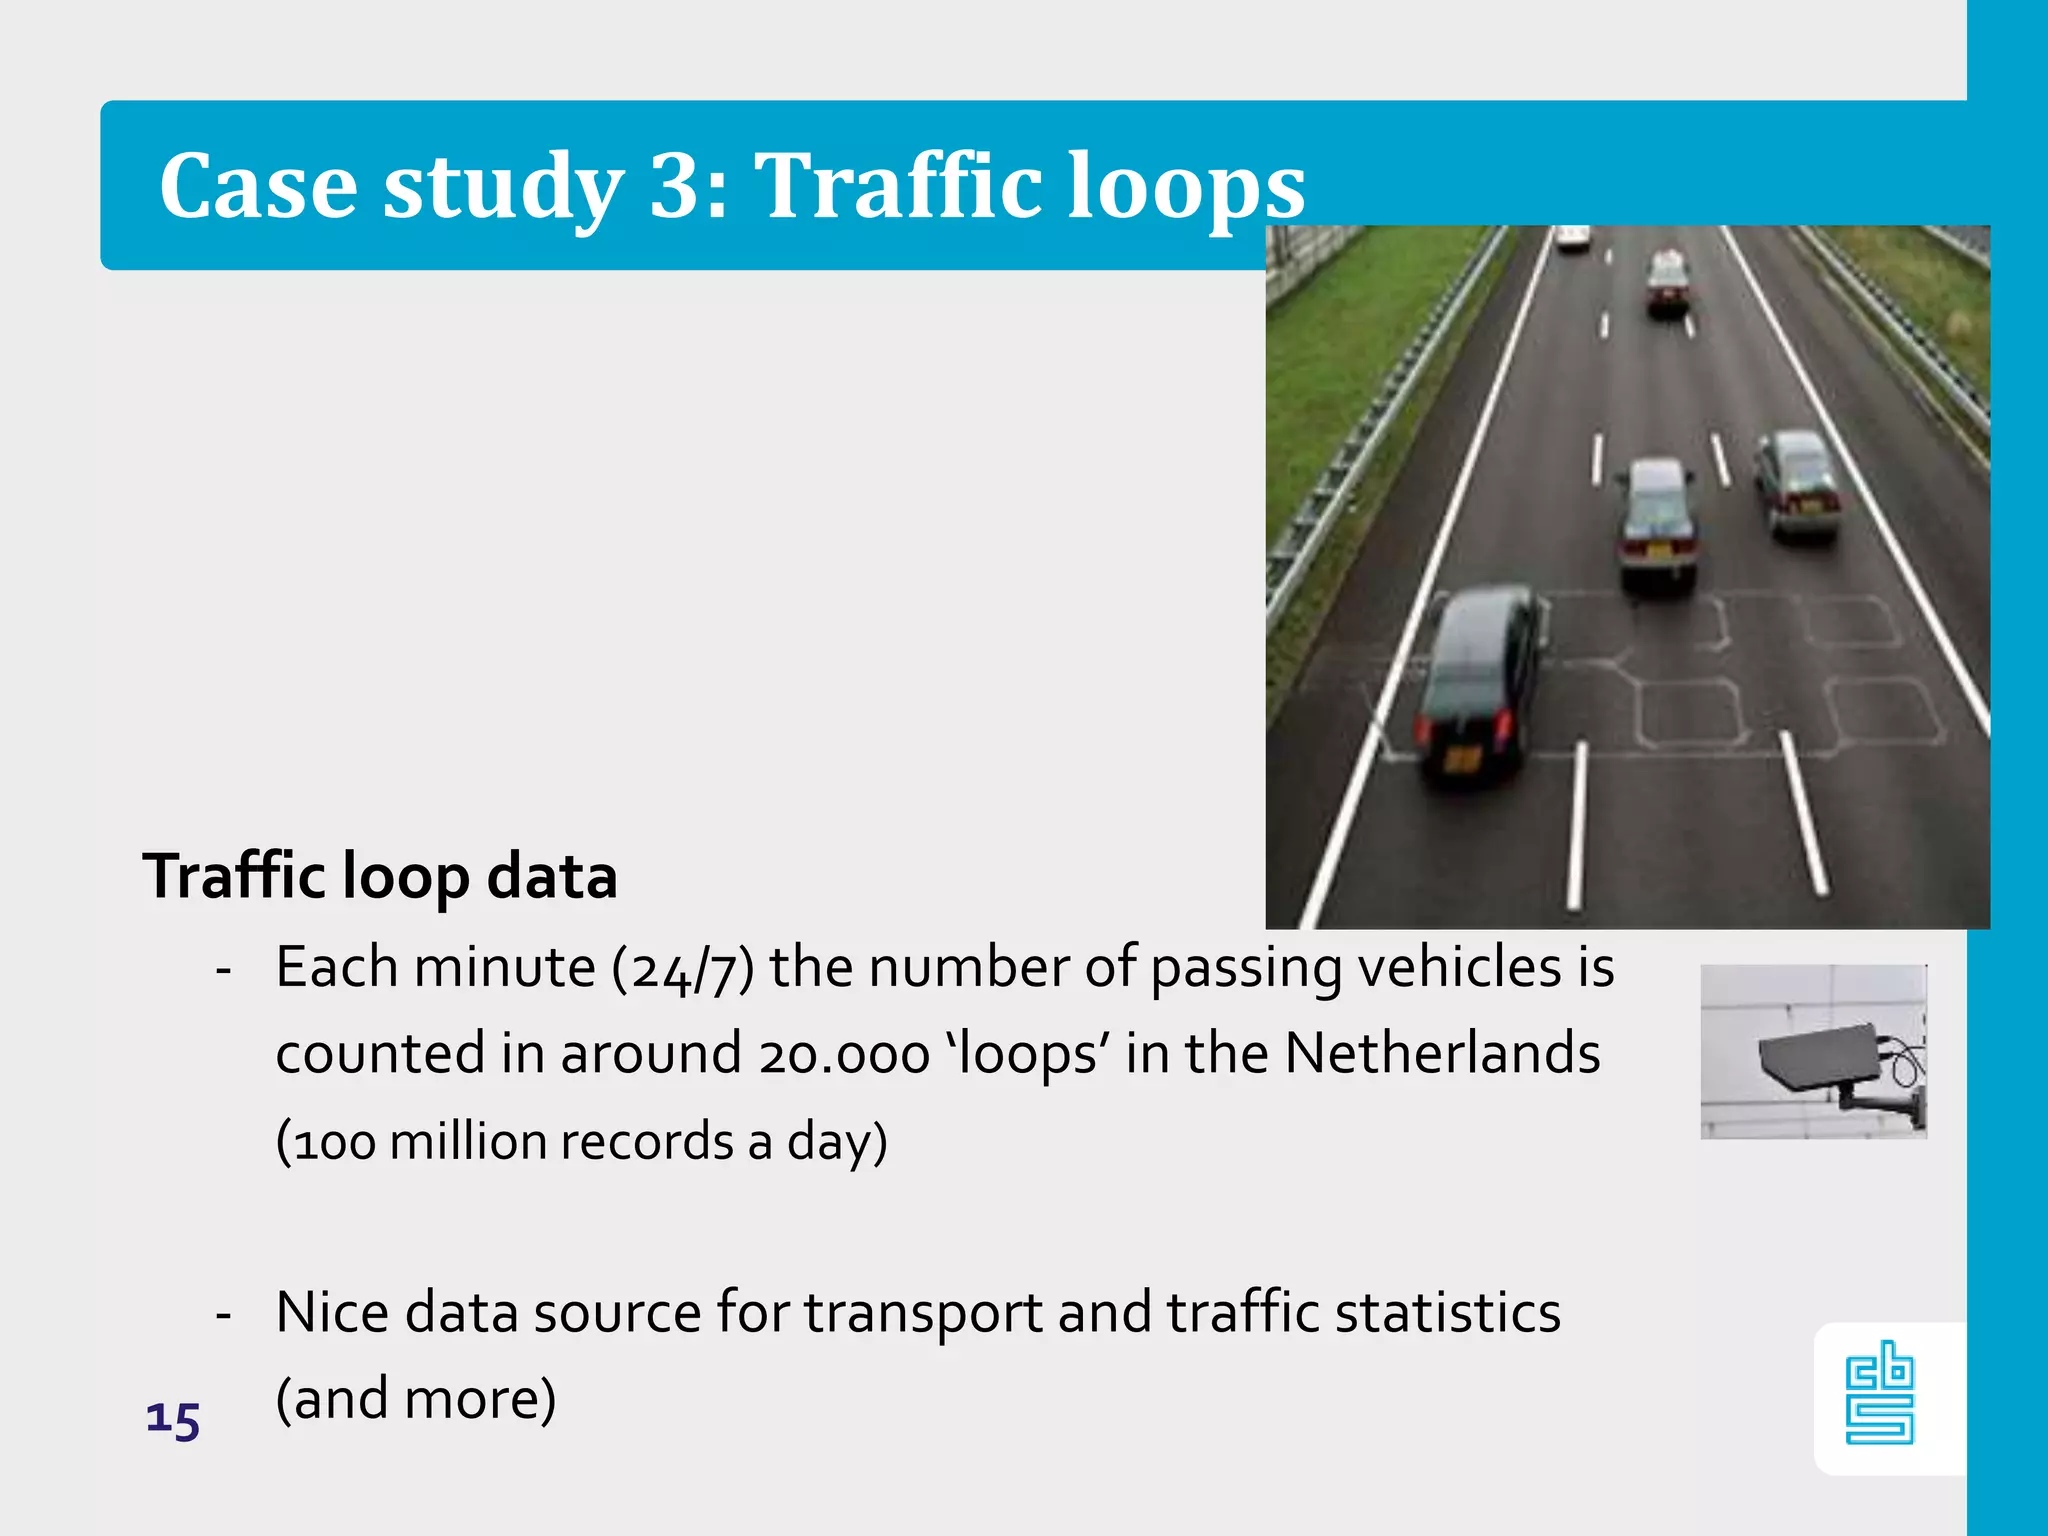
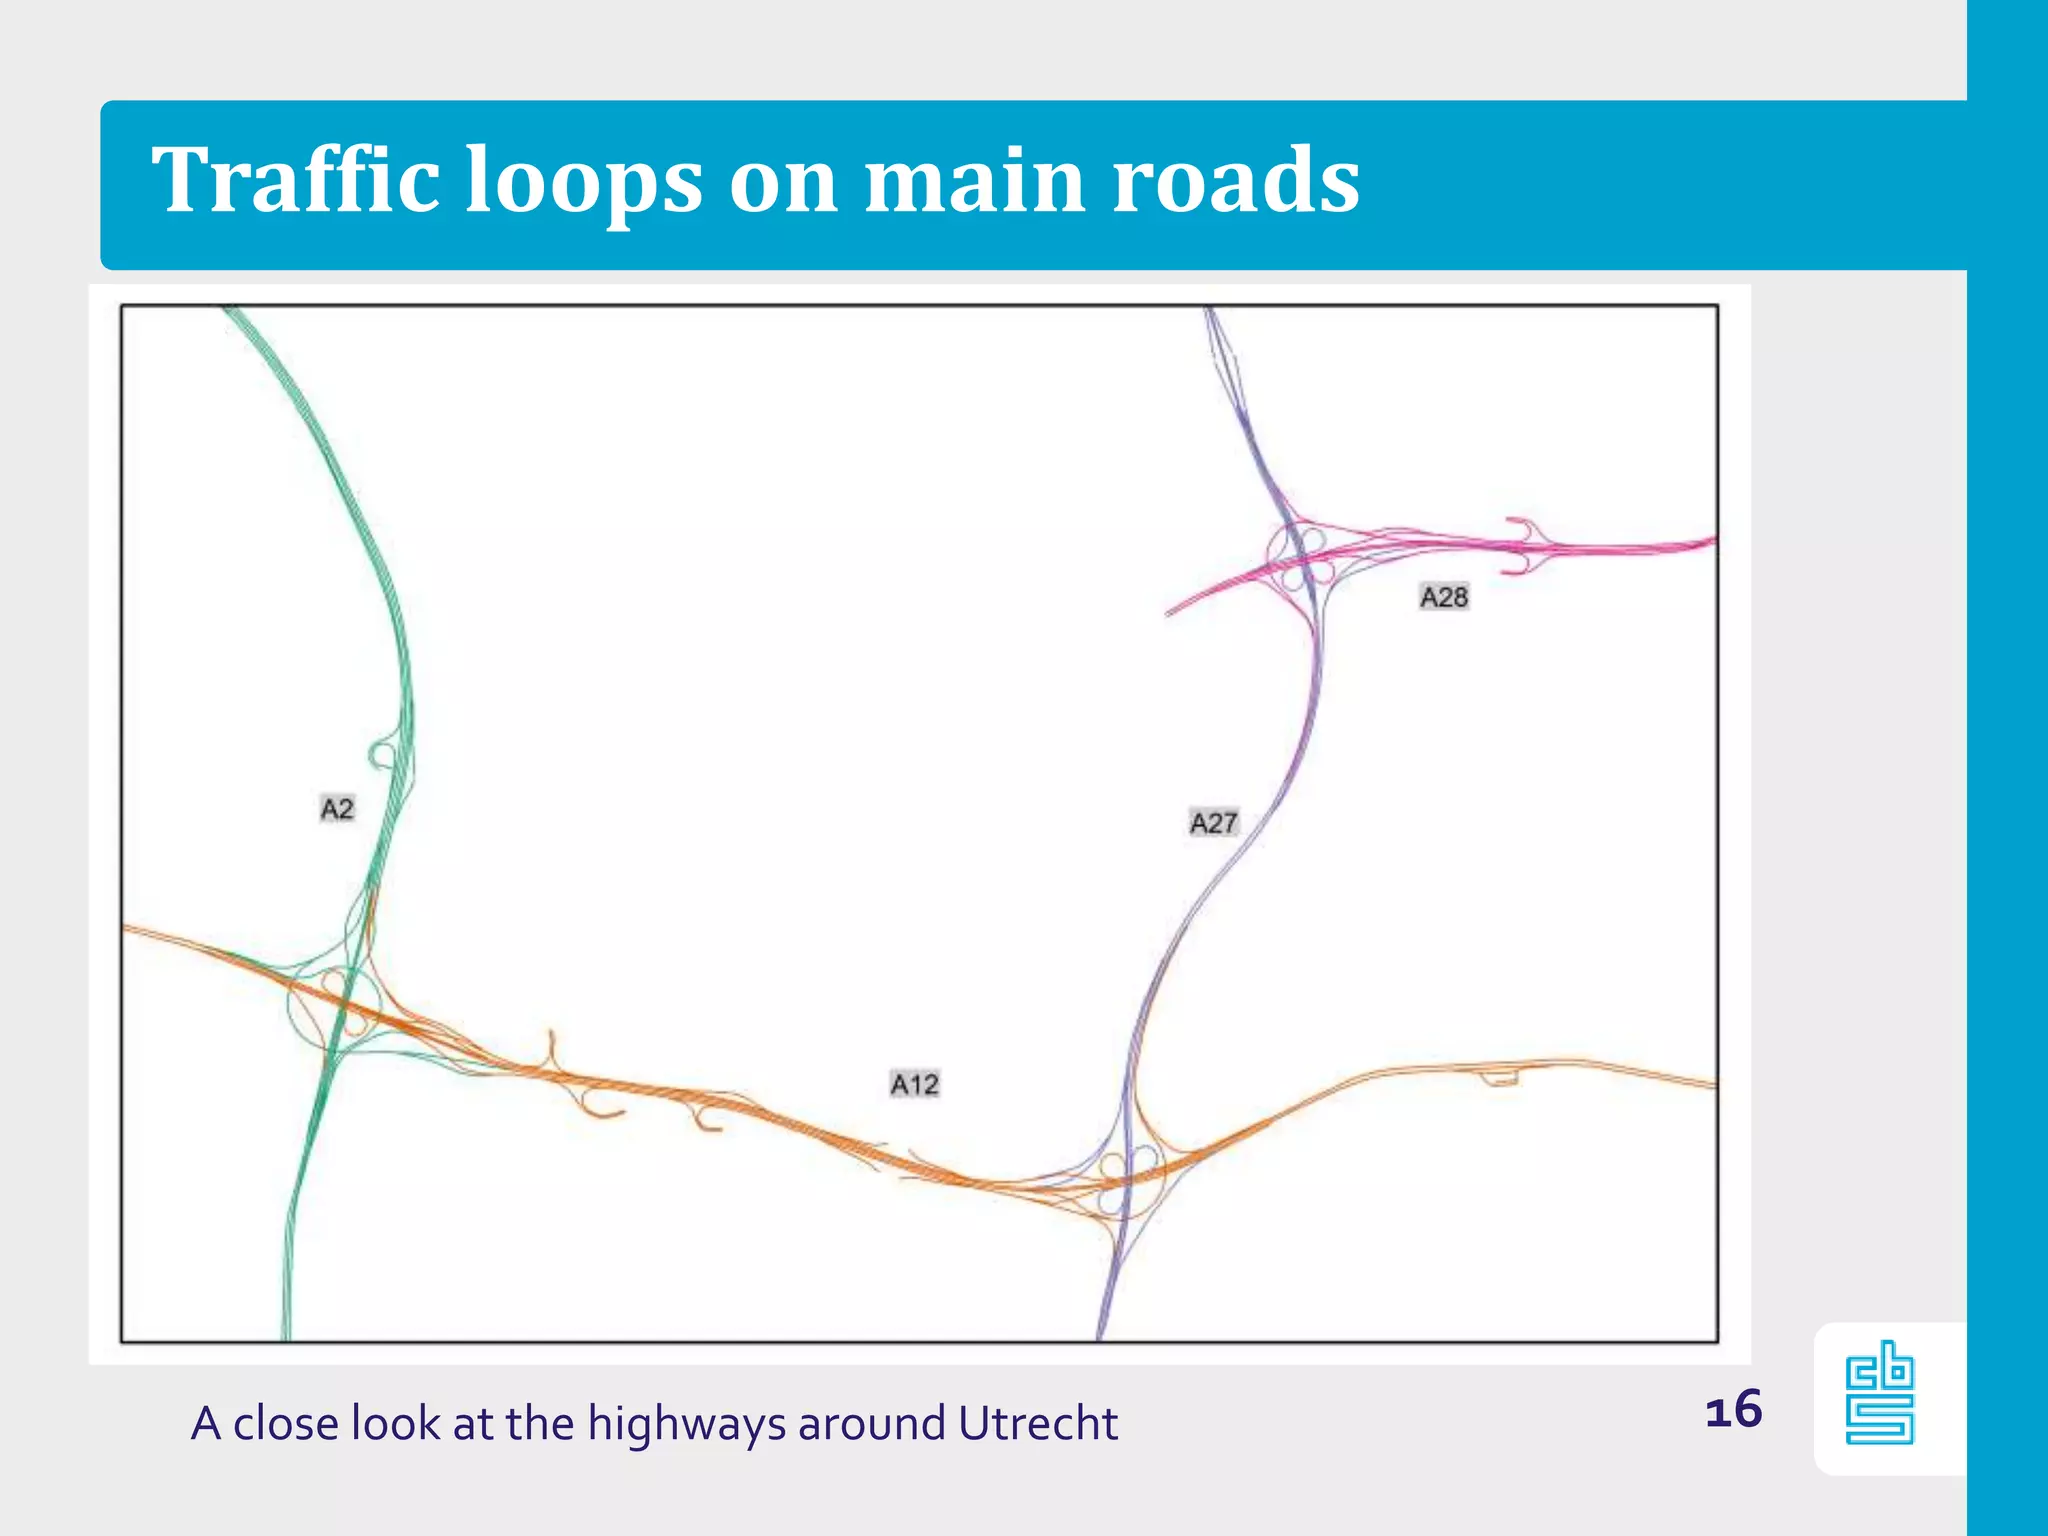
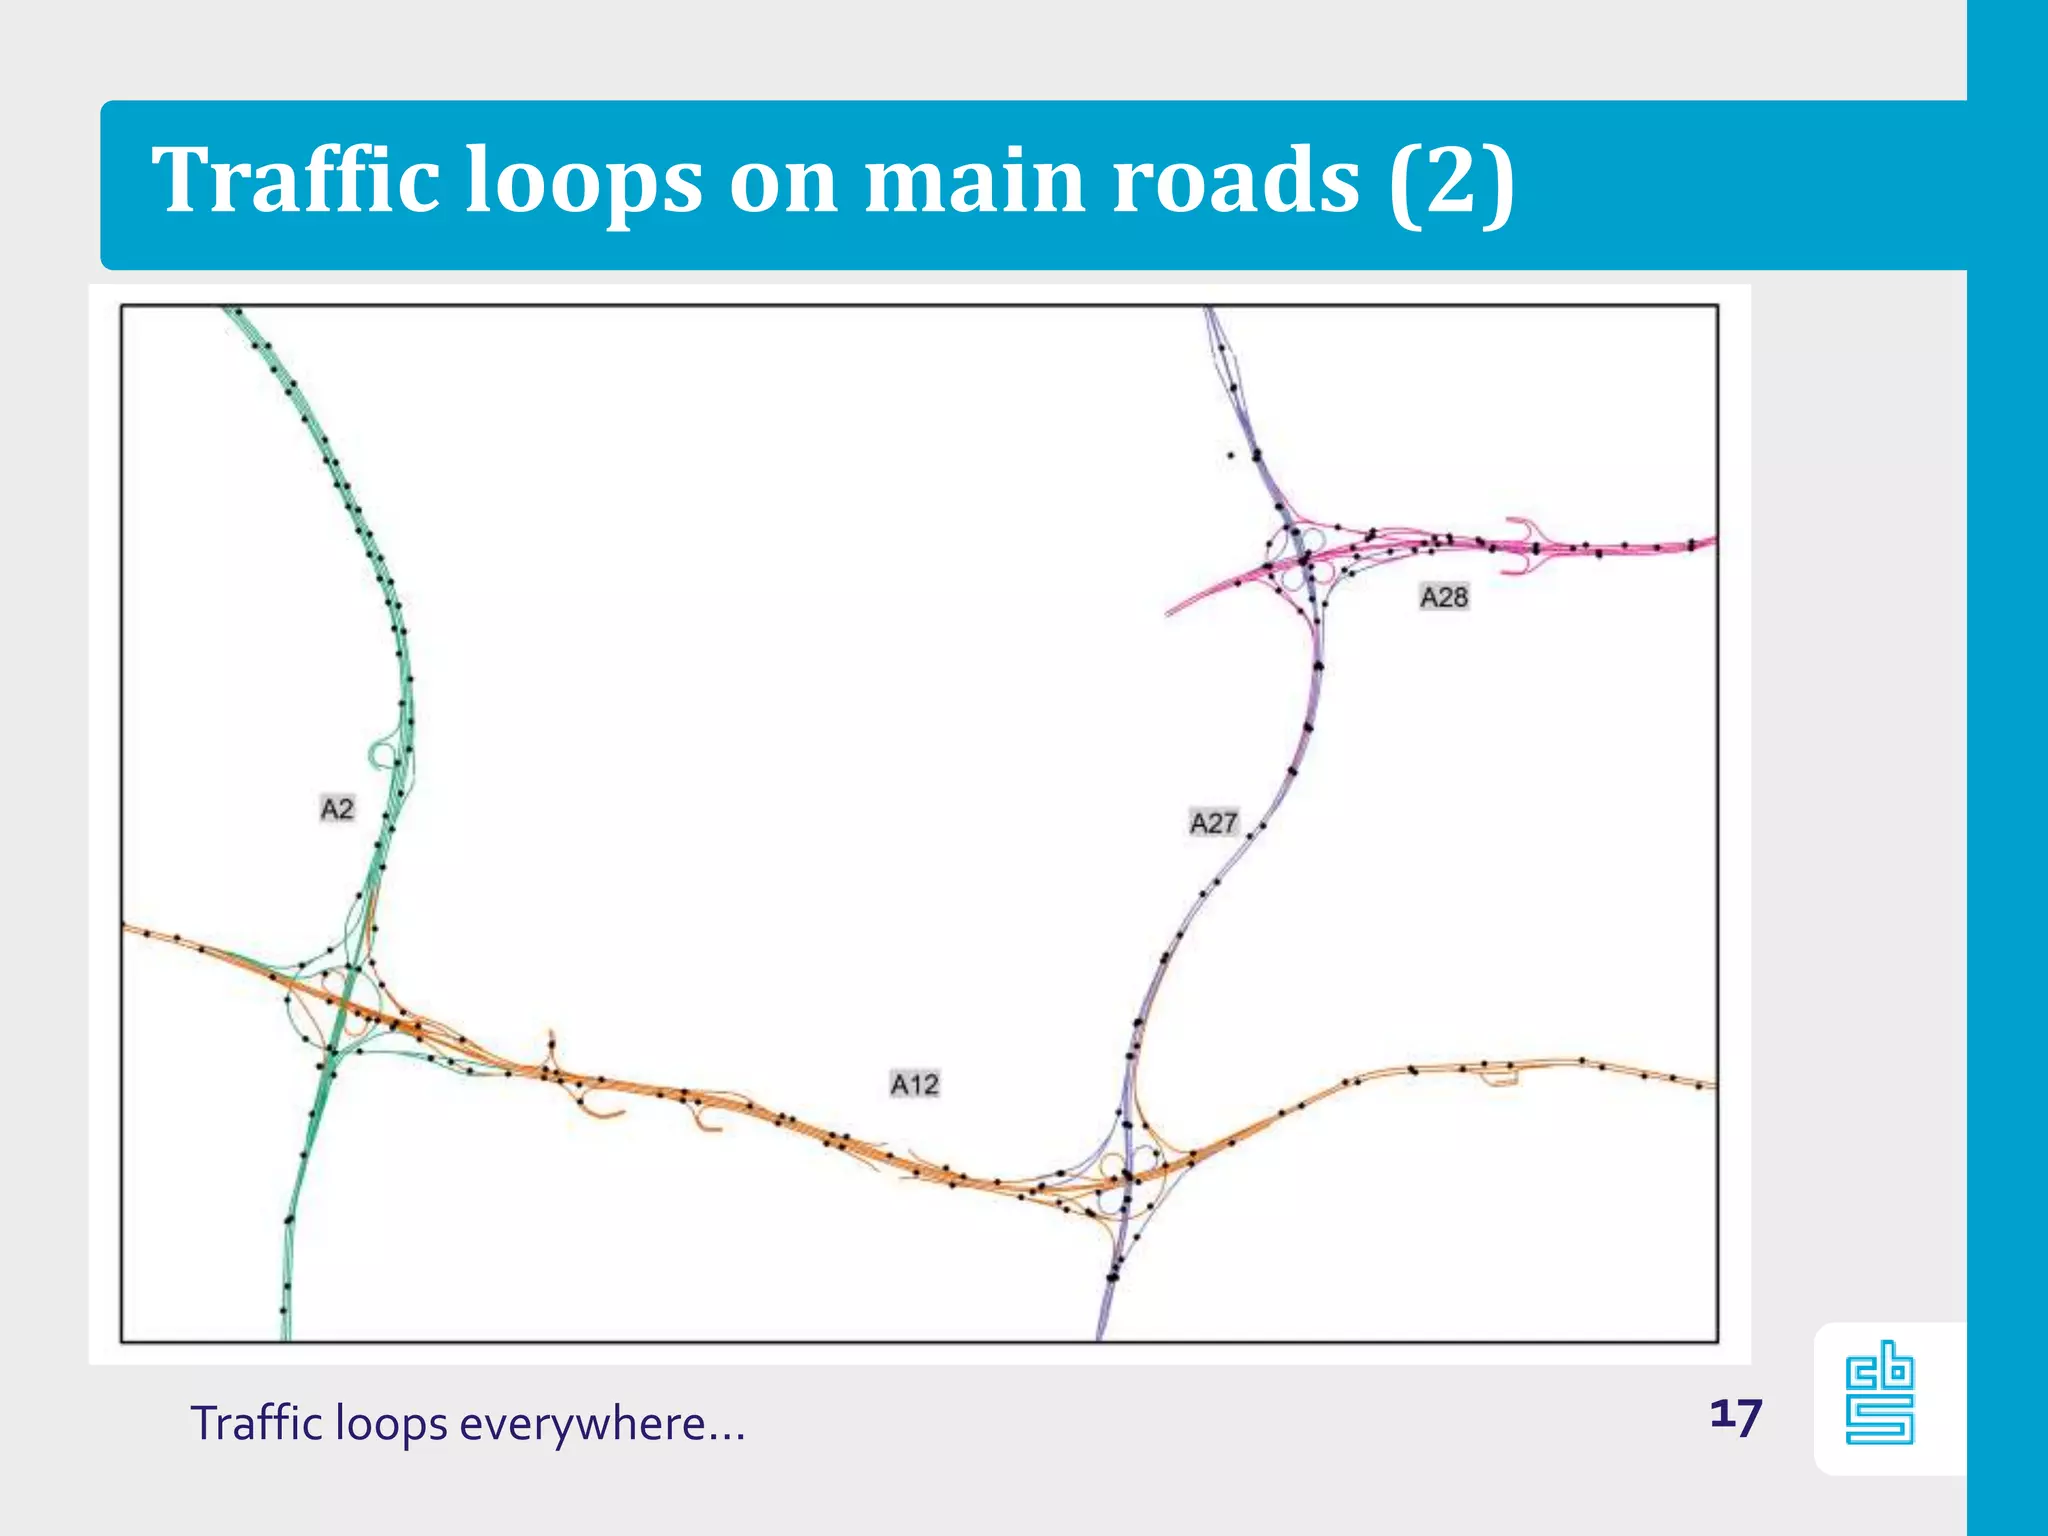
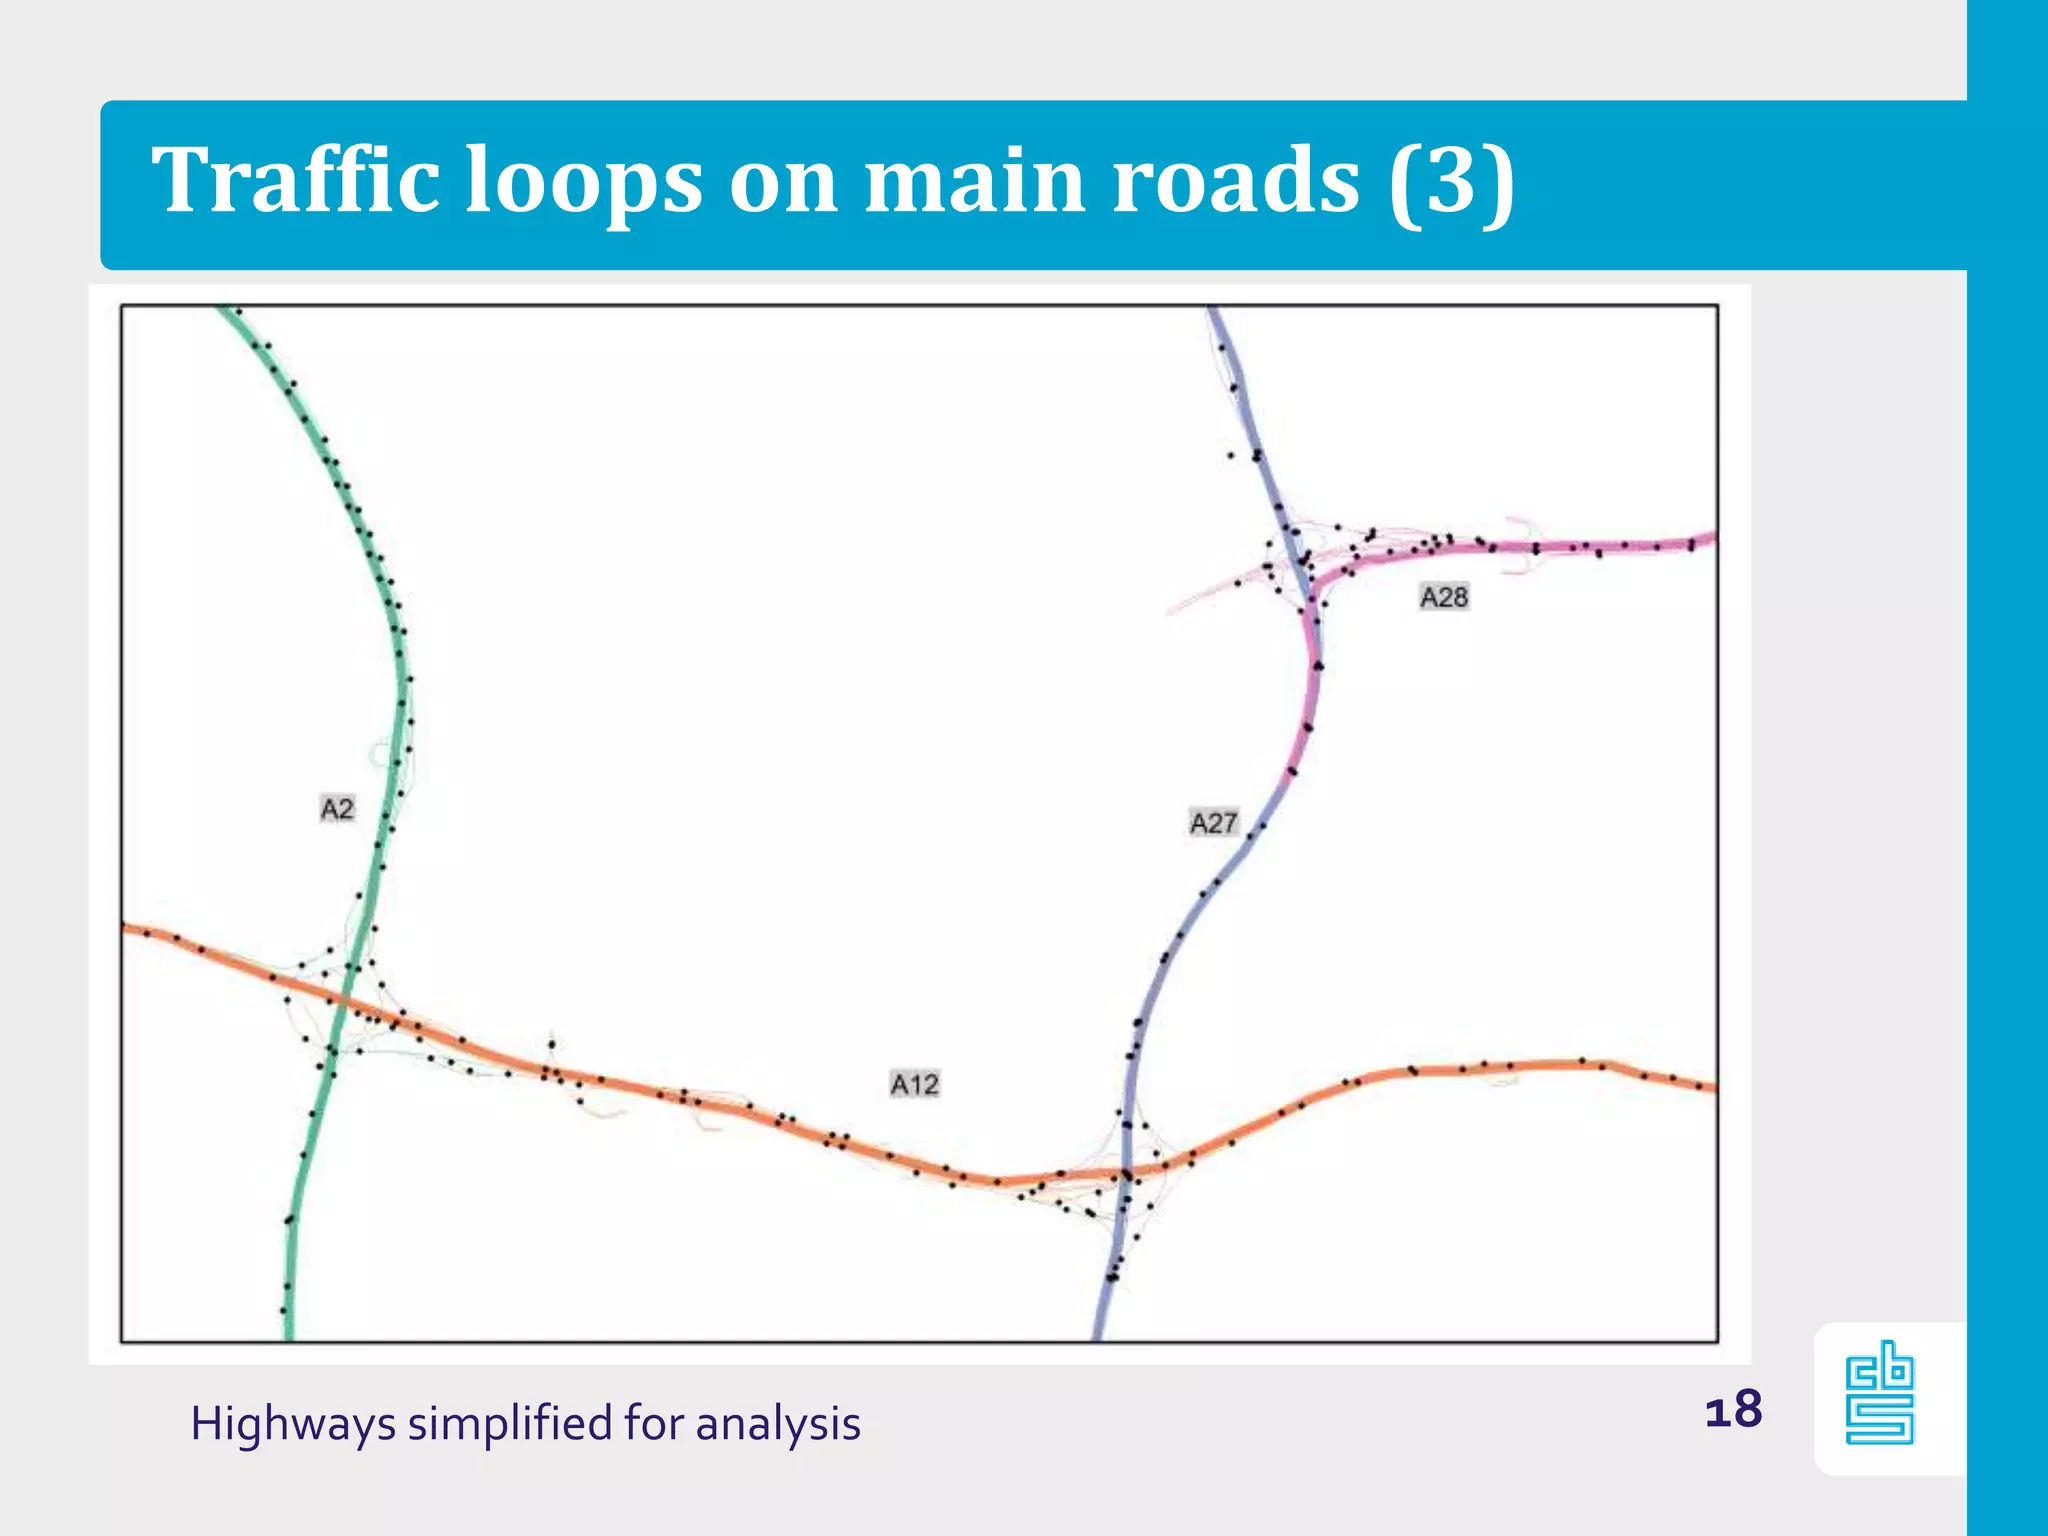
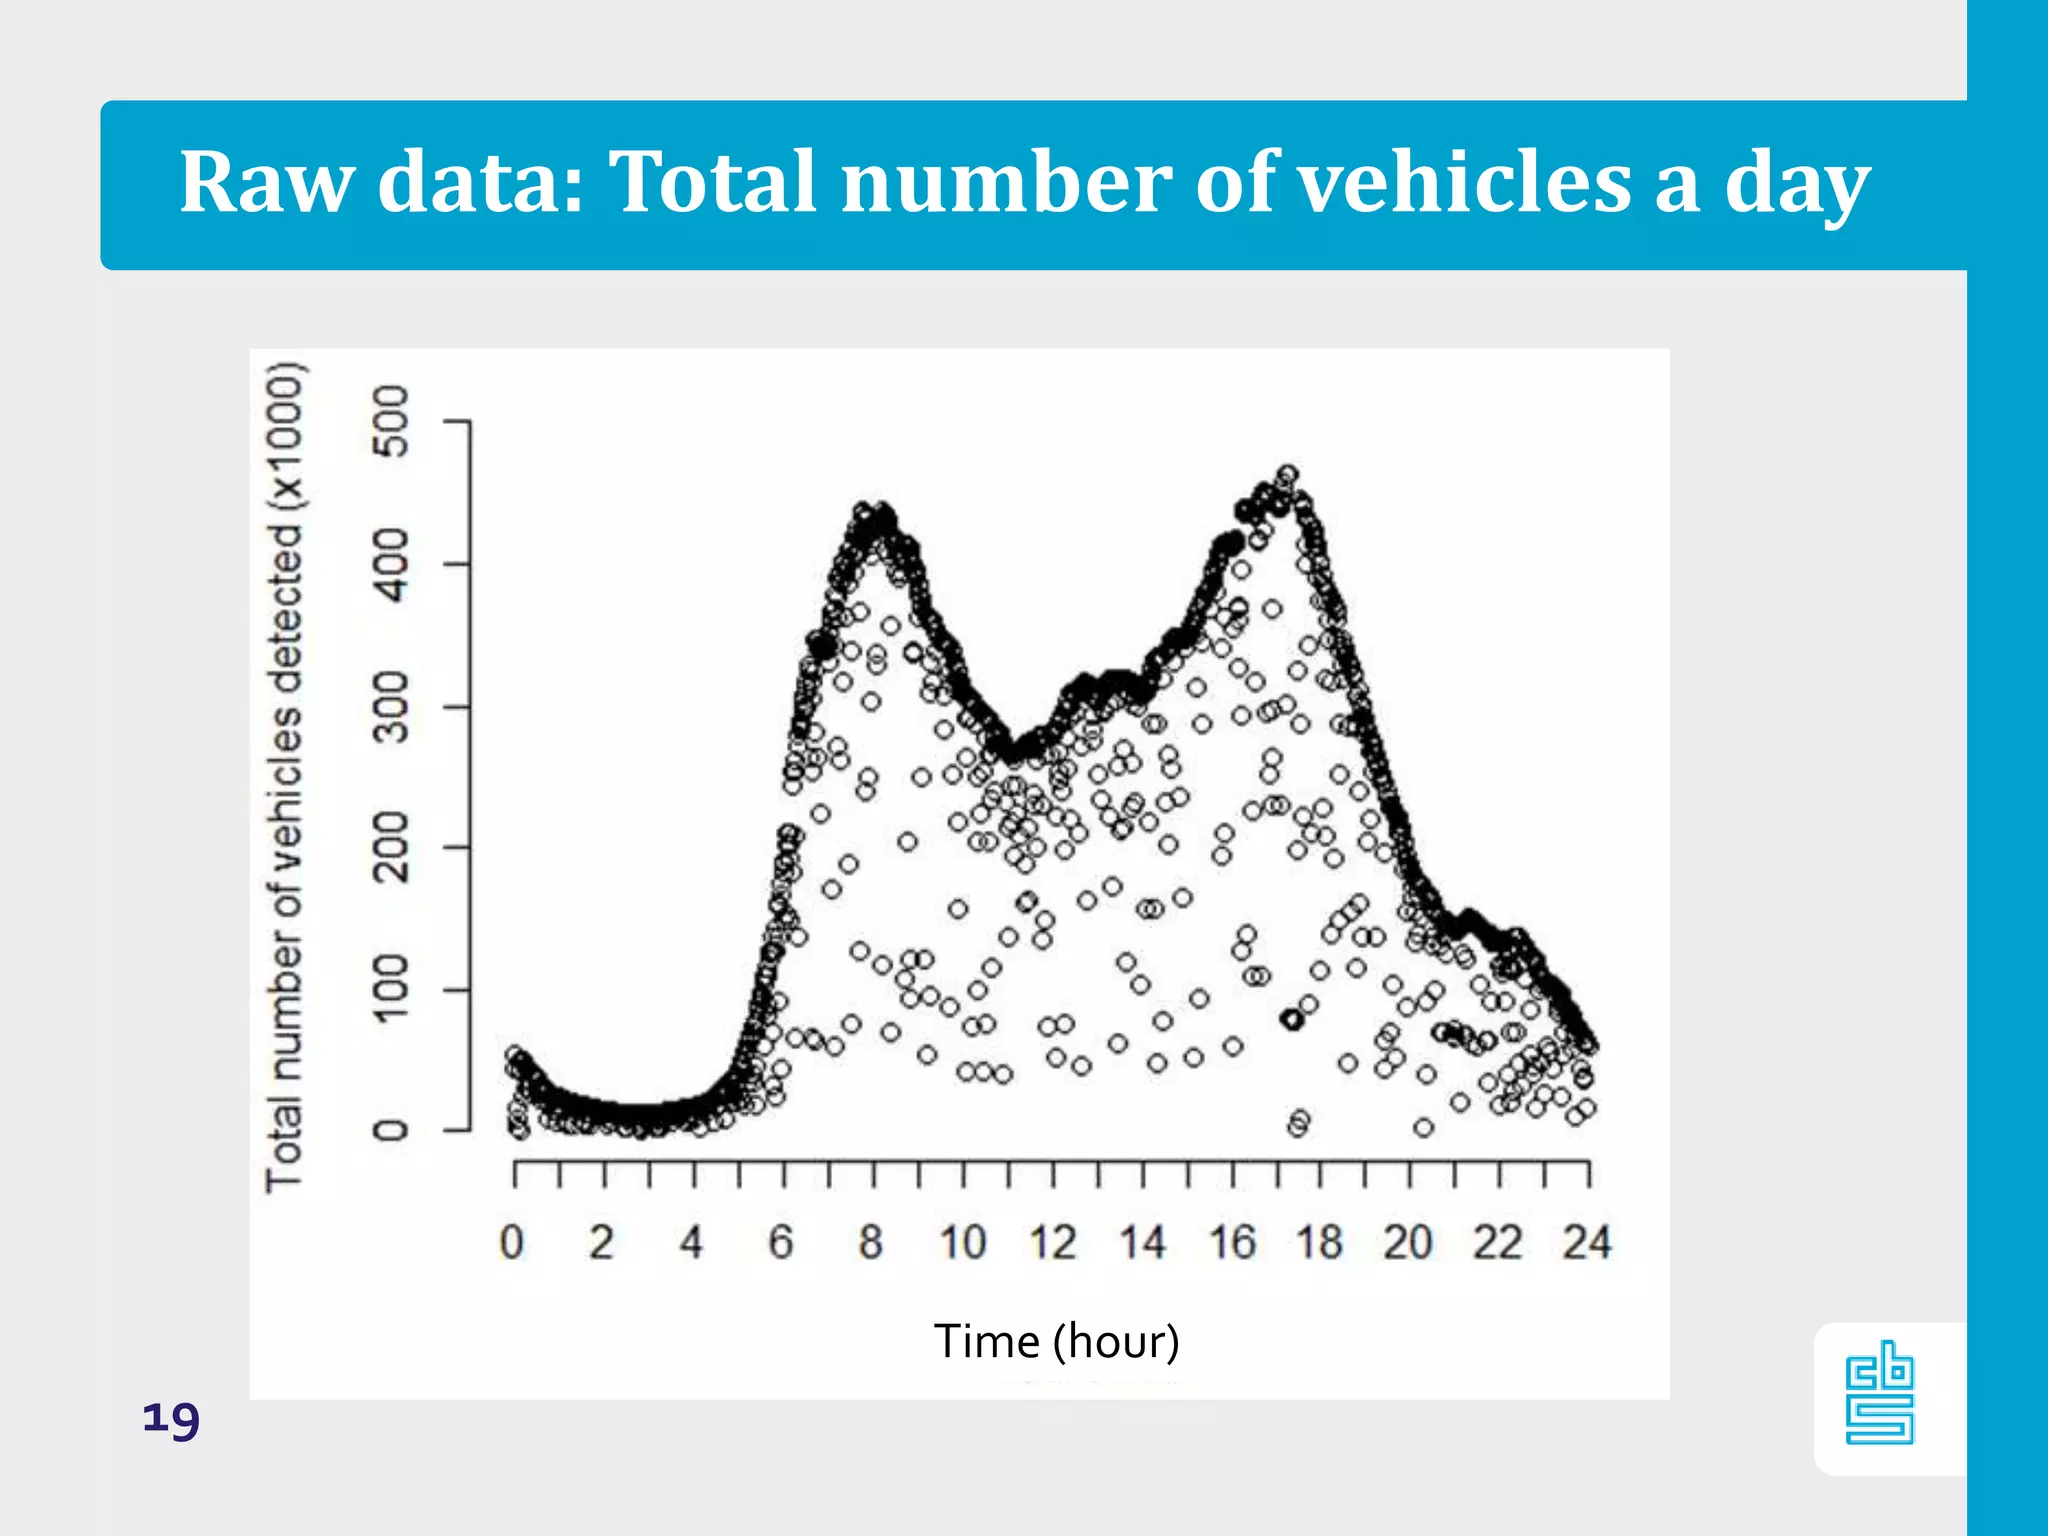
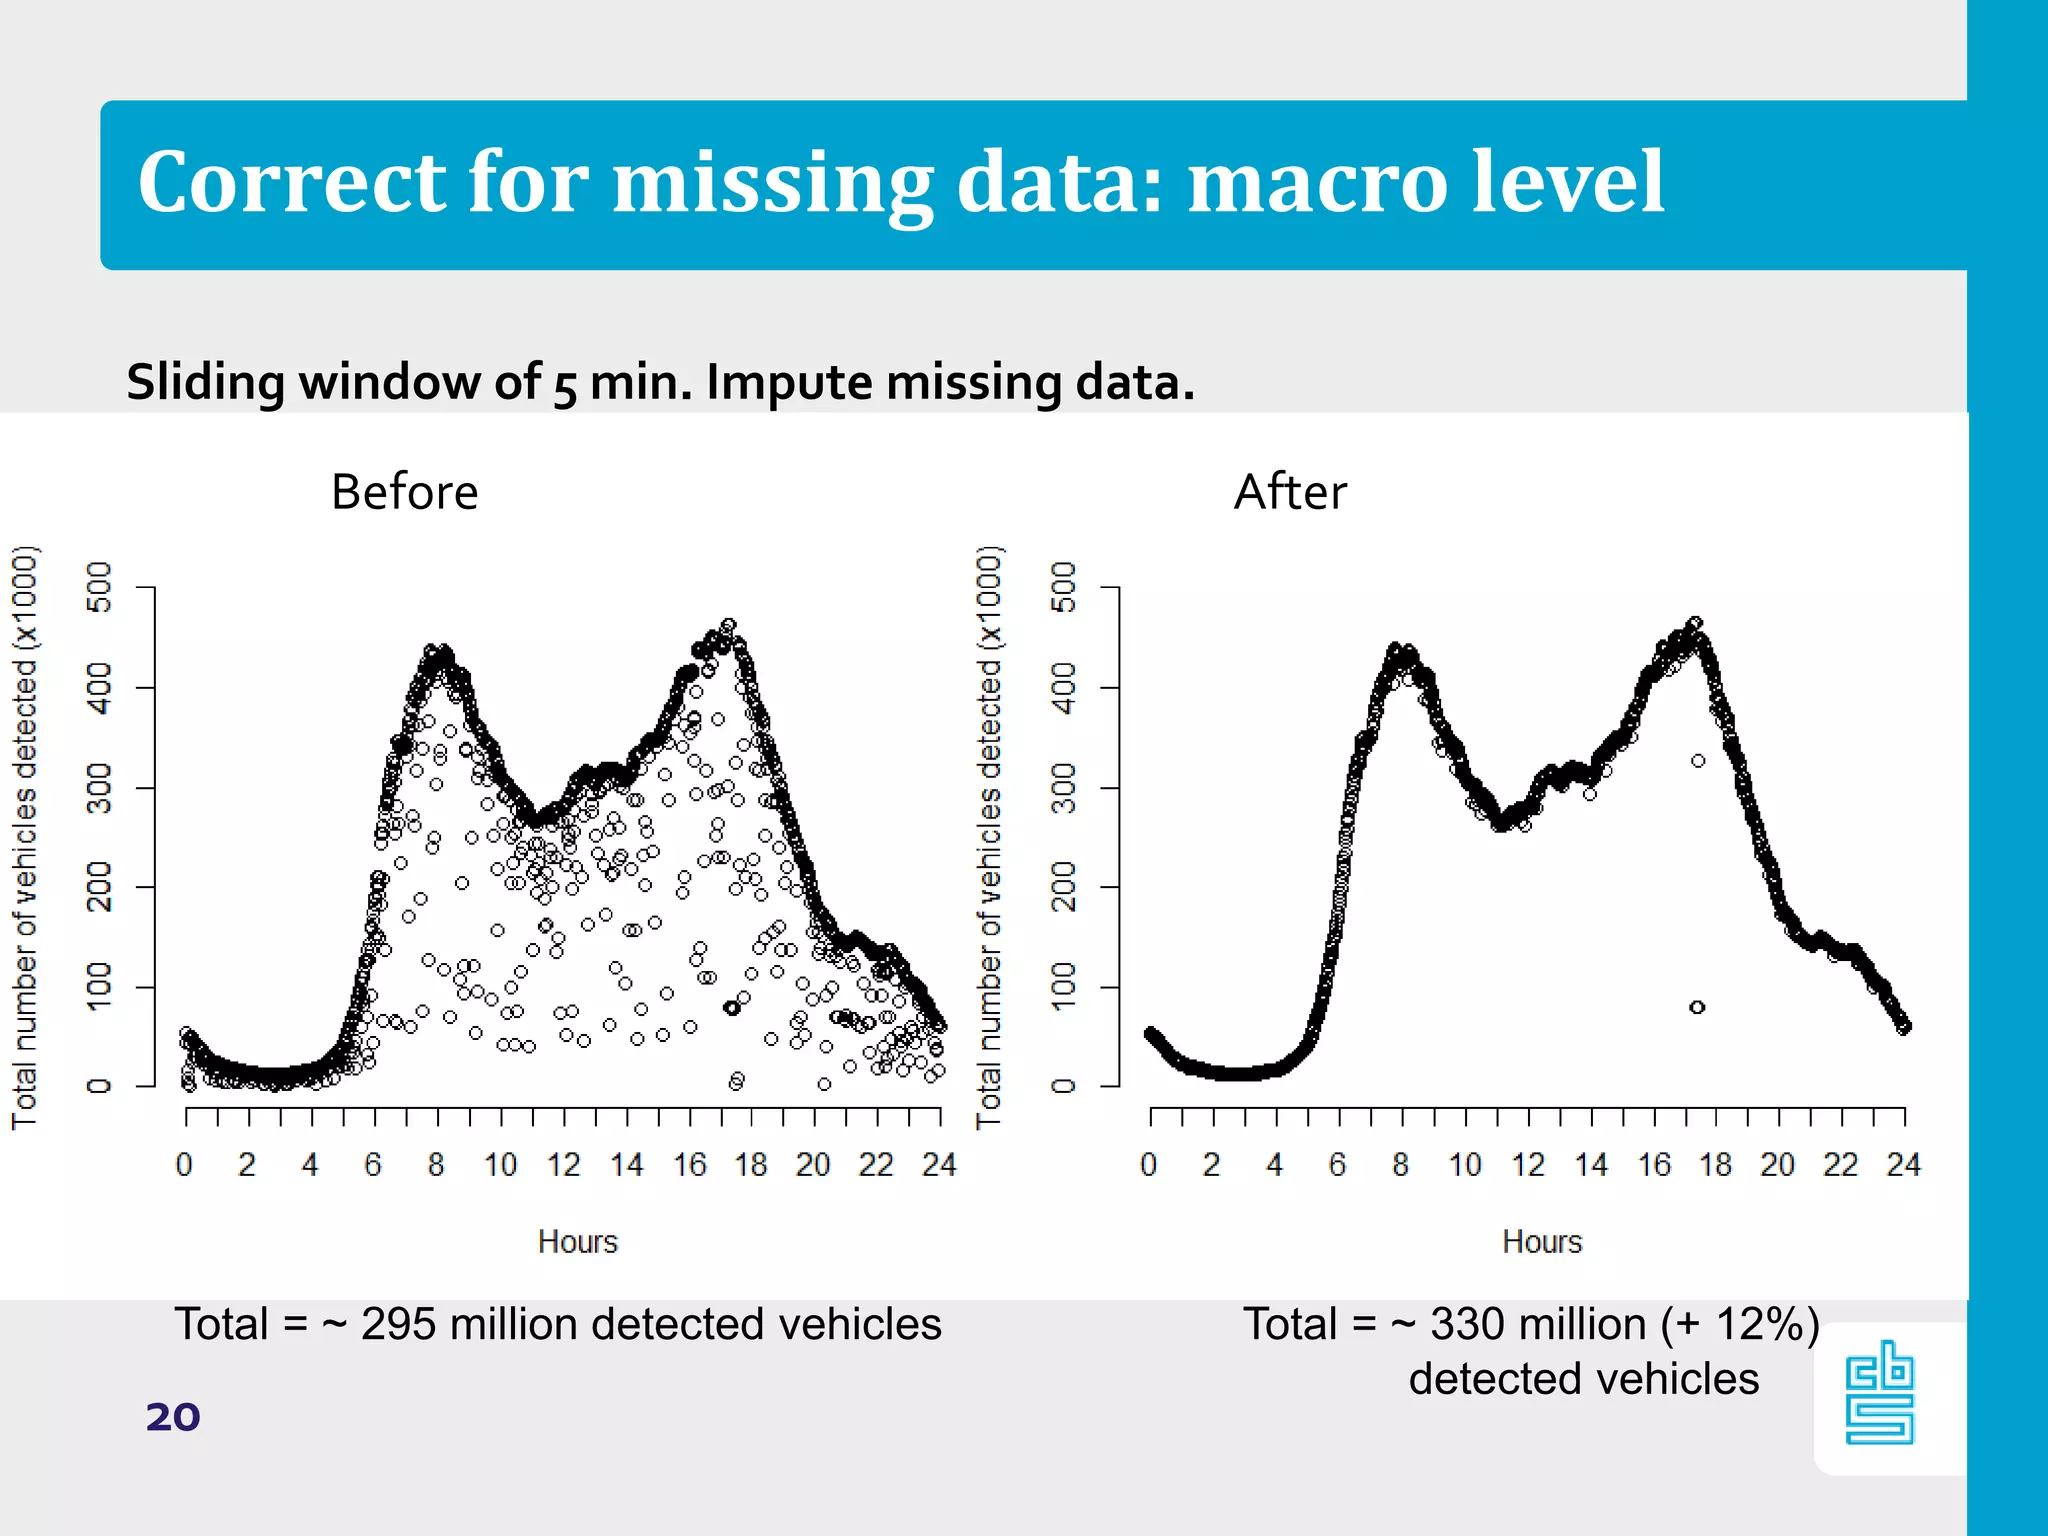
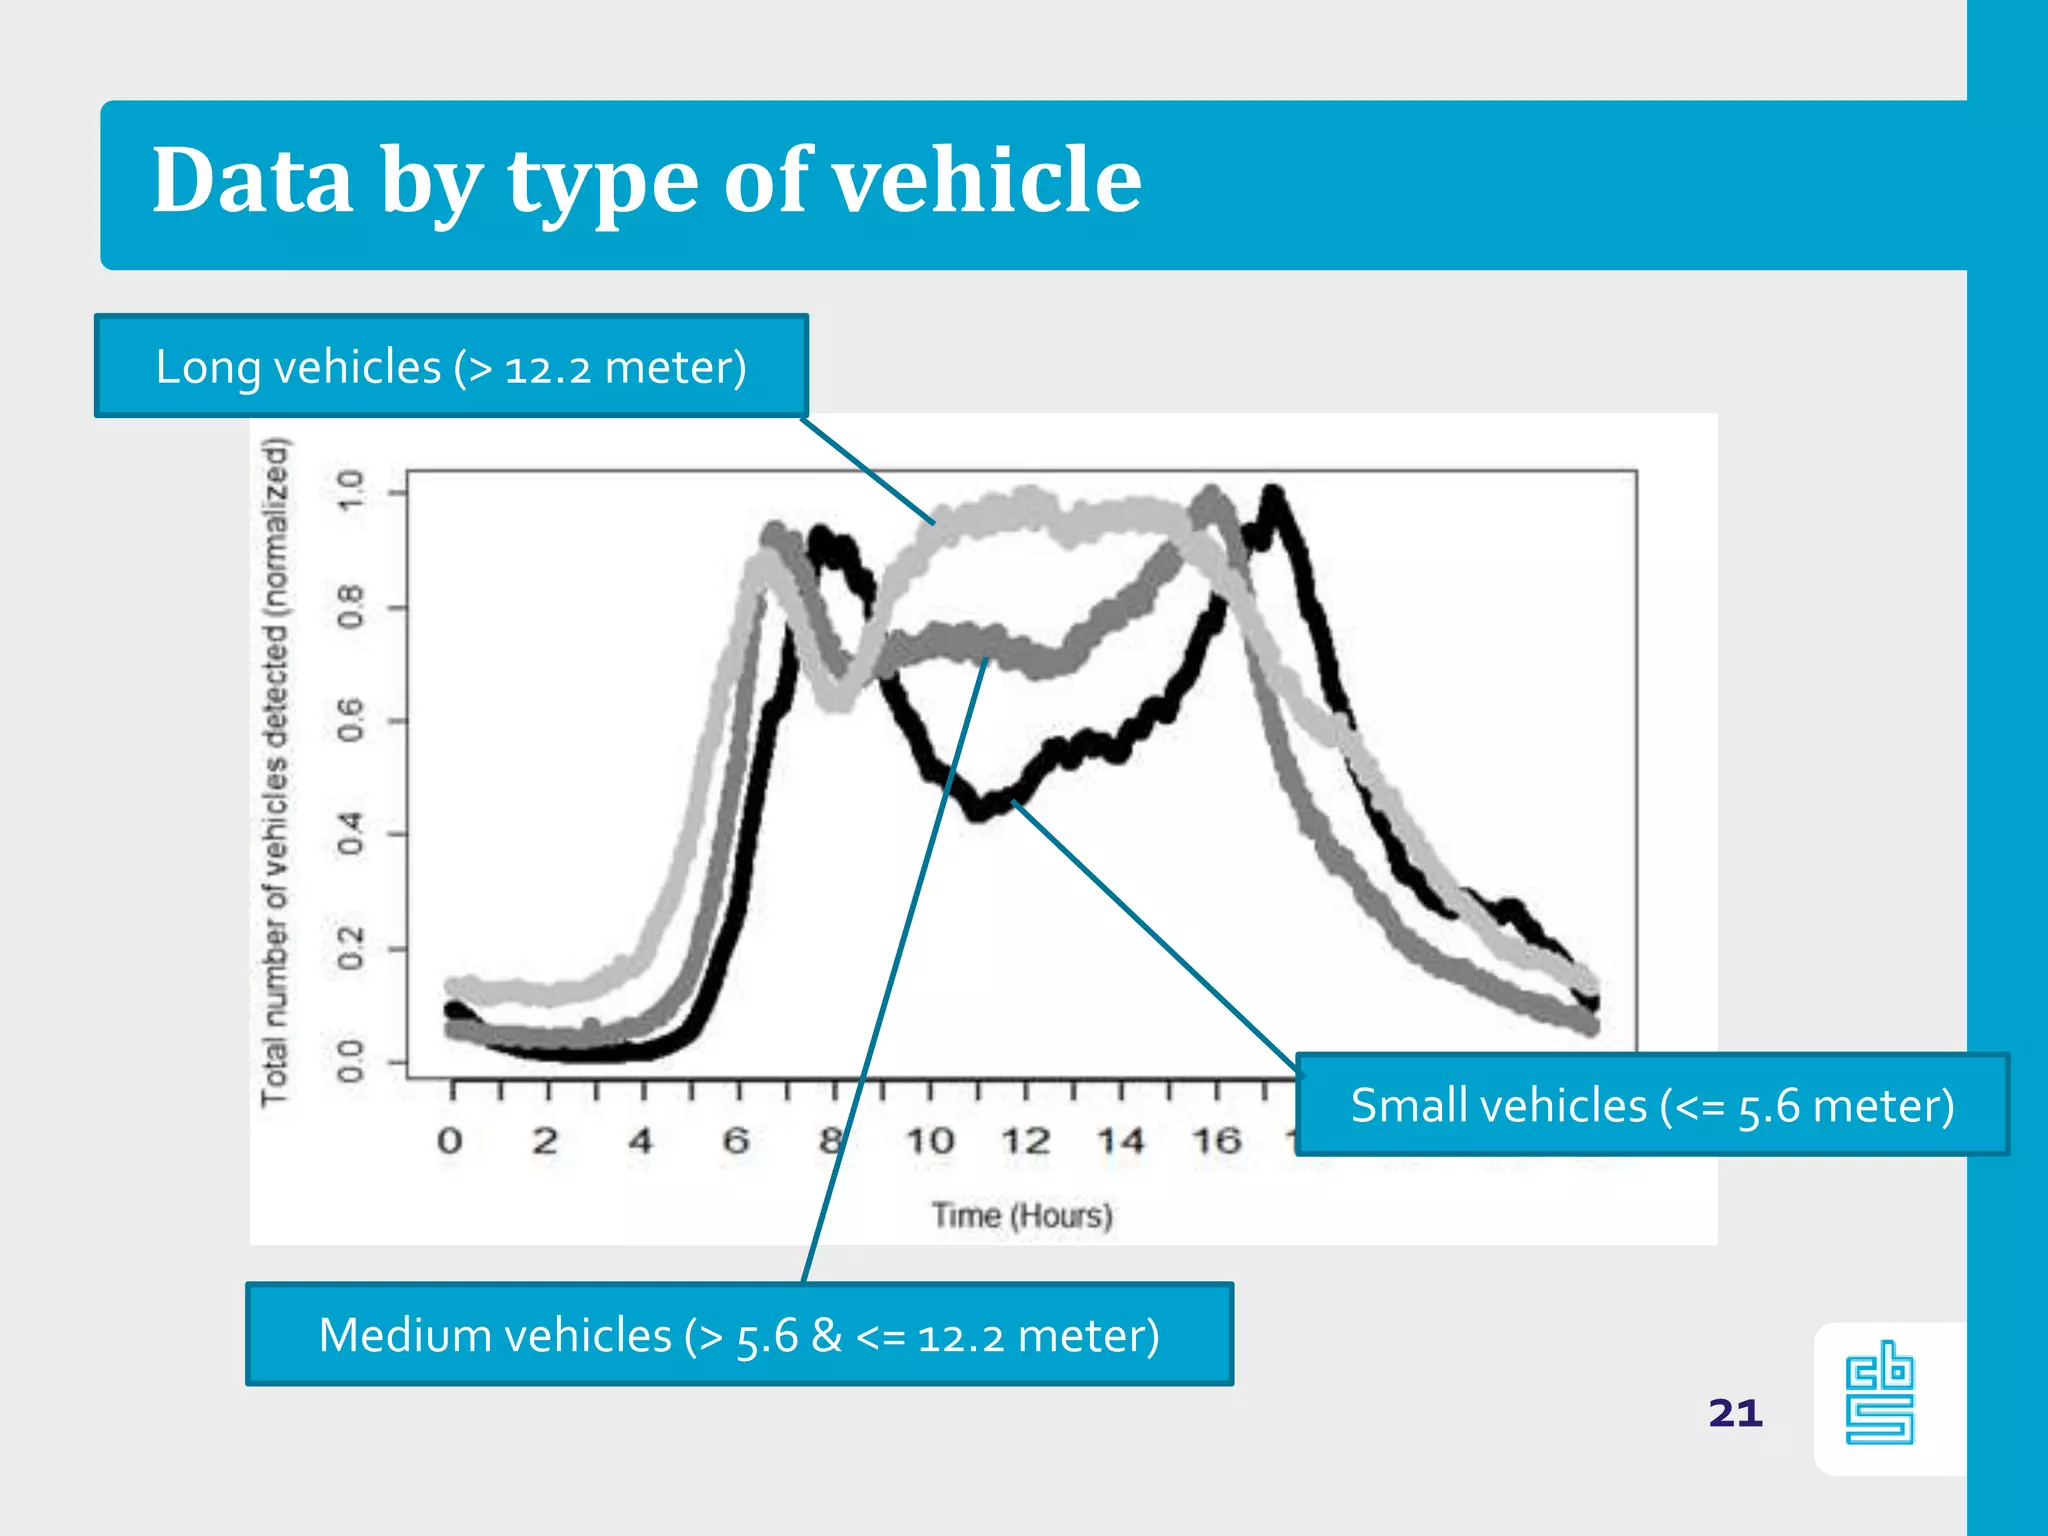
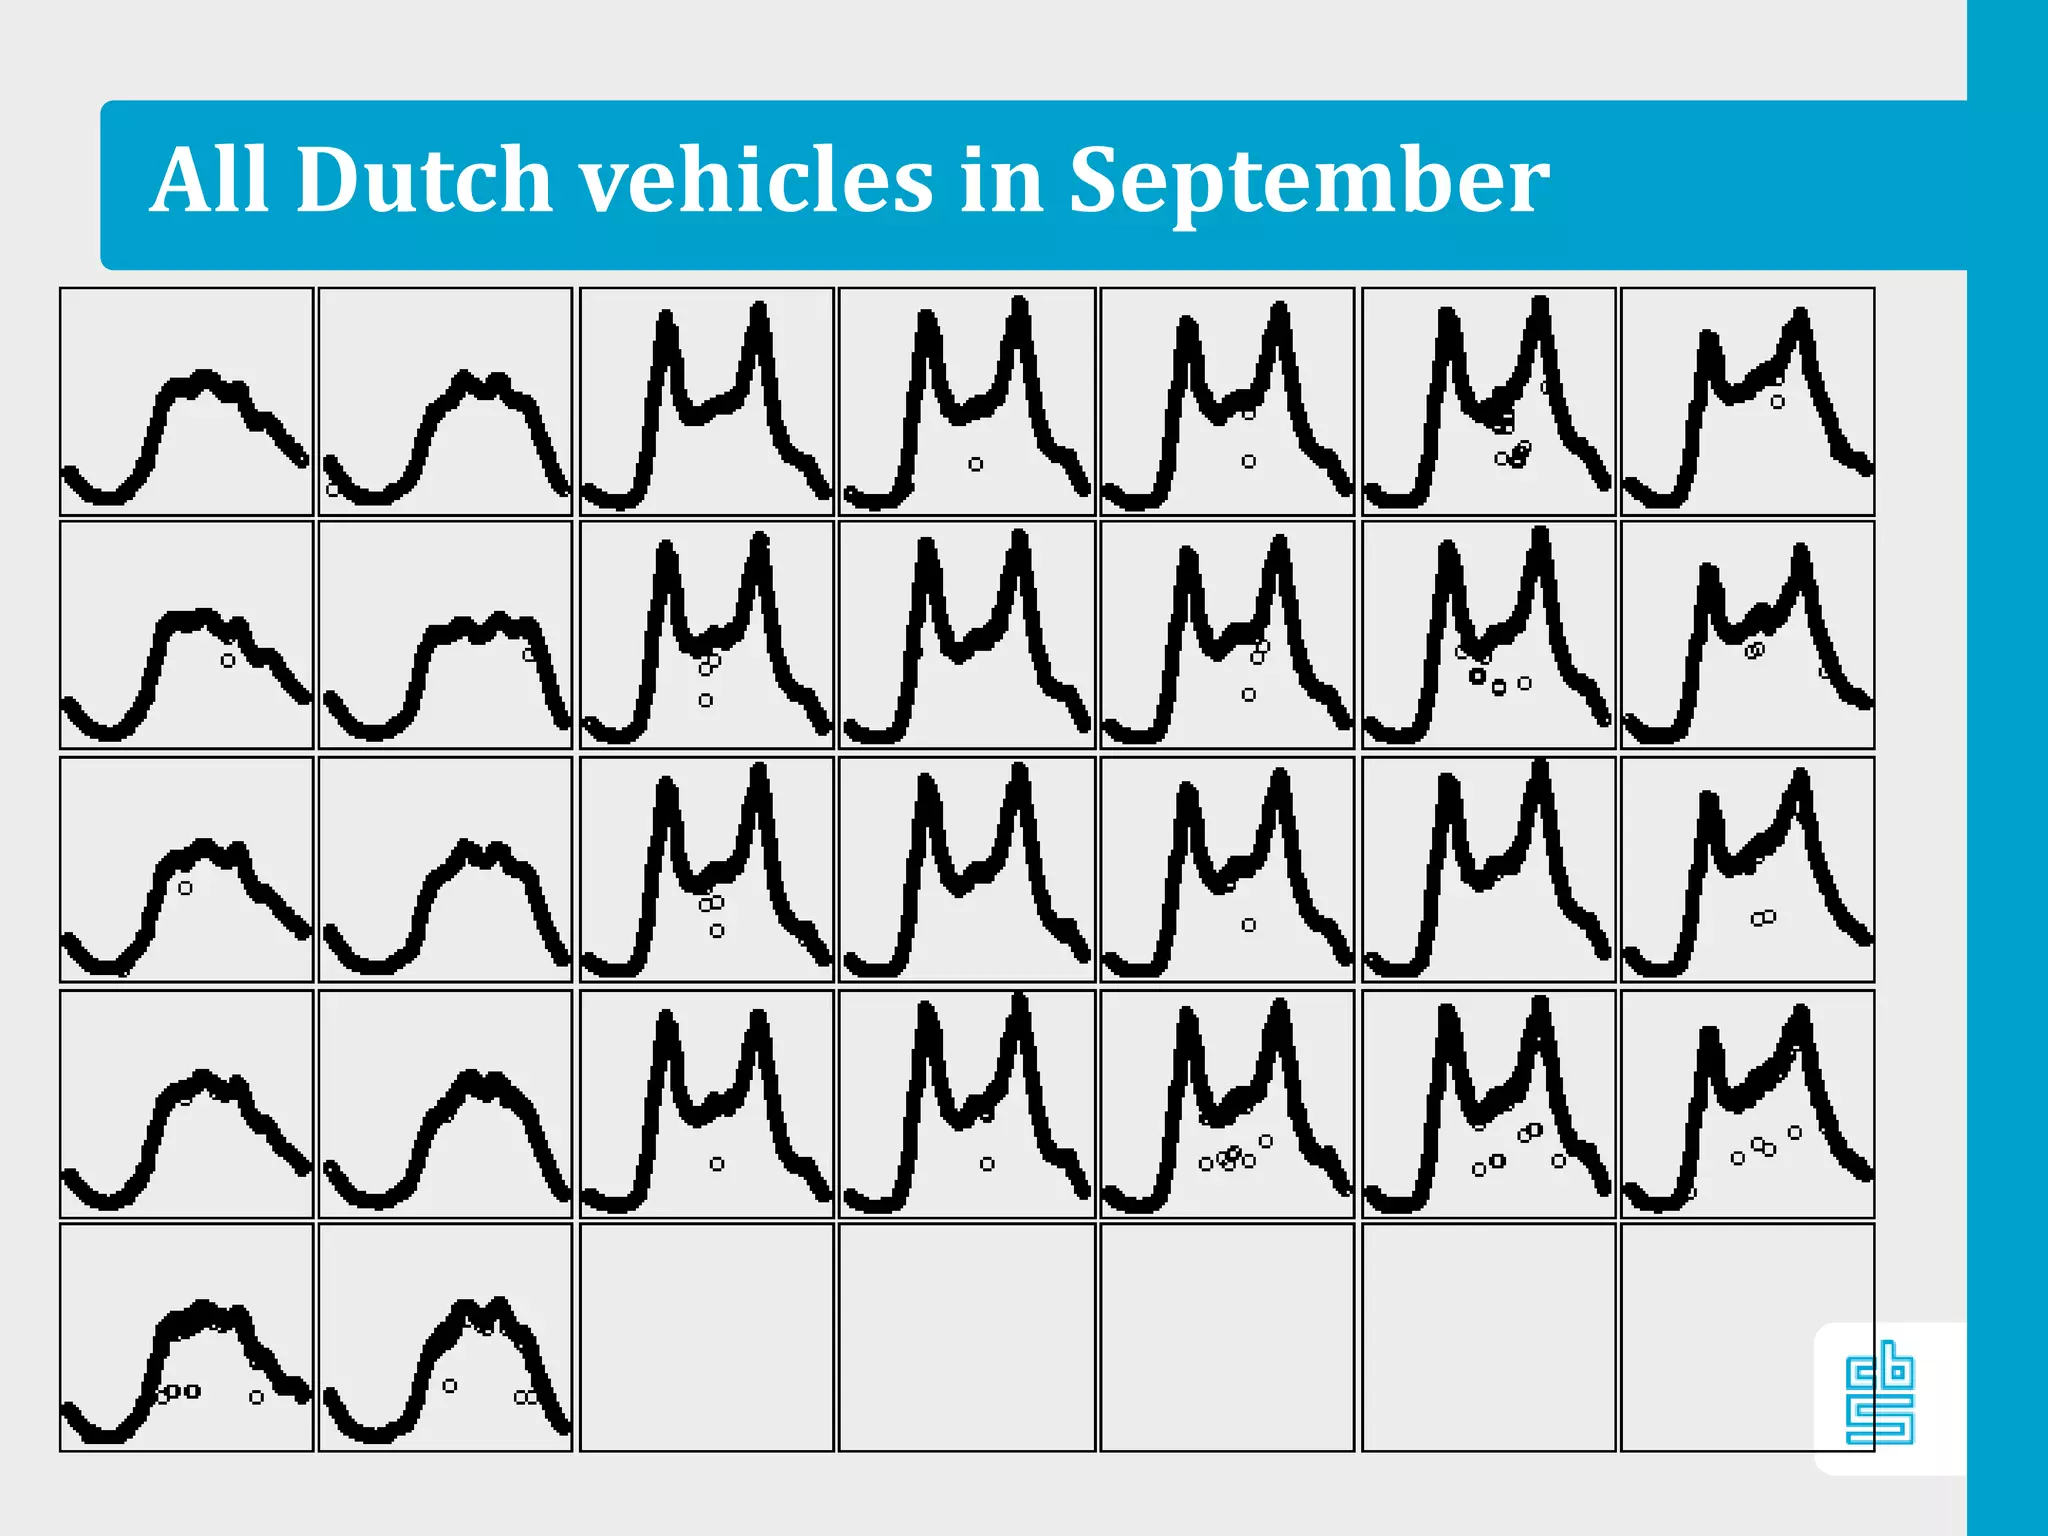
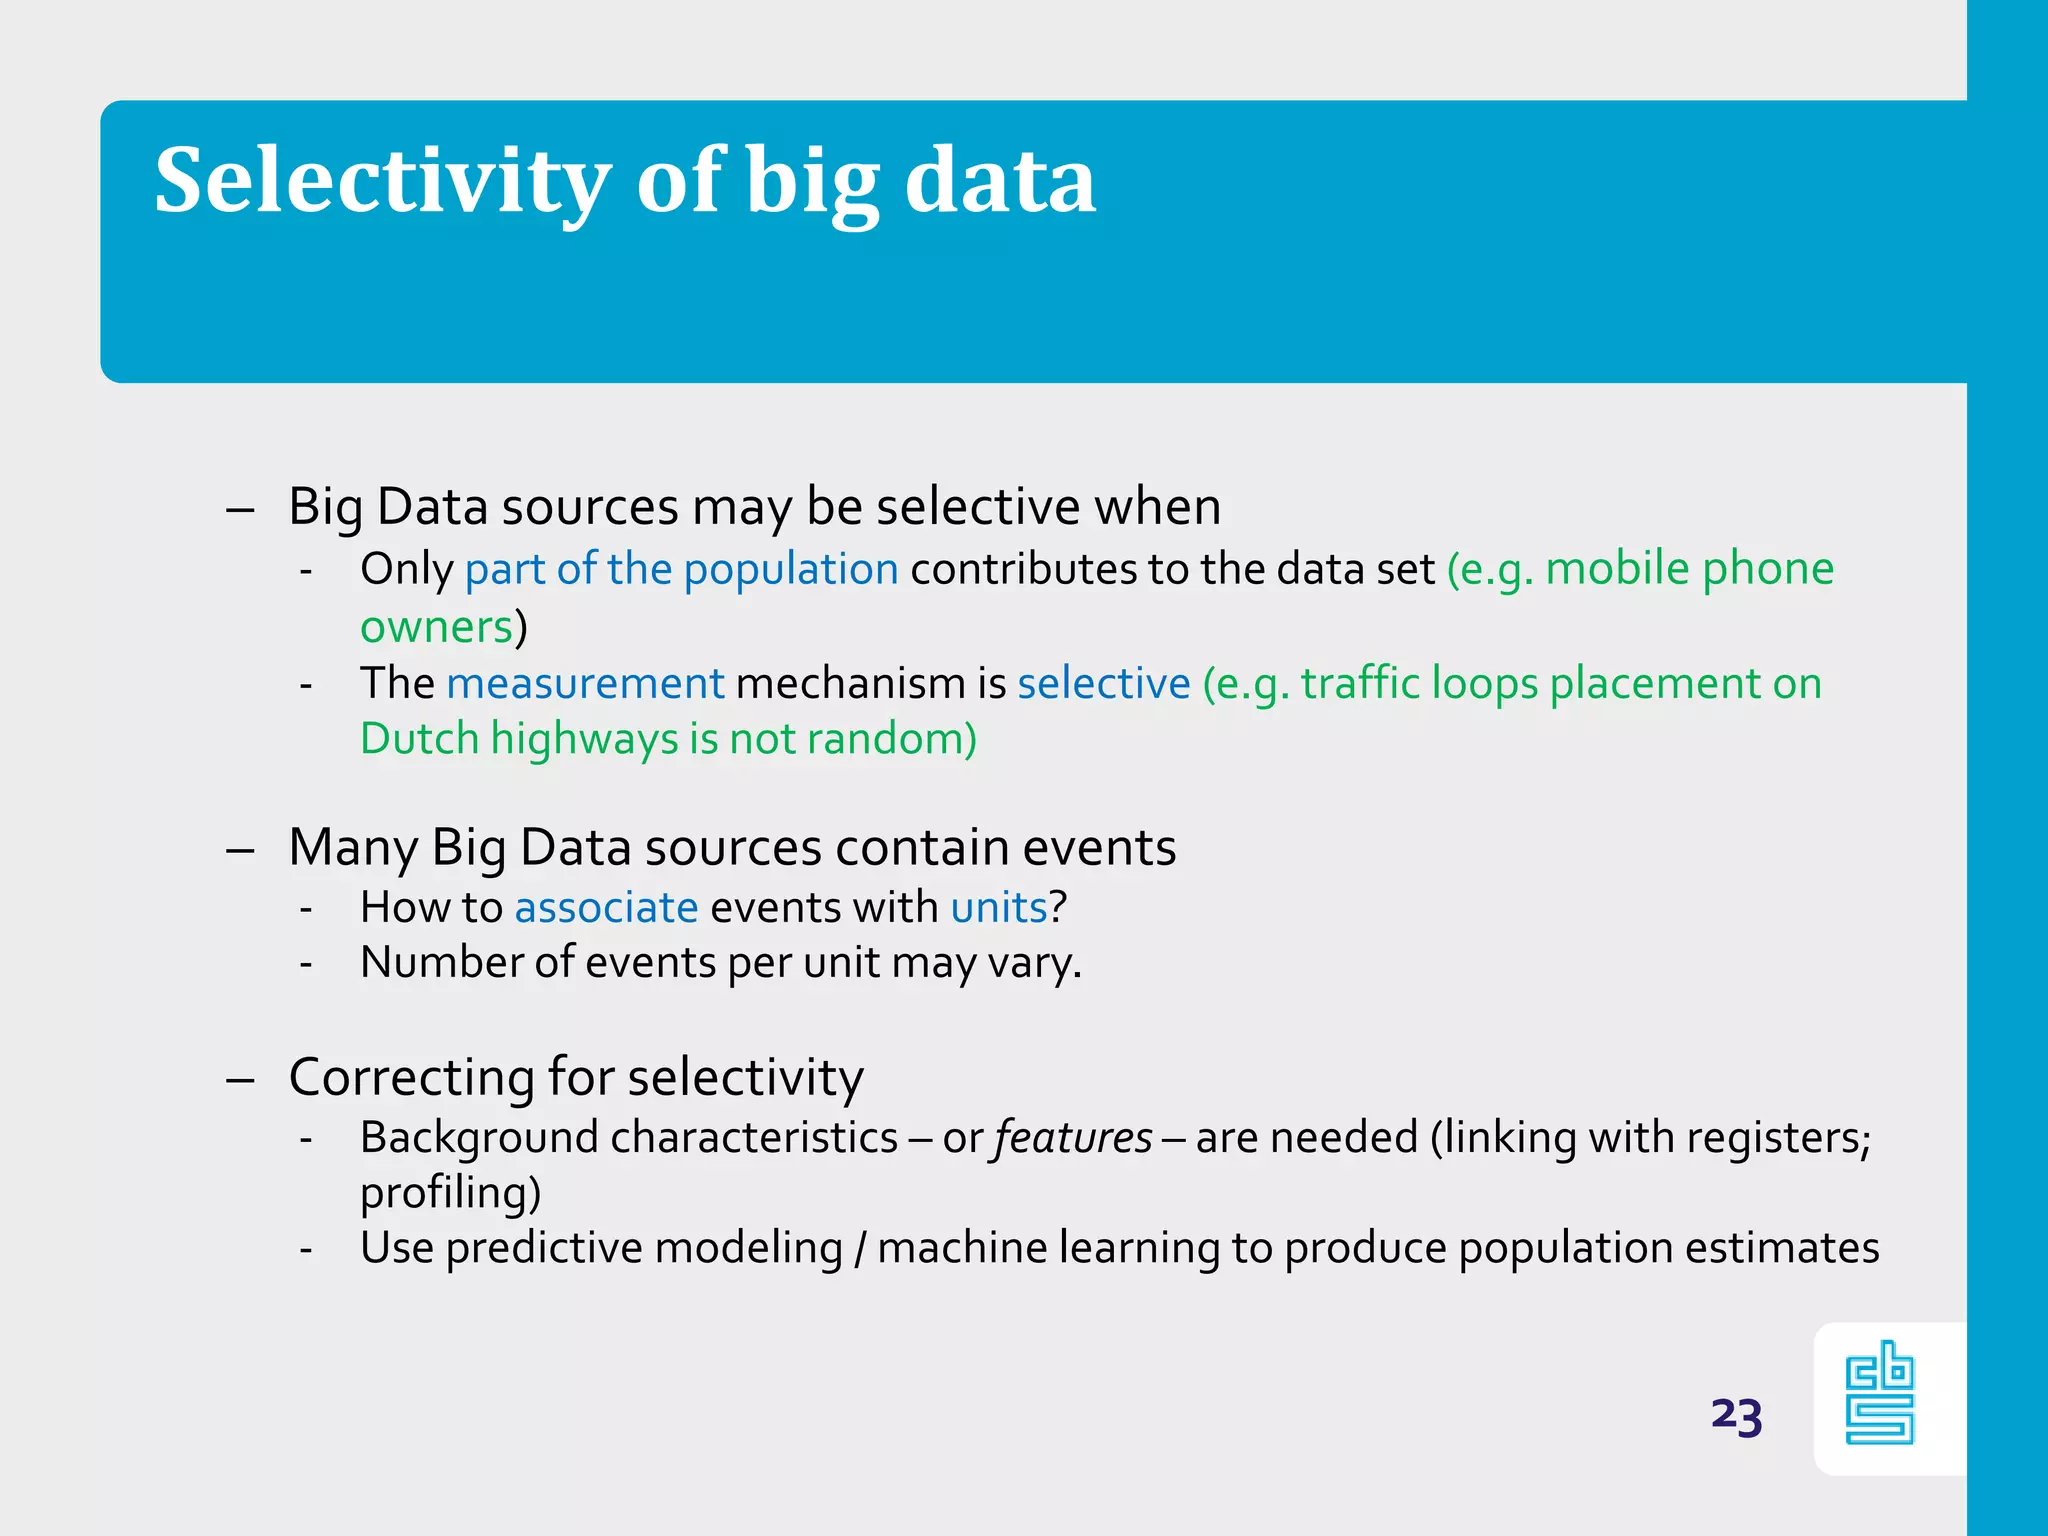
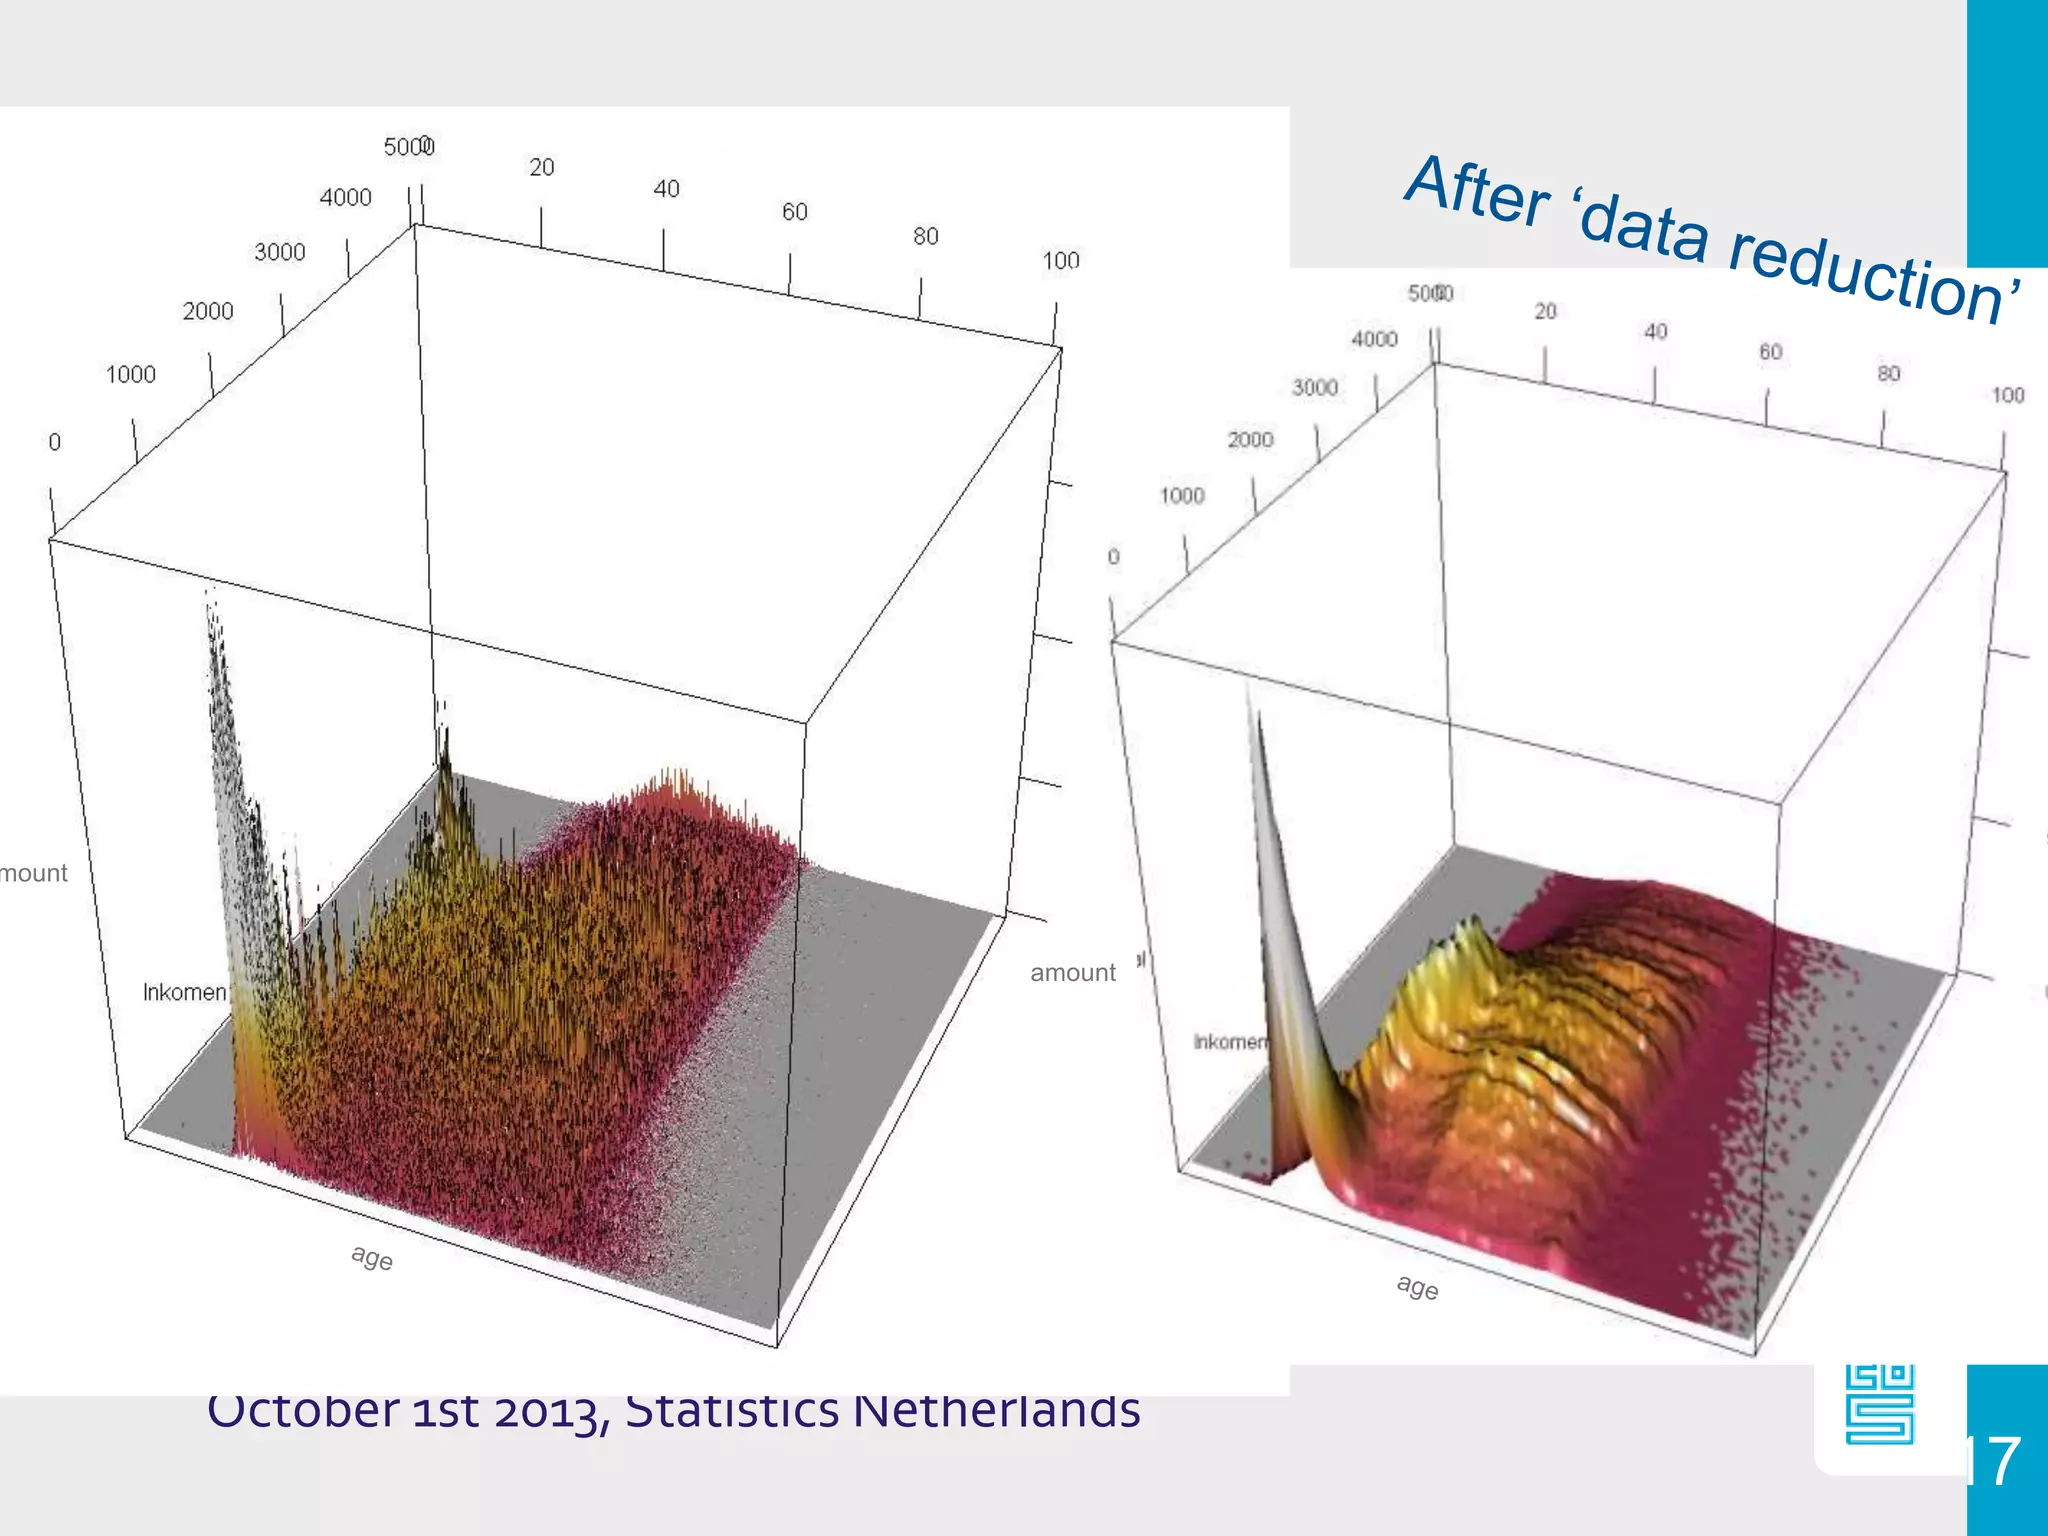
1. Edwin de Jonge
In cooperation with Piet Daas, Martijn Tennekes, Marco Puts, Alex Priem
Big Data
Case studies in Official Statistics
2. From a Official Statistics point of view
Three types of data:
1. Survey data = data collected by SN
with questionnaires
2. Admin data = administrative (register) data
collected by third parties such
as theTax Office
3. Big data = machine generated
data of events
2
3. Big Data case studies
Big data = machine generated data of events
3
Source Statistics
Social media Sentiment (as indicator for
business cycle)
Mobile phone data Daytime population, tourism
statistics
Traffic loops Traffic index statistics
At the end of this talk:
Visualization methods for Big Data
4. Overview
4
• Big Data
• Research ‘theme’ at Stat. Netherlands
• Data driven approach
•Visualization as a tool
•Why?
•Examples in our office
• Issues & challenges
• From an official statistical perspective
6. Case study 1: Social media
– 3 billion messages as of 2009 gathered from Facebook,
Twitter, LinkedIn, Google+ by a Dutch intermediate
companyCoosto.
– Sentiment per message determined by classifying words
as negative or positive.
– Could be used as indicator for the business cycle. Could it
be fit to the consumer confidence, the leading business
cycle indicator?
6
9. Table 1. Social media messages properties for various platforms and their correlation with consumer confidence
Correlation coefficient of
Social media platform Number of social Number of messages as monthly sentiment index and
media messages1
percentage of total (%) consumer confidence ( r )2
All platforms combined 3,153,002,327 100 0.75 0.78
Facebook 334,854,088 10.6 0.81* 0.85*
Twitter 2,526,481,479 80.1 0.68 0.70
Hyves 45,182,025 1.4 0.50 0.58
News sites 56,027,686 1.8 0.37 0.26
Blogs 48,600,987 1.5 0.25 0.22
Google+ 644,039 0.02 -0.04 -0.09
Linkedin 565,811 0.02 -0.23 -0.25
Youtube 5,661,274 0.2 -0.37 -0.41
Forums 134,98,938 4.3 -0.45 -0.49
1
period covered June 2010 untill November 2013
2
confirmed by visual inspecting scatterplots and additional checks (see text)
*cointegrated
Platform specific results
Granger causality reveals that Consumer Confidence precedes
Facebook sentiment ! (p-value < 0.001)
9
10. Case study 2: mobile phone metadata
– Pilot study with a cell phone provider with market share
of 1/3 in the Netherlands.
– Aggregated data is queried by intermediate company
Mezuro and delivered to SN. Privacy is guaranteed!
– Applications: daytime population, tourism statistics,
economic activity, mobility studies, etcetera.
10
13. Mobile phone metadata
13
Event Datail Records (EDR) contain metadata on mobile phone events (i.e. call,
SMS or data transfer).
Aggregated table: number of unique devices X time period X current region X
residential region.
15. Case study 3: Traffic loops
Traffic loop data
‐ Each minute (24/7) the number of passing vehicles is
counted in around 20.000 ‘loops’ in the Netherlands
(100 million records a day)
‐ Nice data source for transport and traffic statistics
(and more)15
16. Traffic loops on main roads
16A close look at the highways around Utrecht
20. Correct for missing data: macro level
Sliding window of 5 min. Impute missing data.
Before After
Total = ~ 295 million detected vehicles Total = ~ 330 million (+ 12%)
detected vehicles
20
21. Data by type of vehicle
21
Small vehicles (<= 5.6 meter)
Medium vehicles (> 5.6 & <= 12.2 meter)
Long vehicles (> 12.2 meter)
23. Selectivity of big data
– Big Data sources may be selective when
‐ Only part of the population contributes to the data set (e.g. mobile phone
owners)
‐ The measurement mechanism is selective (e.g. traffic loops placement on
Dutch highways is not random)
– Many Big Data sources contain events
‐ How to associate events with units?
‐ Number of events per unit may vary.
– Correcting for selectivity
‐ Background characteristics – or features – are needed (linking with registers;
profiling)
‐ Use predictive modeling / machine learning to produce population estimates
23
26. Visualization of Big Data
– Large volume:
‐ Data binning or aggregation
– High velocity:
‐ Animations
‐ Dashboard / small multiples
– Large variety:
‐ Interactive interface
‐ Advanced visualization methods
26