Download to read offline
![Statistical discrimination at young age:
Statistical discrimination at young age:
evidence from young workers across four decades and 56 countries
Joanna Tyrowicz [FAME|GRAPE, University of Warsaw & IZA ]
Lucas van der Velde [FAME|GRAPE & Warsaw School of Economics]
Royal Economic Society
April 2022](https://image.slidesharecdn.com/presentation-220412102256/85/Statistical-discrimination-at-young-age-1-320.jpg)


![Statistical discrimination at young age:
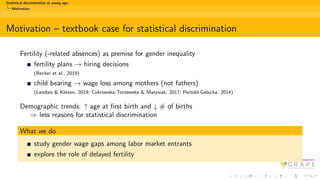
Results
The effect of delayed fertility on AGWG - Robustness checks
HDFE Quantile Regression Heterogeneous fertility
(1) (2) (3) (4) (5) (6)
Q25 Q50 Q75 Intercepts Slopes
MAB -0.012 *** -0.023 *** -0.022 *** -0.032 ***
[-0.02,-0.00] [-0.03,-0.01] [-0.03,-0.01] [-0.04,-0.02]
MAB< Q25 0.133 *** -0.018
[0.07,0.20] [-0.05,0.02]
MAB ∈ [Q25, Q75] 0.027 -0.019
[-0.03,0.08] [-0.05,0.01]
MAB> Q75 -0.019
[-0.05,0.01]](https://image.slidesharecdn.com/presentation-220412102256/85/Statistical-discrimination-at-young-age-34-320.jpg)


![Statistical discrimination at young age:
Summary
Questions or suggestions?
Thank you!
w: grape.org.pl
t: grape org
f: grape.org
e: lvandervelde[at]grape.org.pl](https://image.slidesharecdn.com/presentation-220412102256/85/Statistical-discrimination-at-young-age-42-320.jpg)


The document explores statistical discrimination at a young age, focusing on how fertility-related decisions impact gender wage gaps among young workers across various countries. It highlights the increasing age of first-time mothers and declining birth rates as factors that may reduce statistical discrimination in hiring and wage-setting processes. The authors provide evidence that delayed fertility leads to reduced gender wage gaps, while also discussing various methodologies and instruments used in their analysis.


![CAPE SOCIOLOGY Age and sex structure[1]](https://cdn.slidesharecdn.com/ss_thumbnails/ageandsexstructure1-140118141140-phpapp02-thumbnail.jpg?width=640&height=640&fit=bounds)


