Download to read offline
![Statistical discrimination at young age:
Statistical discrimination at young age:
evidence from young workers across four decades and 56 countries
Joanna Tyrowicz [FAME|GRAPE, University of Warsaw & IZA ]
Lucas van der Velde [FAME|GRAPE & Warsaw School of Economics]
Congress of the European Economic Association
August 2022](https://image.slidesharecdn.com/presentation-220829081130-21b7dc4b/85/Statistical-discrimination-at-young-age-1-320.jpg)
![Statistical discrimination at young age:
Statistical discrimination at young age:
evidence from young workers across four decades and 56 countries
Joanna Tyrowicz [FAME|GRAPE, University of Warsaw & IZA ]
Lucas van der Velde [FAME|GRAPE & Warsaw School of Economics]
Congress of the European Economic Association
August 2022](https://image.slidesharecdn.com/presentation-220829081130-21b7dc4b/75/Statistical-discrimination-at-young-age-1-2048.jpg)


![Statistical discrimination at young age:
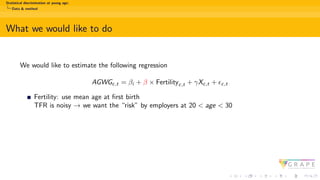
Results
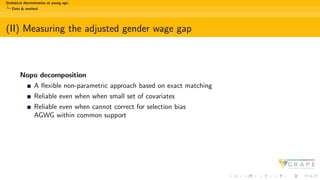
The effect of delayed fertility on AGWG - Robustness checks
HDFE Quantile Regression Heterogeneous fertility
(1) (2) (3) (4) (5) (6)
Q25 Q50 Q75 Intercepts Slopes
MAB -0.012 *** -0.023 *** -0.022 *** -0.032 ***
[-0.02,-0.00] [-0.03,-0.01] [-0.03,-0.01] [-0.04,-0.02]
MAB< Q25 0.133 *** -0.018
[0.07,0.20] [-0.05,0.02]
MAB ∈ [Q25, Q75] 0.027 -0.019
[-0.03,0.08] [-0.05,0.01]
MAB> Q75 -0.019
[-0.05,0.01]](https://image.slidesharecdn.com/presentation-220829081130-21b7dc4b/85/Statistical-discrimination-at-young-age-32-320.jpg)
![Statistical discrimination at young age:
Summary
Questions or suggestions?
Thank you!
w: grape.org.pl
t: grape org
f: grape.org
e: lvandervelde[at]grape.org.pl](https://image.slidesharecdn.com/presentation-220829081130-21b7dc4b/85/Statistical-discrimination-at-young-age-41-320.jpg)
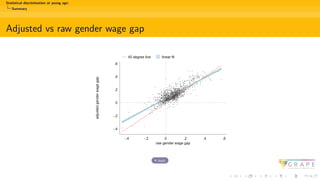
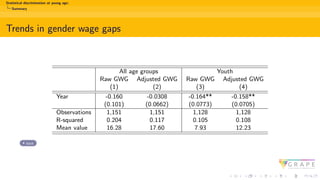
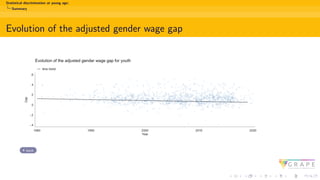
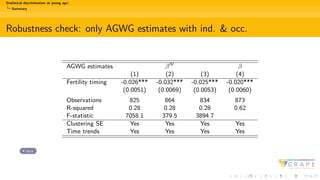

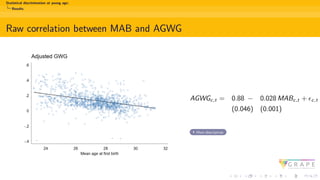
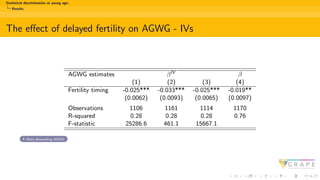
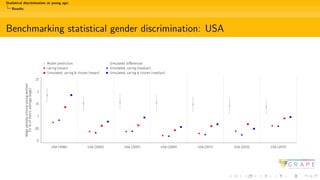
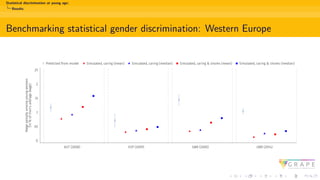
The document discusses the impact of statistical discrimination on gender wage gaps among young workers, emphasizing how fertility-related decisions can lead to disparities in hiring and wages. It highlights trends such as delayed fertility and demographic changes that serve as potential explanations for these discrimination patterns across multiple countries. The findings suggest employers may exhibit bias based on fertility timing, with evidence showing a correlation between delayed fertility and reduced gender wage gaps.


![CAPE SOCIOLOGY Age and sex structure[1]](https://cdn.slidesharecdn.com/ss_thumbnails/ageandsexstructure1-140118141140-phpapp02-thumbnail.jpg?width=640&height=640&fit=bounds)


