This document examines the impact of population and workforce aging on economic growth in Taiwan. It finds that:
1) Taiwan's population is aging rapidly and is expected to become a hyper-aged society within 8 years, aging faster than other developed countries.
2) While some studies find workforce aging negatively impacts economic growth, others find no decline or a positive impact on productivity.
3) The study empirically analyzes Taiwan data from 1981-2017 to examine the impact of workforce aging and dependency ratios on economic growth, finding the aging workforce positively impacts growth while the old-age dependency ratio negatively impacts growth.
![Sustainability 2019, 11, 6301 2 of 13
Sustainability 2019, 11, x FOR PEER REVIEW 2 of 14
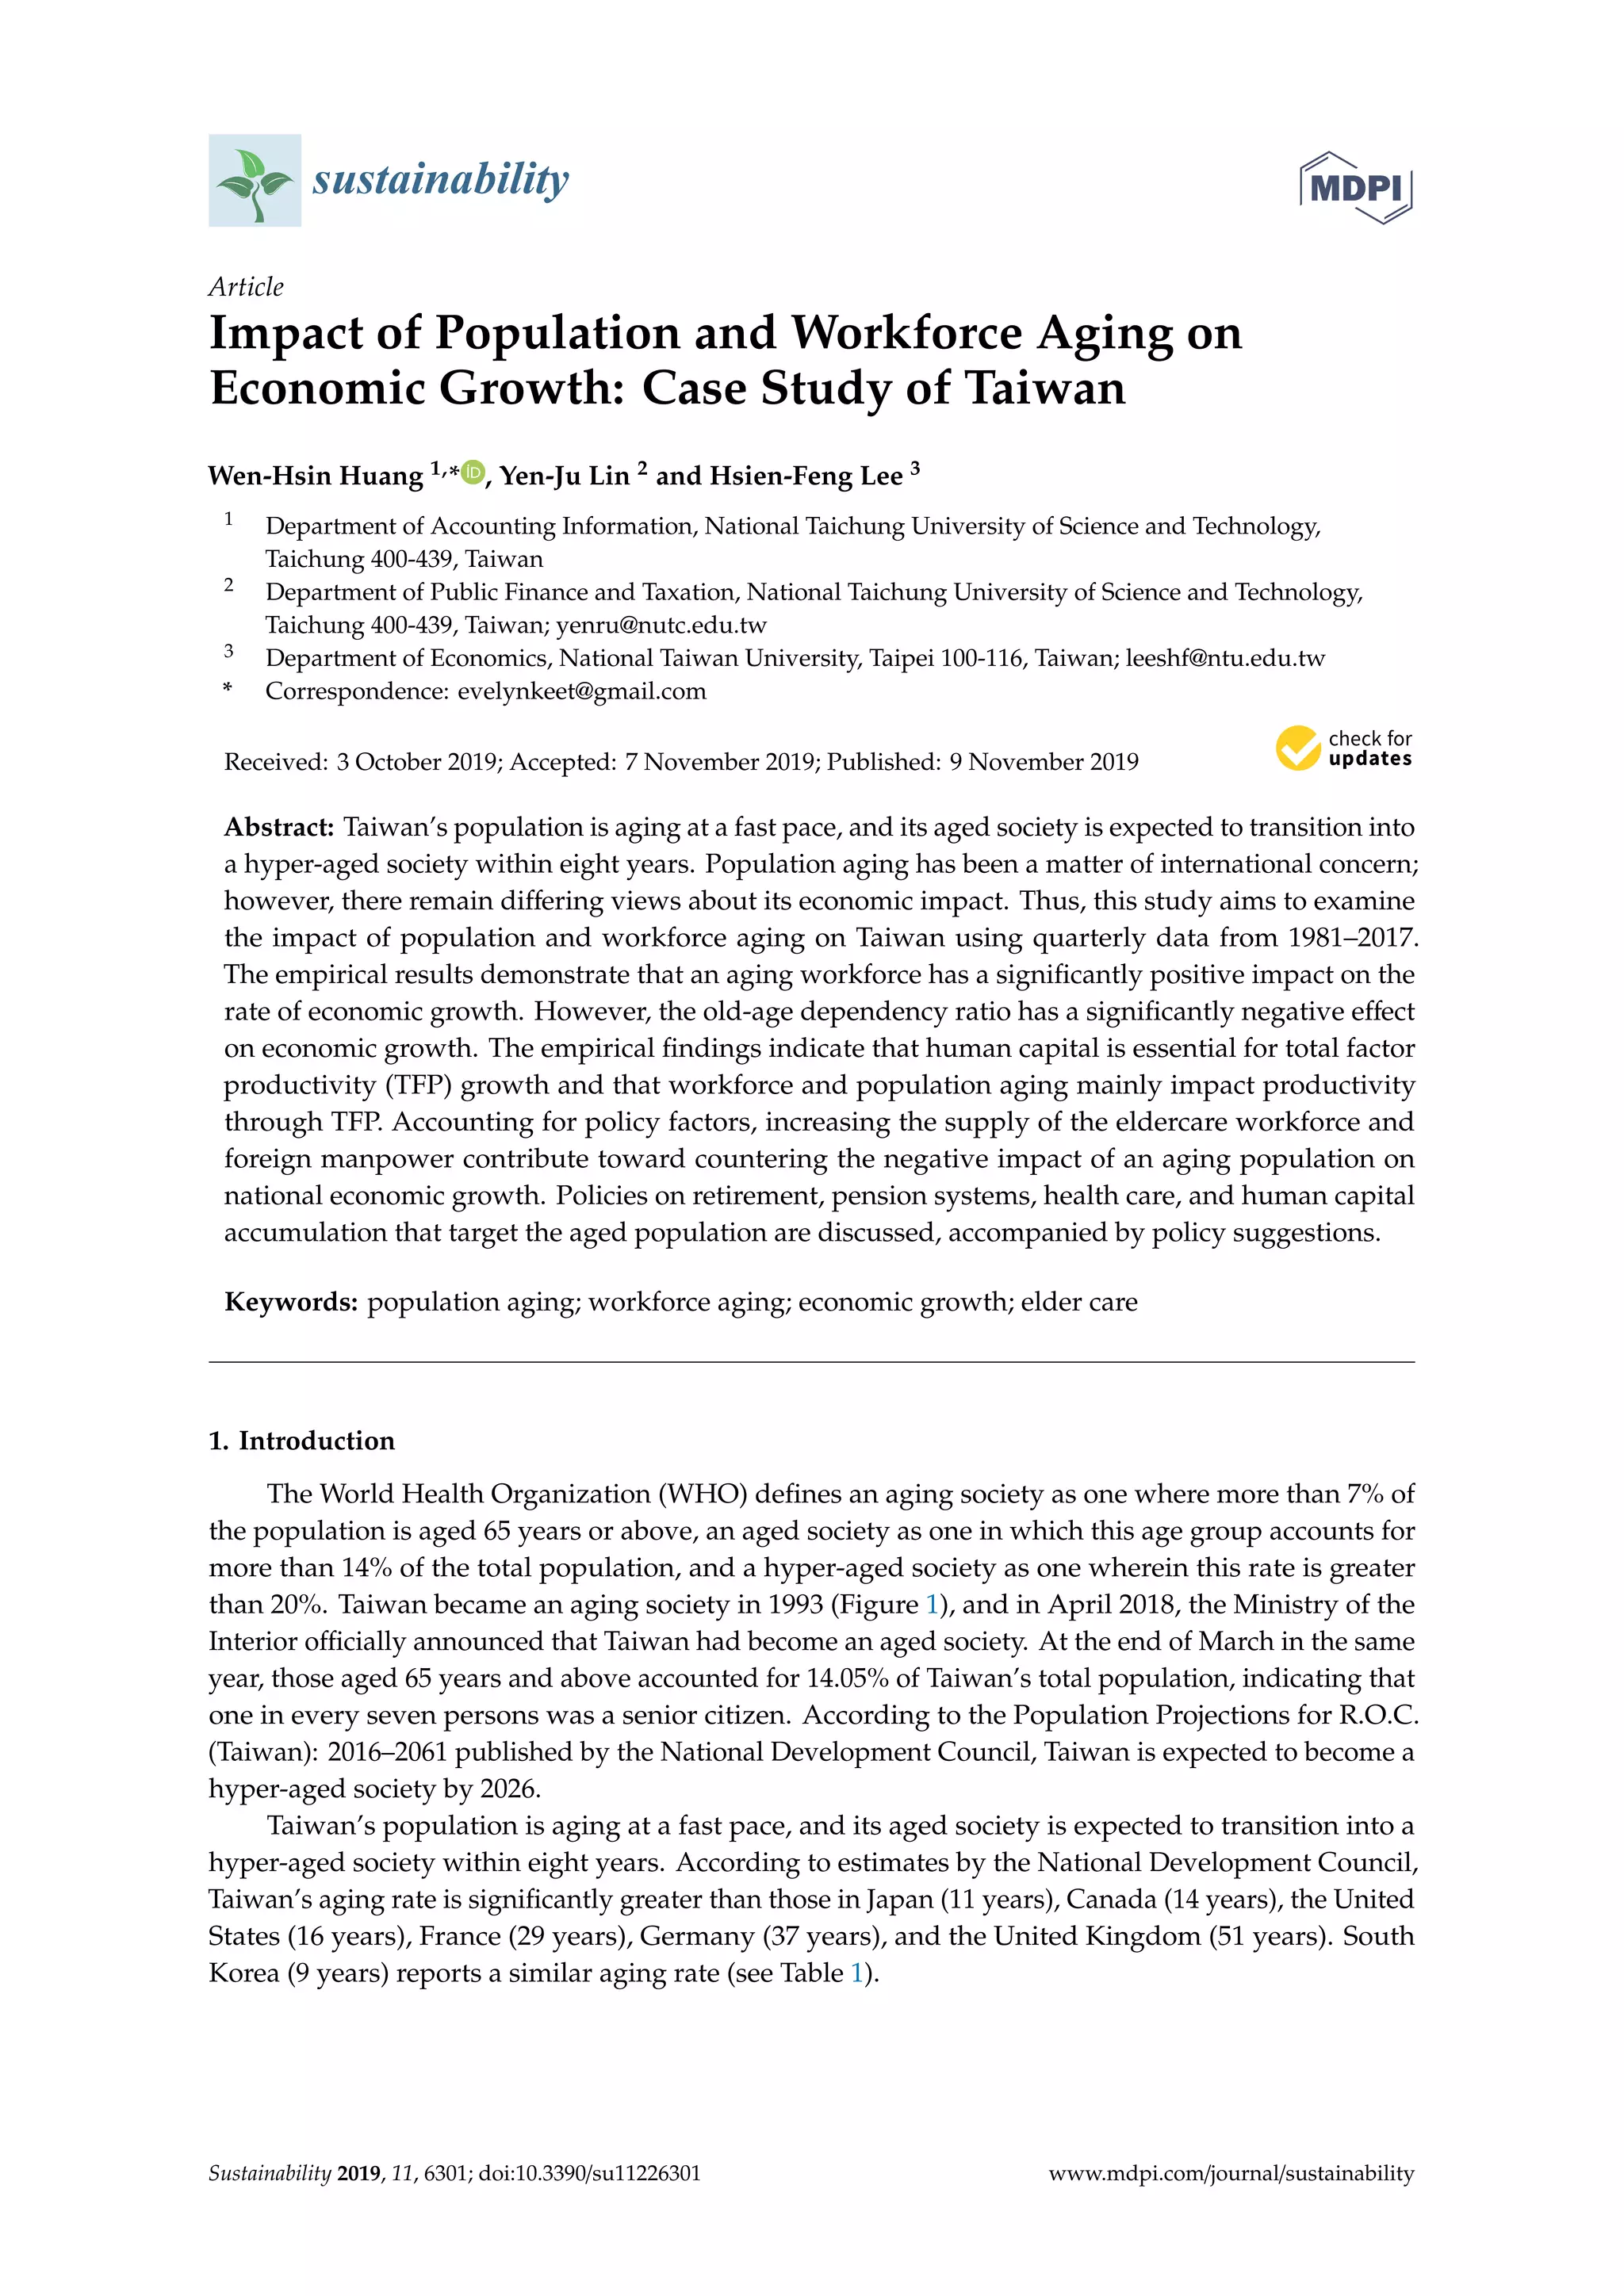
Figure 1. Run chart of age groups as a percentage of Taiwan’s total population. Source: National
Statistics, Republic of China (Taiwan), website: www.stat.gov.tw/mp.asp?mp=4.
Table 1. Time trend for global population aging.
Country
Population Aged 65 and Above (% of Total)
7% 10% 14% 20%
Taiwan 1993 2006 2018 2026
Japan 1970 1984 1994 2005
South Korea 1999 2007 2017 2026
Singapore 1999 2012 2018 2026
China 2000 2016 2025 2035
France 1864 1943 1990 2019
Germany 1932 1951 1971 2008
United Kingdom 1929 1946 1975 2026
United States 1942 1972 2013 2029
Canada 1945 1984 2010 2024
Source: World Population Prospects: The 2017 Revision, United Nations (2017).
With rapid demographic changes over the past 20 years, the closely related labor market has
also experienced significant changes. With the Taiwanese society experiencing population aging and
sub-replacement fertility, the ratio of the youth workforce to total population continues to decline,
while that of individuals aged 55 years and above is increasing (see Figure 2). Numerous studies
explore the impact of population aging on productivity and economic development. Aiyar et al. [1],
for example, find that workforce aging in Europe negatively impacts the economic growth rate.
Similarly, Bloom et al. [2] and Maestas et al. [3] suggest that population aging negatively affects
economic growth in Asia and the United States. By contrast, Börsch-Supan and Weiss [4] state that
while aging employees tend to commit more mistakes, there is no visible decline in their productivity.
Likewise, Burtless [5] indicates that aging employees help increase productivity. Prettner [6] notes
that whether extended life expectancy negatively impacts economic growth is dependent on the
relative value of the death and birth rates. In sum, the literature offers inconsistent conclusions. This
study aims to address this inconsistency by investigating the impact of population aging and human
resources aging on Taiwan’s economy.
Figure 1. Run chart of age groups as a percentage of Taiwan’s total population. Source: National
Statistics, Republic of China (Taiwan), website: www.stat.gov.tw/mp.asp?mp=4.
Table 1. Time trend for global population aging.
Country
Population Aged 65 and Above (% of Total)
7% 10% 14% 20%
Taiwan 1993 2006 2018 2026
Japan 1970 1984 1994 2005
South Korea 1999 2007 2017 2026
Singapore 1999 2012 2018 2026
China 2000 2016 2025 2035
France 1864 1943 1990 2019
Germany 1932 1951 1971 2008
United
Kingdom
1929 1946 1975 2026
United States 1942 1972 2013 2029
Canada 1945 1984 2010 2024
Source: World Population Prospects: The 2017 Revision, United Nations (2017).
With rapid demographic changes over the past 20 years, the closely related labor market has
also experienced significant changes. With the Taiwanese society experiencing population aging and
sub-replacement fertility, the ratio of the youth workforce to total population continues to decline, while
that of individuals aged 55 years and above is increasing (see Figure 2). Numerous studies explore the
impact of population aging on productivity and economic development. Aiyar et al. [1], for example,
find that workforce aging in Europe negatively impacts the economic growth rate. Similarly, Bloom
et al. [2] and Maestas et al. [3] suggest that population aging negatively affects economic growth in
Asia and the United States. By contrast, Börsch-Supan and Weiss [4] state that while aging employees
tend to commit more mistakes, there is no visible decline in their productivity. Likewise, Burtless [5]
indicates that aging employees help increase productivity. Prettner [6] notes that whether extended
life expectancy negatively impacts economic growth is dependent on the relative value of the death
and birth rates. In sum, the literature offers inconsistent conclusions. This study aims to address
this inconsistency by investigating the impact of population aging and human resources aging on
Taiwan’s economy.
The continued increase in Taiwan’s elderly population has made the government and society
aware of the age group’s need for medical care, welfare, and long-term care. In 2008, the Taiwanese
government implemented the first generation of the ten-year long-term care plan, and in 2017, it
initiated the second generation of the plan, also referred to as Long-Term Care 2.0. The objectives of
the policy are to combine public and private resources at all levels and integrate resources for medical
care, long-term care, and preventive healthcare to perfect community care systems and mechanisms
and create qualitative, affordable, and accessible long-term care services.
This study empirically analyzes 1981–2017 data published by the Taiwanese government
(e.g., PC-AXIS database) and related entities including the Department of Household Registration
Affairs, Ministry of the Interior; Department of Statistics, Ministry of Health and Welfare; and
Directorate-General of Budget, Accounting and Statistics, Executive Yuan. The analysis focus on the](https://image.slidesharecdn.com/taiwancasesustainability-11-06301-v2-210315034416/85/Taiwan-case-sustainability-11-06301-v2-2-320.jpg)
![Sustainability 2019, 11, 6301 3 of 13
impact of workforce aging and the population dependency ratio on economic growth, the primary
channel through which population and workforce aging impacts economic growth, and the influence
of government policies for eldercare and medical expenses on economic growth. The results show that
an aging workforce is significantly and positively related to GDP growth rate. A decomposition of the
dependency ratio suggests that the old-age dependency ratio has a significantly negative effect, while
the youth dependency ratio has no significant effect. Since productivity is an accumulation of different
economic factors [7,8], this study decomposes productivity into real capital, human capital, and total
factor productivity (TFP). The empirical findings indicate that human capital is essential for total factor
productivity (TFP) growth and that an aging workforce and population mainly impact productivity
through TFP. In addition, the integration of policy factors into the model shows that increasing the
supply of eldercare workforce and foreign manpower contributed to counter the negative impact
caused by population aging on national economic growth.
Sustainability 2019, 11, x FOR PEER REVIEW 3 of 14
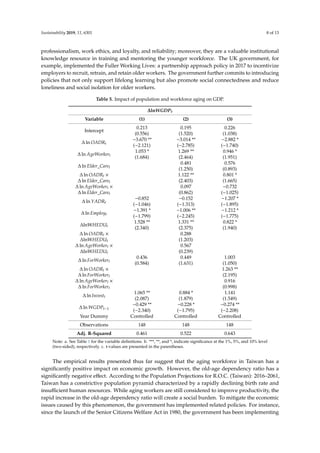
Figure 2. Run chart of the workforce for various age groups as a percentage of the total workforce.
Source: Directorate-General of Budget, Accounting and Statistics, Executive Yuan, website:
www.dgbas.gov.tw/.
The continued increase in Taiwan’s elderly population has made the government and society
aware of the age group’s need for medical care, welfare, and long-term care. In 2008, the Taiwanese
government implemented the first generation of the ten-year long-term care plan, and in 2017, it
initiated the second generation of the plan, also referred to as Long-Term Care 2.0. The objectives of
the policy are to combine public and private resources at all levels and integrate resources for medical
care, long-term care, and preventive healthcare to perfect community care systems and mechanisms
and create qualitative, affordable, and accessible long-term care services.
This study empirically analyzes 1981–2017 data published by the Taiwanese government (e.g.,
PC-AXIS database) and related entities including the Department of Household Registration Affairs,
Ministry of the Interior; Department of Statistics, Ministry of Health and Welfare; and Directorate-
General of Budget, Accounting and Statistics, Executive Yuan. The analysis focus on the impact of
workforce aging and the population dependency ratio on economic growth, the primary channel
through which population and workforce aging impacts economic growth, and the influence of
government policies for eldercare and medical expenses on economic growth. The results show that
an aging workforce is significantly and positively related to GDP growth rate. A decomposition of
the dependency ratio suggests that the old-age dependency ratio has a significantly negative effect,
while the youth dependency ratio has no significant effect. Since productivity is an accumulation of
different economic factors [7,8], this study decomposes productivity into real capital, human capital,
and total factor productivity (TFP). The empirical findings indicate that human capital is essential for
total factor productivity (TFP) growth and that an aging workforce and population mainly impact
productivity through TFP. In addition, the integration of policy factors into the model shows that
increasing the supply of eldercare workforce and foreign manpower contributed to counter the
negative impact caused by population aging on national economic growth.
This remainder of this paper is organized as follows. Section 2 reviews the literature on
population and workforce aging. Section 3 describes the research design, including the data and
empirical models used in this study. Section 4 discusses the empirical results and analysis. Section 5
provides concluding remarks.
2. Literature Review
There are several discussions on the ambiguous effect of population aging on productivity and
economic growth. Lindh and Malmberg [9] analyze 1950–1990 data for OECD countries and find that
workers aged 50–64 years help increase productivity, workforce members aged 65 years and above
negatively impact productivity, and the younger workforce has no significant impact on
productivity. Aiyar et al.’s [1] cross-country empirical research analyzes the impact of labor force
aging on workforce productivity using OECD data for 28 European countries from 1950 to 2014. Their
results suggest that an increasing proportion of employees aged 55–64 years significantly reduces
Figure 2. Run chart of the workforce for various age groups as a percentage of the total workforce. Source:
Directorate-General of Budget, Accounting and Statistics, Executive Yuan, website: www.dgbas.gov.tw/.
This remainder of this paper is organized as follows. Section 2 reviews the literature on population
and workforce aging. Section 3 describes the research design, including the data and empirical
models used in this study. Section 4 discusses the empirical results and analysis. Section 5 provides
concluding remarks.
2. Literature Review
There are several discussions on the ambiguous effect of population aging on productivity and
economic growth. Lindh and Malmberg [9] analyze 1950–1990 data for OECD countries and find that
workers aged 50–64 years help increase productivity, workforce members aged 65 years and above
negatively impact productivity, and the younger workforce has no significant impact on productivity.
Aiyar et al.’s [1] cross-country empirical research analyzes the impact of labor force aging on workforce
productivity using OECD data for 28 European countries from 1950 to 2014. Their results suggest
that an increasing proportion of employees aged 55–64 years significantly reduces total productivity,
while the old-age dependency ratio and the young-age dependency ratio have no significant impact.
Manabu and Hosoyama [10] indicate that population aging leads to a reduction in the growth rate of
the labor force and capital stock (due to the reduction of savings rate). And, the accompanied situation
is a downward pressure on the real return to physical capital, and upward pressure on real wage rates.
They conclude the demographic shock leads to an increase in tax and pension burdens, decreases net
economic welfare, and negatively affects the economic growth rate. Furthermore, they suggest that the
government could make adjustments to important elements of pension systems (e.g., raise the saving
incentives and saving rate) and could mitigate negative impacts of population aging and improve
economic welfare for future generations. Batini et al. [11] suggest that population aging could reduce
aggregate growth in the United States, Japan, and other industrial countries; however, it contributes
to the economic growth of developing countries as the relative size of their working-age population
increases. Bloom et al. [2] analyze the impact of demographic changes on economic growth in Asia](https://image.slidesharecdn.com/taiwancasesustainability-11-06301-v2-210315034416/85/Taiwan-case-sustainability-11-06301-v2-3-320.jpg)
![Sustainability 2019, 11, 6301 4 of 13
from 1960 to 2005. Their results reveal that while the young-age dependency ratio has a significant
and positive impact on economic growth, the old-age dependency ratio has a significantly negative
effect on short-term economic growth but an insignificantly negative effect on long-term growth.
They analyze the various behavioral responses that come with the shift in age structure: an increase in
female labor force participation as fertility declines, an increase in savings, and an increase in education.
These factors act together and may offset any negative effects of a shift in the age structure; thus,
an insignificant effect of rising elderly shares on economic performance has been observed.
Prettner [6] points out that a shift in age structure results in a shift of resources to RD and
consequently fosters per capita output growth. When intertemporal knowledge spillovers are strong,
the growth effect would be long-lasting. He proposes that ongoing demographic changes do not
necessarily hamper technological progress and, therefore, economic prosperity. Simultaneously
decreasing birth and death rates can even lead to an increase in the economic growth rate. Similar
insights are provided by Aksoy et al. [12]. They provide empirical evidence of the link between
demographic structure and innovation activity. The patent application is positively affected by
middle-aged cohorts (working-age cohorts) and negatively by retirees. The innovation activities can
serve as a channel, being particularly important for generating reduced long-term output growth due
to aging.
From labor supply and human capital accumulation perspectives, Burtless [5] shows that in the
United States, the productivity of workers aged 60–74 years is not lower than that of those aged
25–59 years. He concludes that workers with lower productivity exit the workforce at a younger age,
while more productive ones remain in the workforce into old age. Lee and Mason [13] also highlight the
linkage between human capital investments and economic growth. They propose that as fertility falls in
other Asian countries, spending per child will rise, with beneficial effects for future labor productivity
and economic growth. To some degree, the population aging effects are reserved as the quality of labor
will be substituted for quantity of labor. Börsch-Supan and Weiss [4] examine productivity data for a
large-scale car assembly plant in Germany and conclude that employees continue to report increasing
productivity until the age of 60 years. In addition, even in environments requiring intensive physical
work, the decline in the physical ability of aging workers is compensated for by traits that appear
to increase with age, such as the experience and ability to function within a team in high-pressure
situations. Bloom et al. [14] indicate that increased longevity—a key driver of population aging—can
change life-cycle behavior, leading to a longer working life, higher savings, and more investment in
human capital. Benhabib and Spiegel [15] find that human capital positively influences TFP growth.
Human capital not only facilitates domestic technological innovation but also speeds up the adoption
of foreign technology. In addition, human capital can serve as an agent in attracting physical capital
accumulation. Panda [16] indicates the positive externalities associated with college education on
TFP growth and provides insights related to the importance of schooling. Lee and Mason [13] also
highlight the linkage between human capital investments and economic growth. They propose that as
fertility falls in other Asian countries, spending per child will rise, with beneficial effects for future
labor productivity and economic growth. To some degree, the quality of labor will be substituted for
quantity of labor. Chanda and Panda [17] confirm the positive role of human capital contributing to
higher productivity growth.
From the foreign manpower perspectives, Hui and Hashi [18] identify that foreign labor and
immigration are major contributions to population and economic growth in Singapore. Harper [19]
proposes that immigration has the potential to prevent population decline, maintain the size of the
labor force (and thus the support ratio), and slow population aging. There are also the indirect effects
of migration on innovation, economic growth, employment, and welfare. Felbermayr et al. [20],
Jaumotte et al. [21], Boubtane et al. [22], Borjas [23], Aleksynska and Tritah [24] also point out
that immigrants’ human capital can mitigate domestic labor shortage level and positively impact
economic growth.](https://image.slidesharecdn.com/taiwancasesustainability-11-06301-v2-210315034416/85/Taiwan-case-sustainability-11-06301-v2-4-320.jpg)
![Sustainability 2019, 11, 6301 5 of 13
Bloom et al. [14] suggest the important roles played by the policy and institutional environment
in determining the economic growth effects of population aging. Aiyar et al. [1] propose that policies,
such as increasing effective access to healthcare services, improving vocational training, and boosting
innovation activities, can help mitigate the negative productivity impact of an aging workforce.
Vogel et al. [25] address three adjustment channels, i.e., investing abroad, endogenous human capital
formation, and increasing the retirement age, that can mitigate the detrimental effects of aging.
Combining endogenous human capital formation with an increasing retirement age could reduce the
welfare loss of population aging.
3. Research Design
3.1. Data and Variable Definitions
This study examines Taiwan quarterly data from 1981 to 2017. Data sources include the PC-AXIS
database and other information publicly available on government websites, as well as reports published
by the Directorate-General of Budget, Accounting and Statistics, Executive Yuan; Department of
Household Registration, Ministry of the Interior; and Department of Statistics, Ministry of Health and
Welfare. Table 2 reports the variable definitions and data sources.
Table 2. Variable Definitions.
Variable Definition Source
WGDP
Gross Domestic Product (GDP) per worker
Unit: NT$/person
Source: Directorate-General of Budget, Accounting and Statistics, Executive Yuan
AgeWorker
Ratio of workers aged 55–64 years to total workforce in Taiwan
Unit: %
Source: Directorate-General of Budget, Accounting and Statistics, Executive Yuan
OADR YADR
Old-age dependency ratio: population aged 65 years and above divided by population aged
15–64 years
Youth dependency ratio: population aged 0–14 years divided by the population aged 15–64 years
Unit: %
Source: Department of Household Registration of the Ministry of the Interior
TFP
Total factor productivity index
Unit: 2001 as base period, 100 as base period index
Source: Directorate-General of Budget, Accounting and Statistics, Executive Yuan
KW
Net capital per worker: net capital divided by employed population
Unit: NT$/person
Source: Directorate-General of Budget, Accounting and Statistics, Executive Yuan
WHEDU
Ratio of workforce with college or higher education to total workforce
Unit: %
Source: Department of Statistics of the Ministry of the Interior
Invest
Ratio of gross investment to GDP
Unit: %
Source: Directorate-General of Budget, Accounting and Statistics, Executive Yuan
Elder_Care
Number of workers served in elderly long-term care, nursing, and caring institutions divided by
total nursing staff
Unit: %
Source: Department of Statistics, Ministry of Health and Welfare
Employ
Employment rate: ratio of employed population to working age (15–64 years) population
Unit: %
Source: Directorate-General of Budget, Accounting and Statistics, Executive Yuan
ForWorker
Ratio of foreign workers with residency to total workforce
Unit: %
Source: National Immigration Agency, Ministry of Interior
3.2. Empirical Model
This study examines the impact of Taiwan’s aging society on its economic growth rate by using
the old-age dependency ratio (ODAR) and aging workforce (AgeWorker) as proxies for population
and workforce aging. We conduct an empirical regression analysis on time series data for 1981–2017](https://image.slidesharecdn.com/taiwancasesustainability-11-06301-v2-210315034416/85/Taiwan-case-sustainability-11-06301-v2-5-320.jpg)
![Sustainability 2019, 11, 6301 6 of 13
and employ the ordinary least squares method. Given the annual variance in total population
and its potential effects, the analysis uses the national average real GDP per worker as a proxy
for economic productivity. In the regression model, ∆lnWGDP is the first-order differential for the
natural logarithm of WGDP (the same applies to all other variables). Previous research highlights
that healthcare policies could address growing concerns related to an aging society (e.g., [1]). Thus,
this analysis adopts the eldercare workforce (Elder_Care) to proxy the policy effect. To observe the
mediating effect of policies related to an aging population and workforce, the interaction terms
Elder_Care·OADR and Elder_Care·AgeWorker are included in the model.
Taiwan, as most developed and developing countries, is confronted with the problem of declining
fertility rates and an aging population in recent years. This phenomenon means the pool of domestic
labor supply growth is shrinking. To address the demographic challenges of an aging population, the
Taiwan government relax restrictions and implement immigration and foreign labor policies to attract
foreign manpower. Many studies document the impact of immigration and foreign labor on economic
growth. (e.g., [18,20,21,23,24]). We adopt the ratio of foreign workers with residency (ForWorker) to
capture the foreign manpower effect.
In addition, this study controls for several determinants of economic growth, including the
youth dependency ratio (YADR), employment rate (Employ), ratio of workforce with college or higher
educational attainment (WHEDU), investment rate (Invest), and previous year ∆lnWGDP (∆lnWGDPt-1).
The empirical model is as follows:
∆ ln WGDPt = β0 + β1∆ ln OADRt + β2∆ ln AgeWorkert + β3Elder_Caret
+β4Elder_Caret × ∆ ln OADRt + β5 Elder_Caret × ∆ ln AgeWorkert
+β6ForWorkert + β7ForWorkert × ∆ ln OADRt + β8 ForWorkert × ∆ ln AgeWorkert
+ Control variablest + εt.
(1)
4. Empirical Results and Analysis
4.1. Results of Unit Root Tests
The results of unit root tests are reported in Table 3. We implement the augmented Dickey–Fuller
(ADF) [26], Phillips–Perron (PP) [27], and Kwiatkowski–Phillips–Schmidt–Shin (KPSS) [28] tests. In the
level form, the ADF, PP, and KPSS tests all indicate the time series is non-stationary for all the variables
except for Invest. We transform variables into first-order differential forms and the results of unit root
tests confirm the stationarity at the first differences.
Table 3. Results of augmented Dickey–Fuller (ADF), Phillips–Perron (PP), and Kwiatkowski–
Phillips–Schmidt–Shin (KPSS) unit root tests.
Variable
Levels First-Differences
ADF PP KPSS ADF PP KPSS
WGDP −0.890 −0.713 1.053 *** −6.043 *** −6.043 *** 0.313
AgeWorker −1.902 −2.153 0.917 *** −6.554 *** −5.696 *** 0.706
OADR −0.907 −0.868 1.233 *** −3.012 ** −2.641 * 0.695
Elder_Care −1.133 −1.204 1.104 *** −4.178 *** −5.530 *** 0.572
YADR −1.106 −1.502 0.871 *** −4.253 *** −4.277 *** 0.641
Employ −2.451 −2.026 0.948 *** −7.037 *** −6.625 *** 0.250
TFP −1.045 −1.057 1.146 *** −5.938 *** −6.219 *** 0.636
KW −1.454 −1.693 0.939 *** −3.836 *** −4.762 *** 0.578
WHEDU −1.601 −1.821 1.360 *** −4.577 *** −4.974 *** 0.629
Invest −5.728 *** −5.619 *** 0.254 − − −
ForWorker −1.327 −1.477 0.903 *** −3.219 *** −3.874 *** 0.223
Note: a. See Table 1 for the variable definitions. b. All variables are in natural logarithm forms. c. ***, **, and
*, indicate significance at the 1%, 5%, and 10% level respectively. d. For the ADF and PP tests, Ho = Variable is
non-stationary. For the KPSS test, Ho = Variable is stationary.](https://image.slidesharecdn.com/taiwancasesustainability-11-06301-v2-210315034416/85/Taiwan-case-sustainability-11-06301-v2-6-320.jpg)
![Sustainability 2019, 11, 6301 7 of 13
4.2. Descriptive Statistics
Table 4 presents the descriptive statistics for all the variables employed in this research. The mean
of the quarterly real GDP per worker (WGDP) is NT $217,345, and it ranges between NT $82,433 and
NT $364,239 with a median of NT $221,978. During the sample period, from 1981 to 2017, the quarterly
ratio of workers aged 55–64 years and above to the total workforce (AgeWorker) reports a minimum
value of 6.61% in the fourth quarter of 2002 and a maximum value of 13.20% in the fourth quarter of
2017. The old-age dependency ratio (OADR) shows an increasing pattern with rising life expectancy,
whereas the youth dependency ratio (YADR) indicates a substantially decreasing trend with a declining
fertility rate. The ratio of the eldercare workforce demonstrates a continually increasing trend over the
research period. Table 3 presents AgeWorker, OADR, YADR, Elder_Care, Employ, WHEDU, Invest, and
ForWorker as ratios, and thus, the values are relatively small. The values for the remaining economic
variables, that is, WGDP and KW, are relatively large. To reduce the variation in the numerical scale,
the analysis employs the natural logarithm for these variables to enhance homogeneity.
Table 4. Descriptive statistics.
Variable Unit Mean Median Std. Dev. Min Max
WGDP NT$ 217,345 221,978 87,851 82,433 364,239
AgeWorker % 8.85 8.56 1.74 6.61 13.20
OADR % 13.47 13.88 2.71 6.90 18.89
Elder_Care % 13.23 14.85 3.58 4.66 16.86
YADR % 26.98 25.30 8.24 17.98 49.45
Employ % 58.59 58.45 0.94 56.92 61.52
TFP index 97.42 100.00 9.46 79.99 109.49
KW NT$ 417,499 380,774 175,920 194,856 726,844
WHEDU % 38.45 39.14 8.42 24.90 50.20
Invest % 24.53 24.61 2.81 19.91 30.40
ForWorker % 3.46 3.22 0.98 1.67 5.73
Note: See Table 1 for the variable definitions.
4.3. Regression Analysis: Impact of Population and Workforce Aging on GDP
Table 5 reports the results of regressing the aging population and workforce on GDP. In column
(1), the significantly positive coefficient for ∆ ln AgeWorker indicates that individuals aged 55 years
and above in the workforce positively contribute to the GDP growth rate in Taiwan. The negative
coefficient for the rate of change in the old-age dependency ratio (∆ lnOADR) shows that the increasing
aging population might slow down economic development.
Life expectancy in Taiwan has been steadily increasing over the decades. The longer the lifespan,
the greater the incentive for workers to increase the number of work years. The ratio of workers aged
55–64 years shows an upward trend in recent years. Prior research documents that a continually
aging workforce could be detrimental to economic productivity (e.g., [1,2,10,11]). By contrast, our
empirical results reveal that workforce aging does not have a negative impact, but a beneficial one, and
is consistent with insights of Börsch-Supan and Weiss [4] and Malmberg and Halvarsson [29] indicate
that older workforce influence and enhance the ability to learn among both young and prime-age
workers. This creates a kind of learning-by-seeing or learning-by-interacting relationship between
workers of different age groups and is good for productivity. Börsch-Supan and Weiss [4] show that
the average age-productivity profile of individual workers is increasing until age 65. They point out
the older worker’ experience is the crucial characteristic that keeps their productivity from falling and
suggest that older workers are especially able to grasp difficult situations in vital tasks. Despite the
preconceived notions and myths about an elderly workforce, a growing number of management and
HR professionals believe older employees positively contribute to an organization’s development goals.
According to surveys conducted by Paullin [30] and the Transamerica Center for Retirement Studies [31],
the most frequently mentioned advantages of having older employees are greater wisdom and maturity,](https://image.slidesharecdn.com/taiwancasesustainability-11-06301-v2-210315034416/85/Taiwan-case-sustainability-11-06301-v2-7-320.jpg)
![Sustainability 2019, 11, 6301 9 of 13
welfare and care policies targeted at the elderly. The National Health Insurance (NHI) set up in
1995 covers medical expenses such as elderly care and has helped further improve the quality of
healthcare and reduced the burden on families. In 2008, the Cabinet introduced a 10-year program to
transform the nation’s long-term care system. This plan has led to the implementation of Taiwan’s first
national-level, long-term care network for the elderly. In 2017, the Taiwanese government initiated the
second generation of the plan, Long-Term Care 2.0., that greatly expands the scope of services provided
by the government to care for the elderly. The changes to eldercare are aimed at easing the burden for
more seniors and their families while generating greater efficiencies. Column (2) includes the eldercare
workforce ratio (Elder_Care) to proxy the eldercare policy effect. To analyze the effectiveness of this
policy implemented to address population aging, the interaction term ∆ ln OADRt × ∆ ln Elder_Caret is
included in the regression model.
The significantly positive coefficient for the interaction term ∆ ln OADRt × ∆ ln Elder_Caret
highlights that the expanding long-term care for the elderly can significantly mitigate the negative
impact of a high old-age dependency ratio. Long-Term Care 2.0 implemented in 2017 by the Ministry
of Health and Welfare prioritizes eldercare with the objective of expanding and improving existing
in-home care services. Traditionally, offspring are expected to care for their elders; however, work
schedules and the lack of healthcare knowledge and professional abilities tend to be hindering factors.
In-home care can compensate for the dearth of caregivers during the day and offspring’s work schedule,
allowing the elderly to live in their own homes instead of unfamiliar environments.
In column (3), we adopt the ratio of foreign workers with residency (ForWorker) to capture
the foreign manpower effect. From the significantly positive coefficient on the interaction term
∆ ln OADRt × ∆ ln ForWorkert, we find that introducing immigration and foreign labor force can
partially address the negative impact of population aging. Hui and Hashi [18] identify that foreign
labor and immigration are major contributions to population and economic growth in Singapore.
Harper (2014) proposed that immigration has the potential to prevent population decline, maintain
the size of the labor force (and thus the support ratio), and slow population aging. There are also the
indirect effects of migration on innovation, economic growth, employment, and welfare. Felbermayr
et al. [20], Jaumotte et al. [21], Boubtane et al. [22], Borjas [23], Aleksynska and Tritah [24] also point
out that immigrants’ human capital can mitigate domestic labor shortage level and positively impact
economic growth.
4.4. Regression Analysis: Channels Through which Population and Workforce Aging Impact GDP
To further explore the various channels through which population and workforce aging impact
the real output, an aggregate production function is employed to facilitate the empirical analysis. Hall
and Jones [8] incorporate the concept of human capital in the Solow growth model [7] and extend
the production function as Yt = Kα
t (AtHt)1−α
„ where At and Ht denote the TFP index and human
capital index in period t. Dividing both sides of the equation by total labor produces yt = kα
t (Atht)1−α
,
for which the natural logarithm is as follows:
lnyt = (1 − α) ln At + α ln kt + (1 − α) ln ht. (2)
As shown in equation (2), the real output is a result of accumulations from various channels.
The analysis employs the national average real GDP per worker, WGDP, to measure real output, y. A is
the TFP index; k measures the average net real capital per worker, KW; and h is average human capital,
WHEDU. The domestic population with a tertiary or higher education is used as a proxy for human
capital level.
∆ ln Channelt = γ0 + γ1 ∆ ln OADRt + γ2∆ ln AgeWorkert + γ4∆ ln Channelt−1
+Control variablest + τt.
(3)](https://image.slidesharecdn.com/taiwancasesustainability-11-06301-v2-210315034416/85/Taiwan-case-sustainability-11-06301-v2-9-320.jpg)
![Sustainability 2019, 11, 6301 10 of 13
Since real output is accumulated from various channels, this analysis isolates each channel as
a dependent variable to observe the relationship among the individual channel, AgeWorker, and the
old-dependency ratio. Table 6 reports the regression results. Column (1) presents the results for WGDP
listed in Table 5 and columns (2)–(4) decompose the impact into TFP, net capital per worker (KW), and
human capital (WHEDU). In column (2), the coefficient for ∆ ln AgeWorkert is significantly positive
and, thus, an increase in the aging worker ratio may enhance TFP growth. Aksoy et al. [12] find that
innovation activities are positively affected by middle-aged workers, not young workers. The reason
might be middle-aged workers have accumulated adequate knowledge, practical experience, and
professionalism. Columns (3) and (4) show significantly negative and insignificant coefficients for
∆ ln AgeWorkert. This result suggests that the main channel through which aging workers can improve
the GDP growth rate is an enhancement in TFP growth. We also find that the ratio of workforce with
college or higher education attainment positively related to economic and TFP growth rate. The TFP
index is a productivity index that measures the ratio of total output to total factor input. This ratio
is based on technological progress, innovation, specialization, and efficiency improvement. Chanda
and Panda [17] confirm the positive role of human capital contributing to higher productivity growth.
Benhabib and Spiegel [15] point out that human capital positively influences TFP growth through
facilitating domestic technological innovation and accelerating the adoption of foreign technology.
Panda [16] suggests the importance of education on TFP growth. Lee and Mason [13] also highlight
the linkage between human capital investments and economic growth. They propose that declining
birth rate might boost the spending per child and have beneficial effects for future labor productivity
and economic growth.
Table 6. Channels through which population and workforce aging impact GDP.
Variable
∆lnChannelt
∆lnWGDPt ∆lnTFPt ∆lnKWt ∆lnWHEDUt
(1) (2) (3) (4)
Intercept
0.213
(0.556)
0.115
(0.332)
0.262 ***
(3.009)
0.500 ***
(2.869)
∆ ln OADRt
−3.670 **
(−2.121)
−1.681 *
(−1.827)
−0.233 **
(−2.018)
−1.612 **
(−2.147)
∆ ln AgeWorkert
1.053 *
(1.684)
0.564 *
(1.713)
−0.146 *
(−1.673)
0.276
(0.381)
∆ ln YADRt
−0.852
(−1.046)
−0.455 *
(−1.740)
1.219 **
(2.138)
1.541 *
(1.775)
∆ ln Employt
−1.391 *
(−1.799)
−1.006 *
(−1.851)
−1.927
(−1.002)
0.898
(0.203)
∆lnWHEDUt
1.528 **
(2.340)
0.976 **
(2.290)
2.532
(0.042)
∆ ln Investt
1.065 **
(2.087)
0.883 *
(1.667)
0.549 ***
(2.927)
0.019
(0.051)
∆ ln ForWorkert
0.436
(0.584)
0.352
(0.406)
1.108 *
(1.776)
0.317
(1.202)
∆ ln Channelt−1
−0.429 **
(−2.340)
−1.203 **
(−2.312)
0.135 *
(1.751)
1.158 ***
(4.443)
Observations 148 37 37 148
Adj. R-squared 0.461 0.240 0.635 0.187
Note: a. See Table 1 for the variable definitions. b. ***, **, and *, indicate significance at 1%, 5%, and 10% levels
(two-sided), respectively. c. t-values are presented in the parentheses. d. The observations decrease because only
data for the annual indexes of TFP and annual KW are made available by the government.
5. Conclusions
This research aims to analyze the impact of Taiwan’s aging population and aging workforce on
its economic growth. In particular, it examines the impact of an aging workforce and the old-age](https://image.slidesharecdn.com/taiwancasesustainability-11-06301-v2-210315034416/85/Taiwan-case-sustainability-11-06301-v2-10-320.jpg)
![Sustainability 2019, 11, 6301 12 of 13
raise the participation rate of middle-aged citizens. For the elderly workforce, the government should
implement policies such as reducing restrictions through a Regular Contract for elderly citizens of
more than 65 years old, subsidizing the employer who hires or re-employs elderly retirees, expanding
the subsidy scope for employment facilitation, and establishing a human resource database of retirees.
All these measures are expected to enhance re-employment for the elderly population. Fifth, as
indicated by Bloom et al. [14], to address the funding gap caused by the intergenerational transfers
implicit pension systems is an important policy consideration. Pay-as-you-go pension systems mean
that an increasingly small share of working-age people will make transfers to an increasingly large
share of the elderly. Policies that can help reduce social burden include adjusting premiums and
benefits or making a transition to full funded systems, whereby individuals effectively draw at least
part of their pensions from investments made during their time in work. Coping with an aged society
will require a concerted effort that includes comprehensive pension restructuring by the government,
calculated savings and investment strategies by the aging and elderly, support from the working-age
population, and coordinated measures from financial-planning industries. More education is needed
on the importance of investment and savings for old age. Finally, improvements in the quality of
elder healthcare and related social welfare programs must become an essential aspect of a national
social security system. Policymakers should thoroughly review and develop policies that address the
changing demographic needs.
Author Contributions: Conceptualization, W.-H.H., Y.-J.L., and H.-F.L.; methodology, W.-H.H. and H.-F.L.;
software, W.-H.H. and Y.-J.L.; resources, W.-H.H.; writing—original draft preparation, W.-H.H., Y.-J.L., and H.-F.L.;
writing—review and editing, W.-H.H., Y.-J.L., and H.-F.L.
Funding: This research received no external funding.
Acknowledgments: We thank “Higher Education Sprout Project” of the National Taichung University of Science
and Technology and the Ministry of Education, Taiwan, R.O.C for manuscript editing. We are grateful to two
anonymous reviewers for their insightful comments and suggestions.
Conflicts of Interest: The authors declare no conflict of interest.
References
1. Aiyar, S.; Ebeke, C.; Shao, X. The Impact of Workforce Aging on European Productivity; IMF Working Paper No.
16/238; IMF: Washington, DC, USA, 2016.
2. Bloom, D.E.; Canning, D.; Finlay, J.E. Population Aging and Economic Growth in Asia. The Economic
Consequences of Demographic Change in East Asia. NBER-EASE 2010, 19, 61–89.
3. Maestas, N.; Mullen, K.J.; Powell, D. The Effect of Population Aging on Economic Growth, the Labor Force and
Productivity; NBER Working Paper No. w22452; NBER: Cambridge, MA, USA, 2016.
4. Börsch-Supan, A.; Weiss, M. Productivity and Age: Evidence from Work Teams at the Assembly Line. J. Econ.
Ageing 2016, 19, 30–42. [CrossRef]
5. Burtless, G. The Impact of Population Aging and Delayed Retirement on Workforce Productivity; Center for
Retirement Research at Boston College Working Paper No. 2013-11; Center for Retirement Research, Boston
College: Newton, MA, USA, 2013.
6. Prettner, K. Population Aging and Endogenous Economic Growth. J. Popul. Econ. 2013, 26, 811–834.
[CrossRef]
7. Solow, R.M. A Contribution to the Theory of Economic Growth. Q. J. Econ. 1956, 70, 65–94. [CrossRef]
8. Hall, R.E.; Jones, C.I. Why Do Some Countries Produce So Much More Output Per Worker than Others? Q. J.
Econ. 1999, 114, 83–116. [CrossRef]
9. Lindh, T.; Malmberg, B. Age Structure Effects and Growth in the OECD, 1950–1990. J. Popul. Econ. 1999, 12,
431–449. [CrossRef]
10. Manabu, S.; Hosoyama, H. Economic Implications of An Aging Population: The Case of Five Asian Economies;
ESRI Discussion paper series 117; Economic and Social Research Institute (ESRI): Dublin, Ireland, 2004.
11. Batini, N.; Callen, T.; McKibbin, W.J. The Global Impact of Demographic Change; IMF Working Paper 06/9; IMF:
Washington, DC, USA, 2006.](https://image.slidesharecdn.com/taiwancasesustainability-11-06301-v2-210315034416/85/Taiwan-case-sustainability-11-06301-v2-12-320.jpg)
![Sustainability 2019, 11, 6301 13 of 13
12. Aksoy, Y.; Basso, H.S.; Smith, R.P.; Grasl, T. Demographic Structure and Macroeconomic Trends. Am. Econ. J.
Macroecon. 2019, 11, 193–222. [CrossRef]
13. Lee, R.; Mason, A. Fertility, human capital, and economic growth over the demographic transition. Eur. J.
Popul. 2010, 26, 159–182. [CrossRef]
14. Bloom, D.E.; Canning, D.; Fink, G. Implications of population ageing for economic growth. Oxf. Rev. Econ.
Policy. 2010, 26, 583–612. [CrossRef]
15. Benhabib, J.; Spiegel, M.M. The role of human capital in economic development evidence from aggregate
cross-country data. J. Mon. Econ. 1994, 34, 143–173. [CrossRef]
16. Panda, B. Schooling and productivity growth: Evidence from a dual growth accounting application to U.S.
states. J. Prod. Anal. 2017, 48, 193–221. [CrossRef]
17. Chanda, A.; Panda, B. Productivity Growth in Goods and Services Across the Heterogeneous States of
America. Econ. Inq. 2016, 54, 1021–1045. [CrossRef]
18. Hui, W.T.; Hashmi, A.R. Foreign labor and economic growth policy options for Singapore. Singap. Econ. Rev.
2007, 52, 53–72. [CrossRef]
19. Harper, S. Economic and social implications of aging societies. Science 2014, 346, 587–591. [CrossRef]
20. Felbermayr, G.J.; Hiller, S.; Sala, D. Does immigration boost per capita income? Econ. Lett. 2010, 107, 177–179.
[CrossRef]
21. Jaumotte, F.; Koloskova, K.; Saxena, S.C. Impact of Migration on Income Levels in Advanced Economies; IMF
Spillover Notes, No. 8; IMF: Washington, DC, USA, 2016.
22. Boubtane, E.; Dumont, J.C.; Rault, C. Immigration and economic growth in the OECD countries, 1986–2006.
Oxf. Econ. Pap. 2016, 68, 340–360. [CrossRef]
23. Borjas, G.J. Immigration and Economic Growth; NBER Working Paper No. w25836; National Bureau of
Economic Research: Cambridge, MA, USA, 2019.
24. Aleksynska, M.; Tritah, A. The heterogeneity of immigrants, host countries’ income and productivity:
A channel accounting approach. Econ. Inq. 2015, 53, 150–172. [CrossRef]
25. Vogel, E.; Ludwig, A.; Börsch-Supan, A. Aging and Pension Reform: Extending the Retirement Age and
Human Capital Formation. J. Pension Econ. Financ. 2017, 16, 81–107. [CrossRef]
26. Said, E.; Dickey, D.A. Testing for Unit Roots in Autoregressive Moving Average Models of Unknown Order.
Biometrika 1984, 71, 599–607. [CrossRef]
27. Phillips, P.C.B.; Perron, P. Testing for unit root in time series regression. Biometrika 1988, 75, 335–346.
[CrossRef]
28. Kwiatkowski, D.; Phillips, P.; Schmidt, P.; Shin, Y. Testing the null hypothesis of stationary against the
alternative of a unit root. J. Econmet. 1992, 54, 159–178. [CrossRef]
29. Malmberg, B.; Lindh, T.; Halvarsson, M. Productivity consequences of workforce ageing: Stagnation or
horndal effect? Popul. Dev. Rev. 2008, 34, 238–256.
30. Paullin, C. The Aging Workforce: Leveraging the Talents of Mature Employees. Effective Practice Guidelines Series;
SHRM: Alexandria, VA, USA, 2014.
31. Transamerica Institute. A Compendium of Findings about American Employers-15th Annual Transamerica
Retirement Survey; The TCRS: Nashville, TN, USA, 2014.
© 2019 by the authors. Licensee MDPI, Basel, Switzerland. This article is an open access
article distributed under the terms and conditions of the Creative Commons Attribution
(CC BY) license (http://creativecommons.org/licenses/by/4.0/).](https://image.slidesharecdn.com/taiwancasesustainability-11-06301-v2-210315034416/85/Taiwan-case-sustainability-11-06301-v2-13-320.jpg)


