Download to read offline
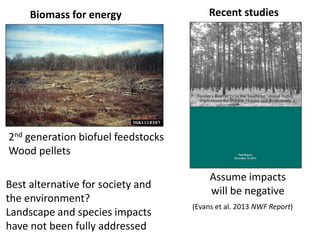
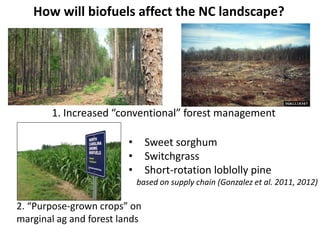
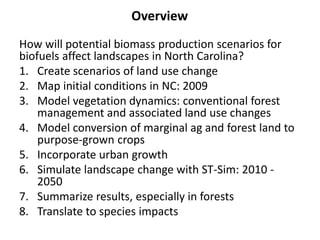
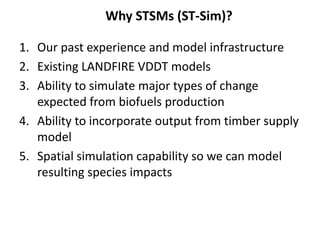
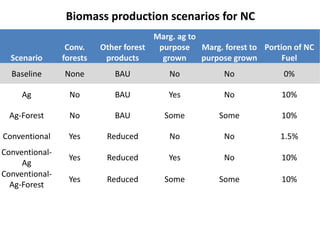
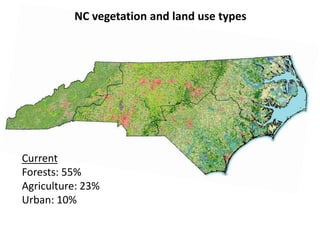
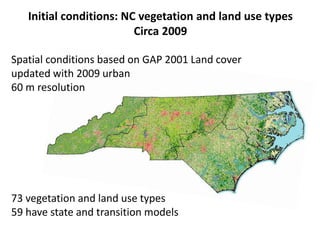
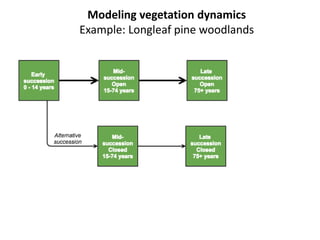
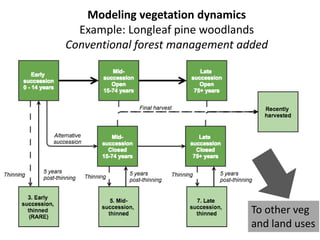
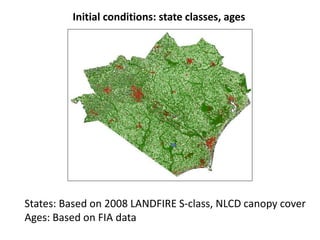
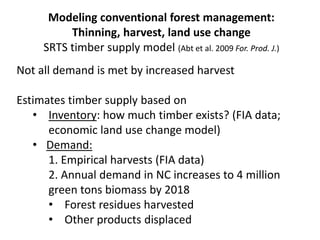
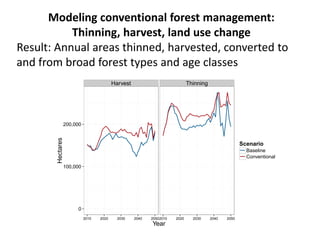
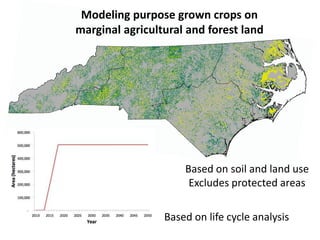
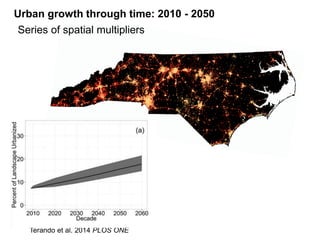

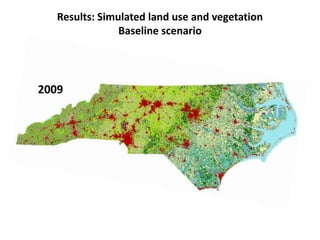
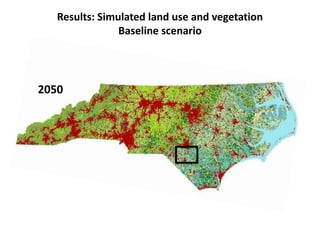
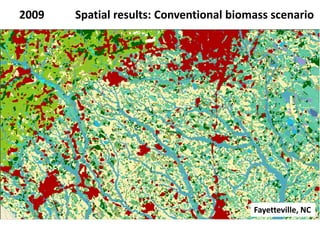
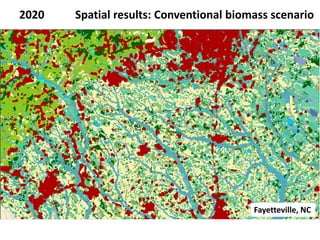
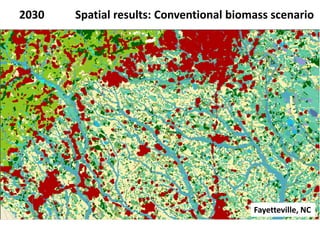
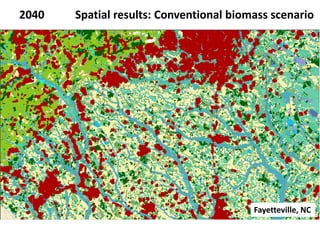
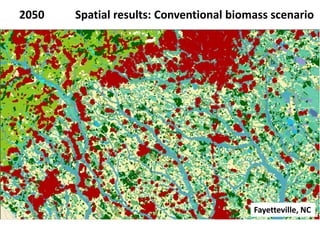
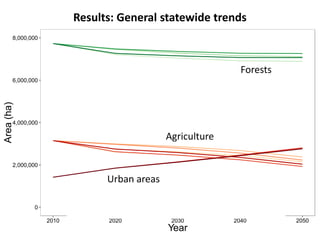
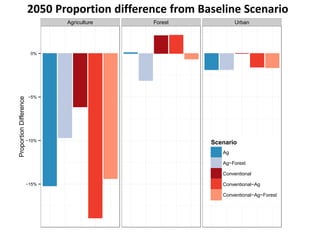
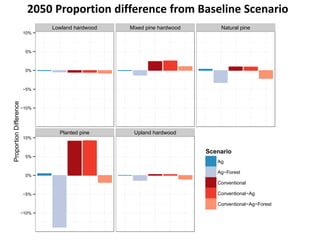
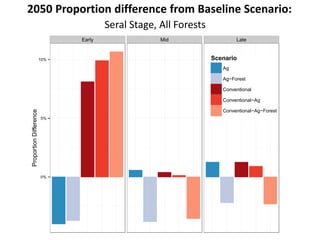
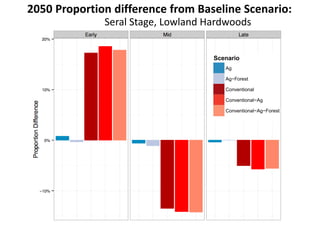
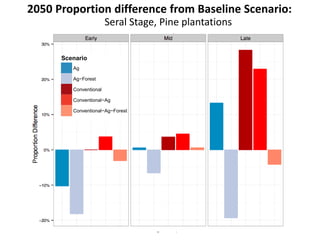
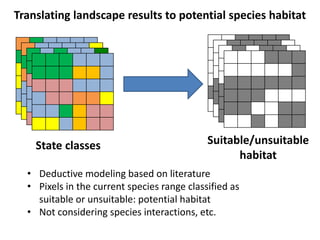
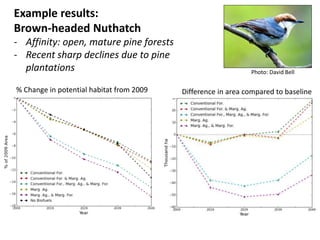
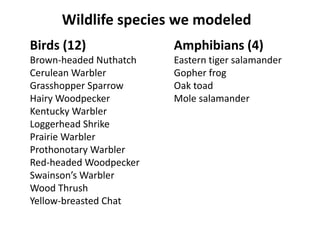
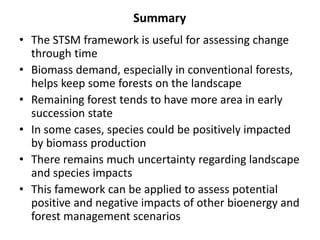

The document evaluates the landscape impacts of potential bioenergy production scenarios in North Carolina through modeling land-use changes and vegetation dynamics over time, specifically from 2009 to 2050. It highlights the necessity of understanding how biomass production may affect forest management practices and wildlife habitats, noting both positive and uncertain implications for species. Using a state-and-transition simulation model (STSM), the study aims to assess and summarize these environmental changes and their potential impacts.


![Polymer [ बहुलक ] Chemistry Notes PDF - Irfanullah Mehar - JJ Sir Chemistry.pdf](https://cdn.slidesharecdn.com/ss_thumbnails/polymerchemistrynotespdf-irfanullahmehar-jjsirchemistry-260210172118-3f9b37f7-thumbnail.jpg?width=640&height=640&fit=bounds)


