Startup Metrics, a love story. All slides of an 6h Lean Analytics workshop.
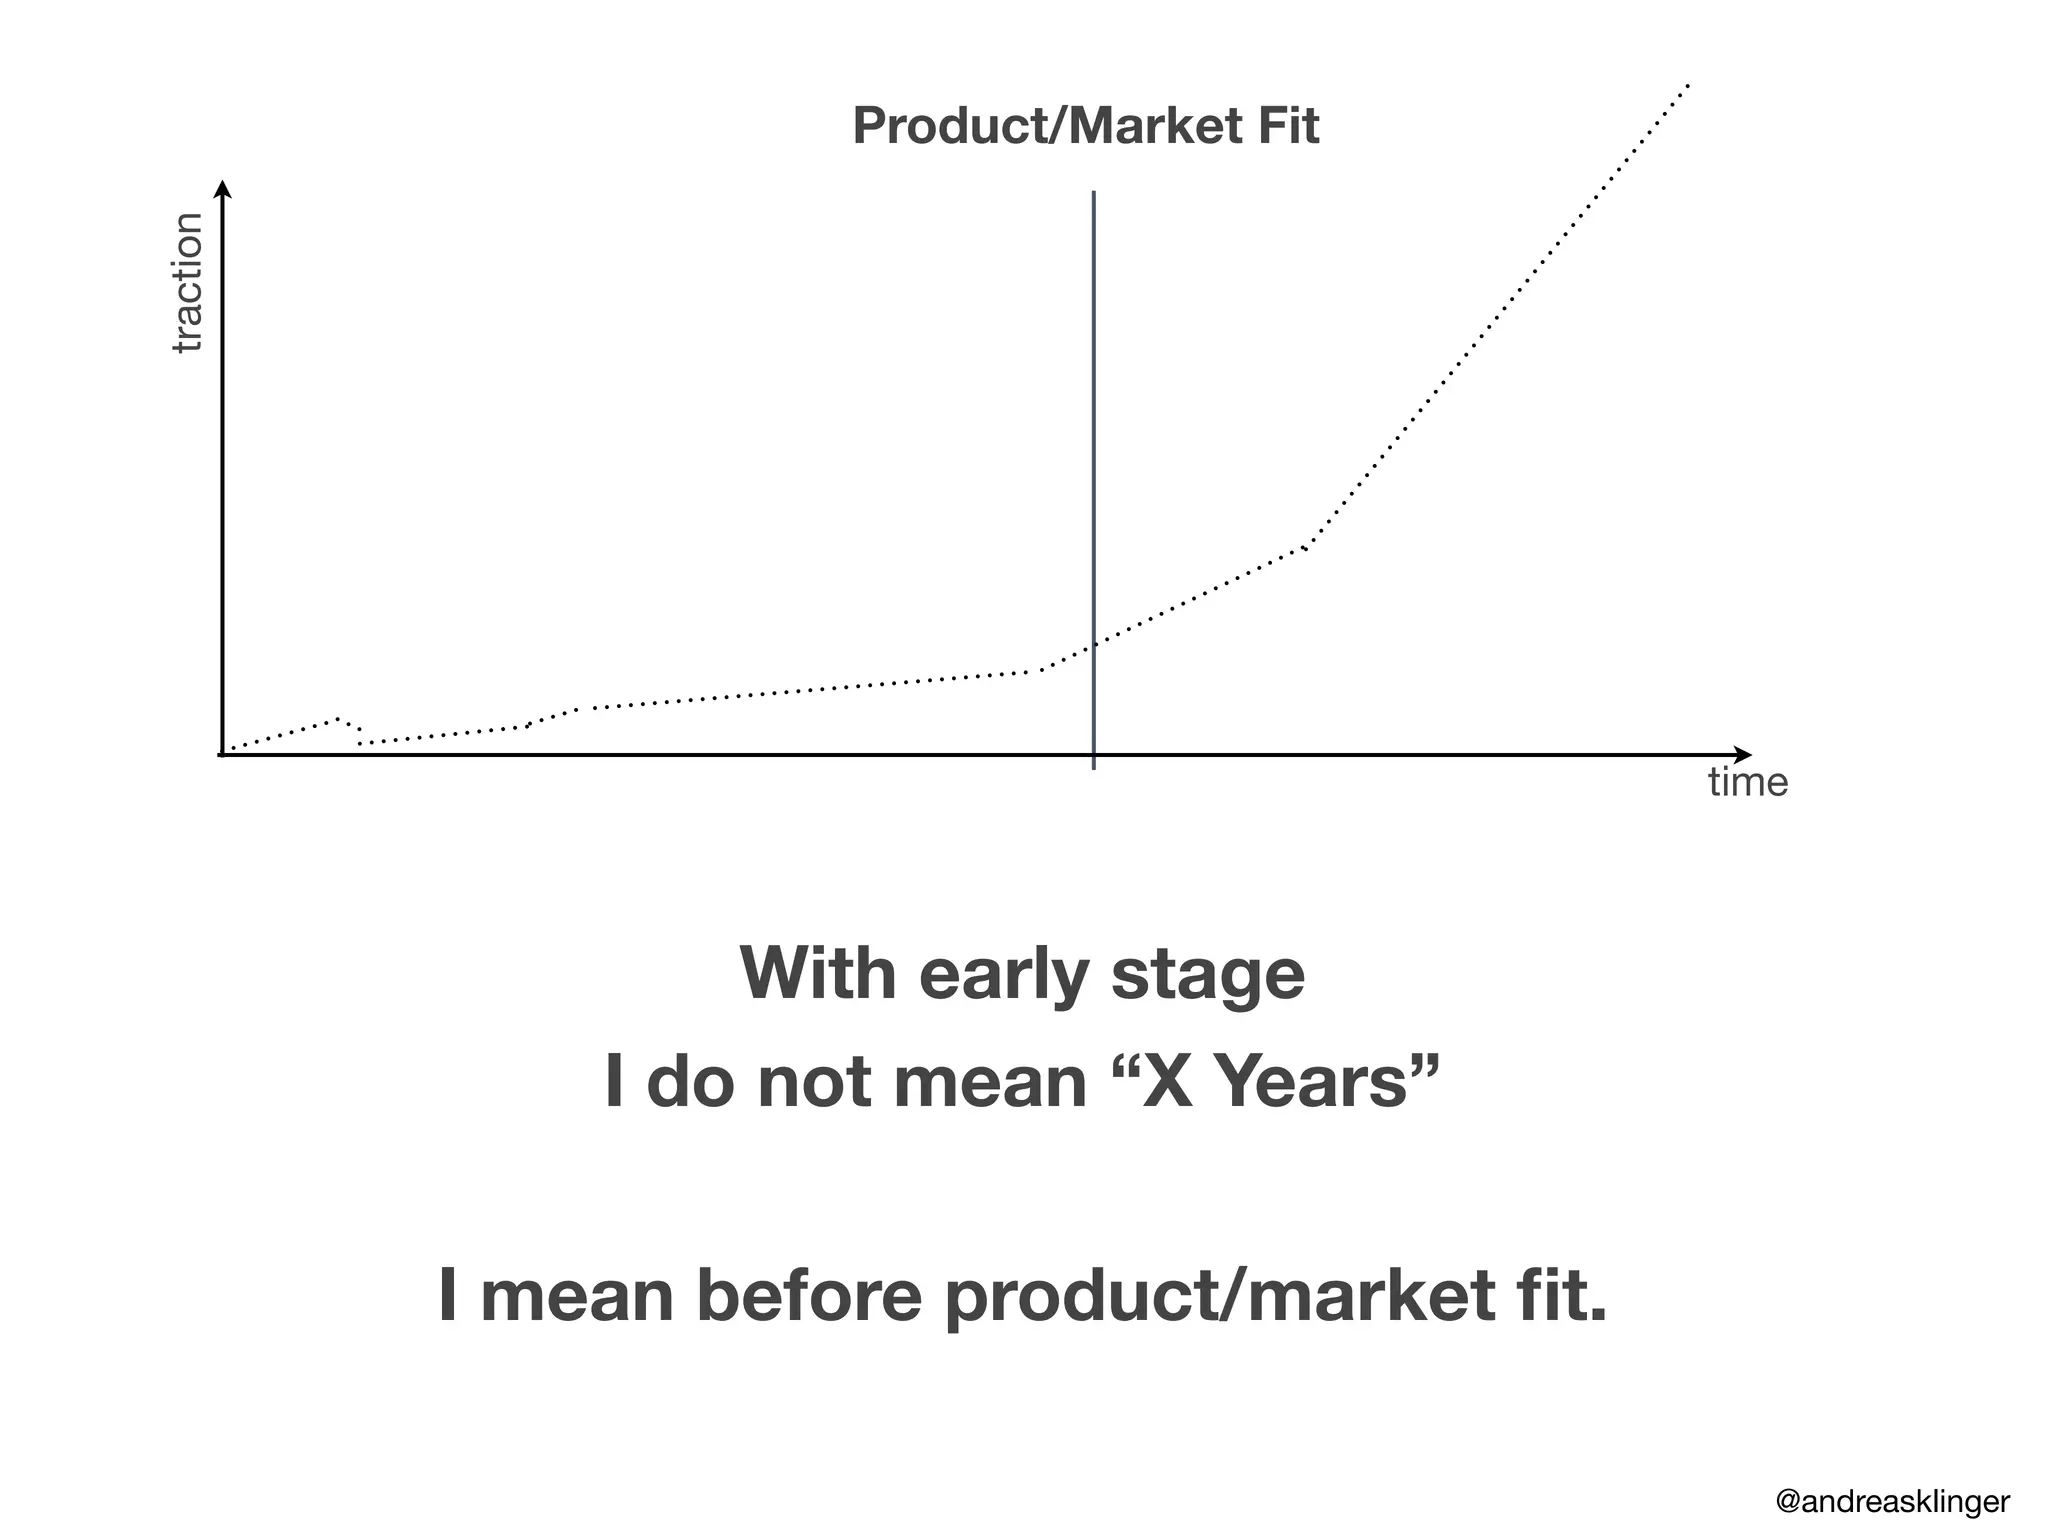
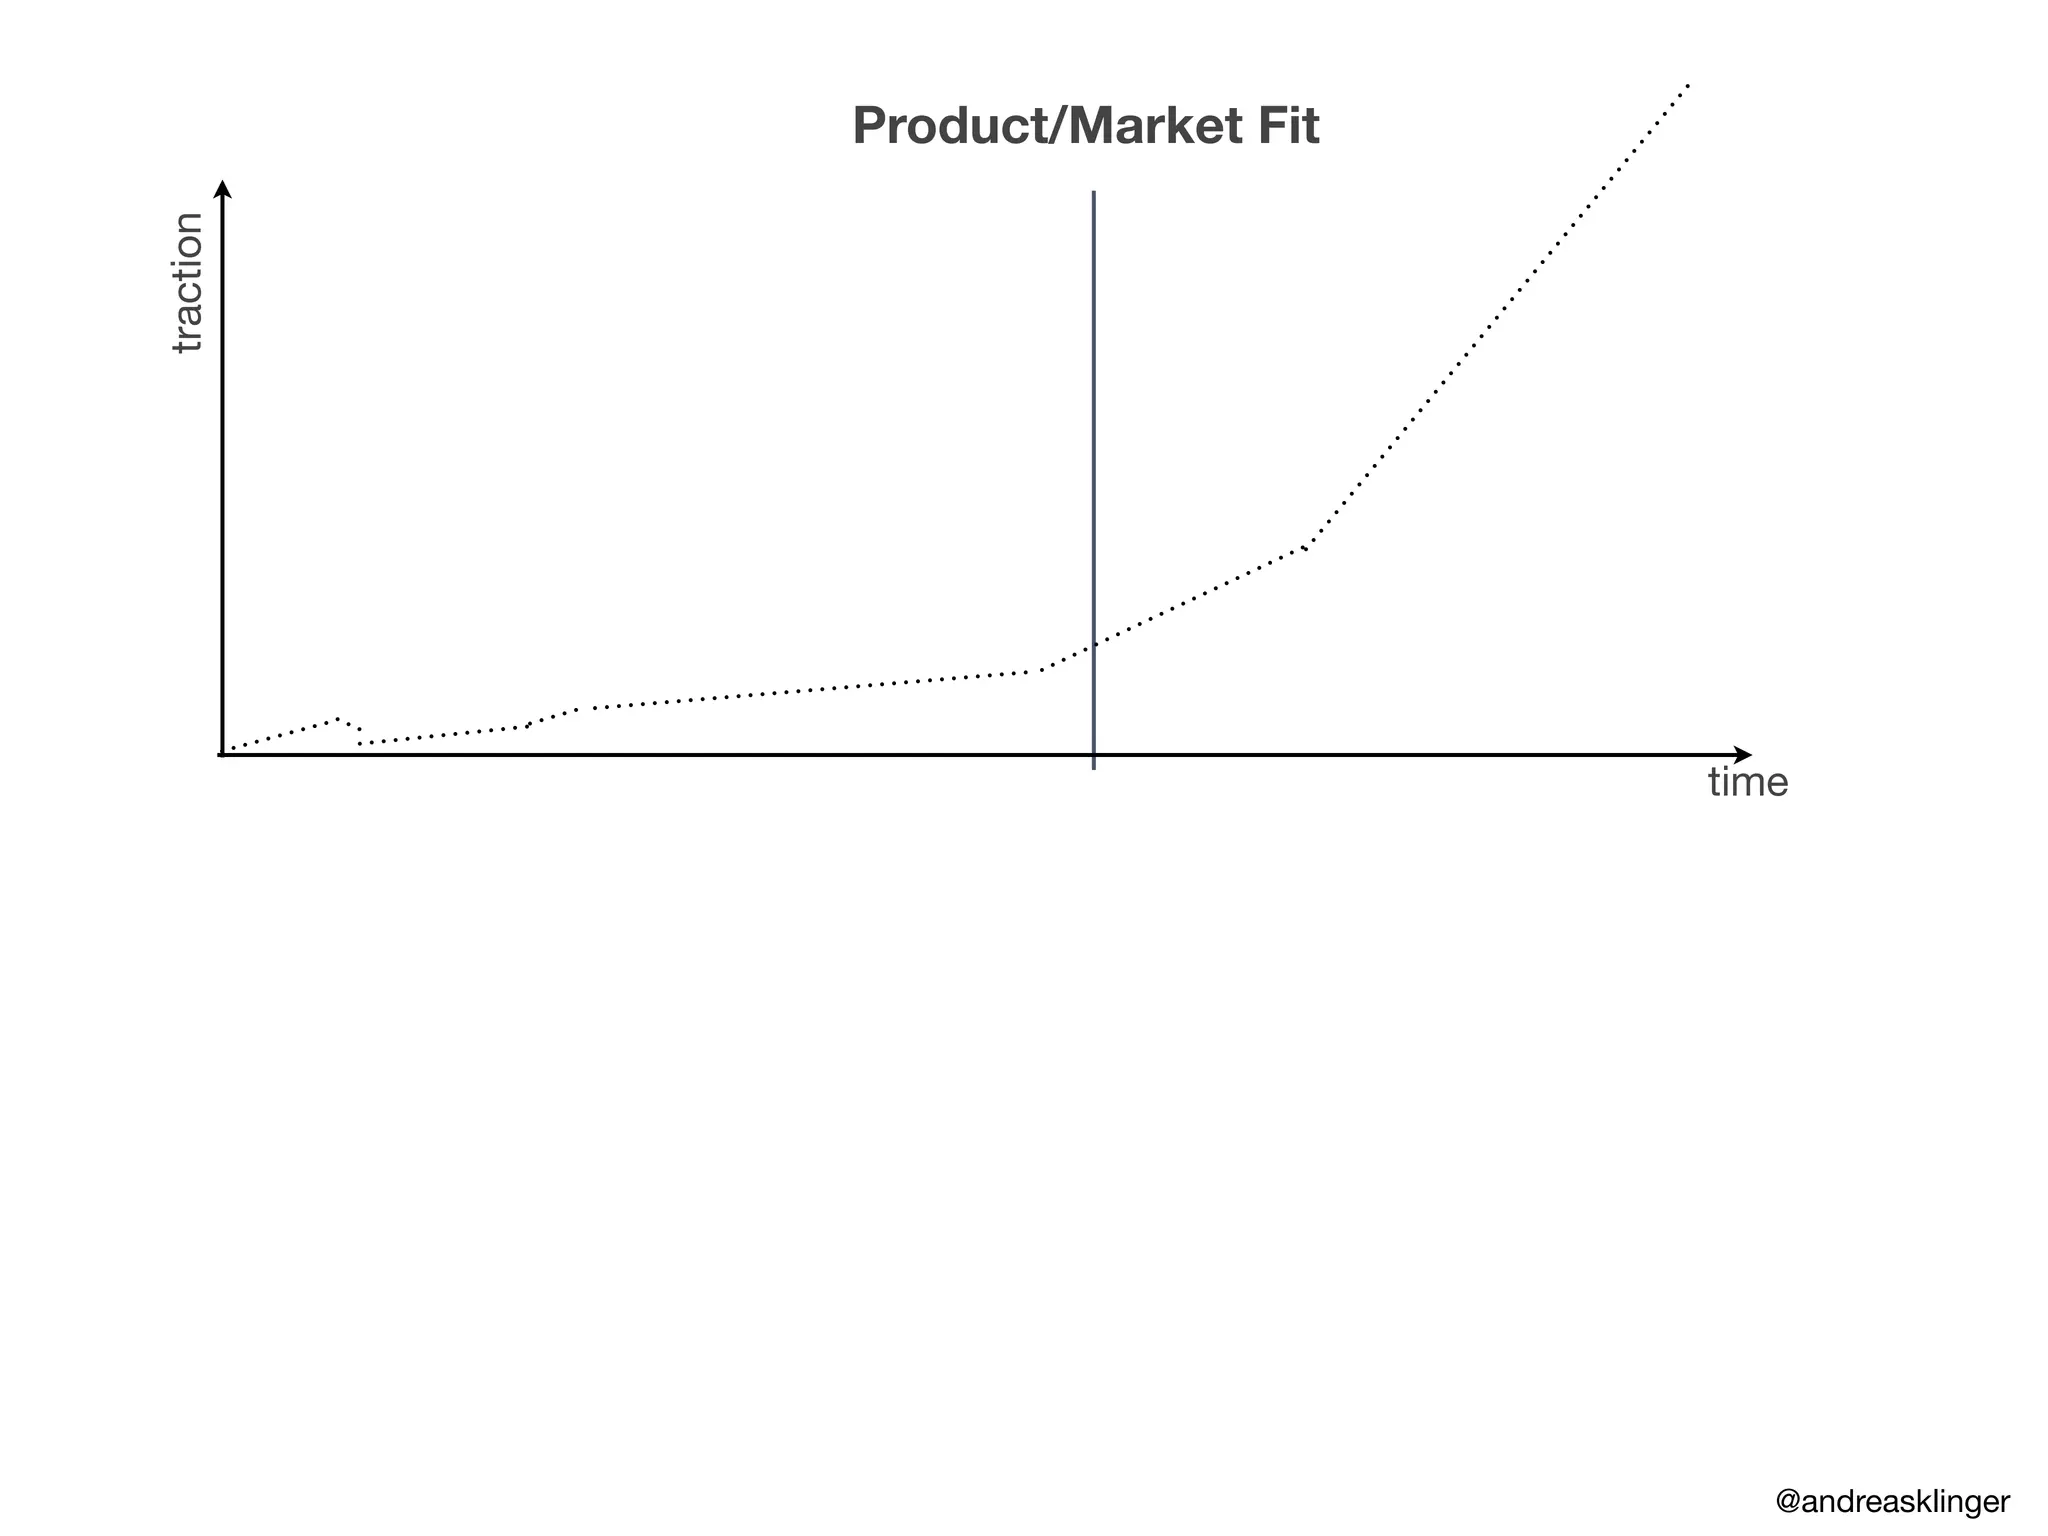
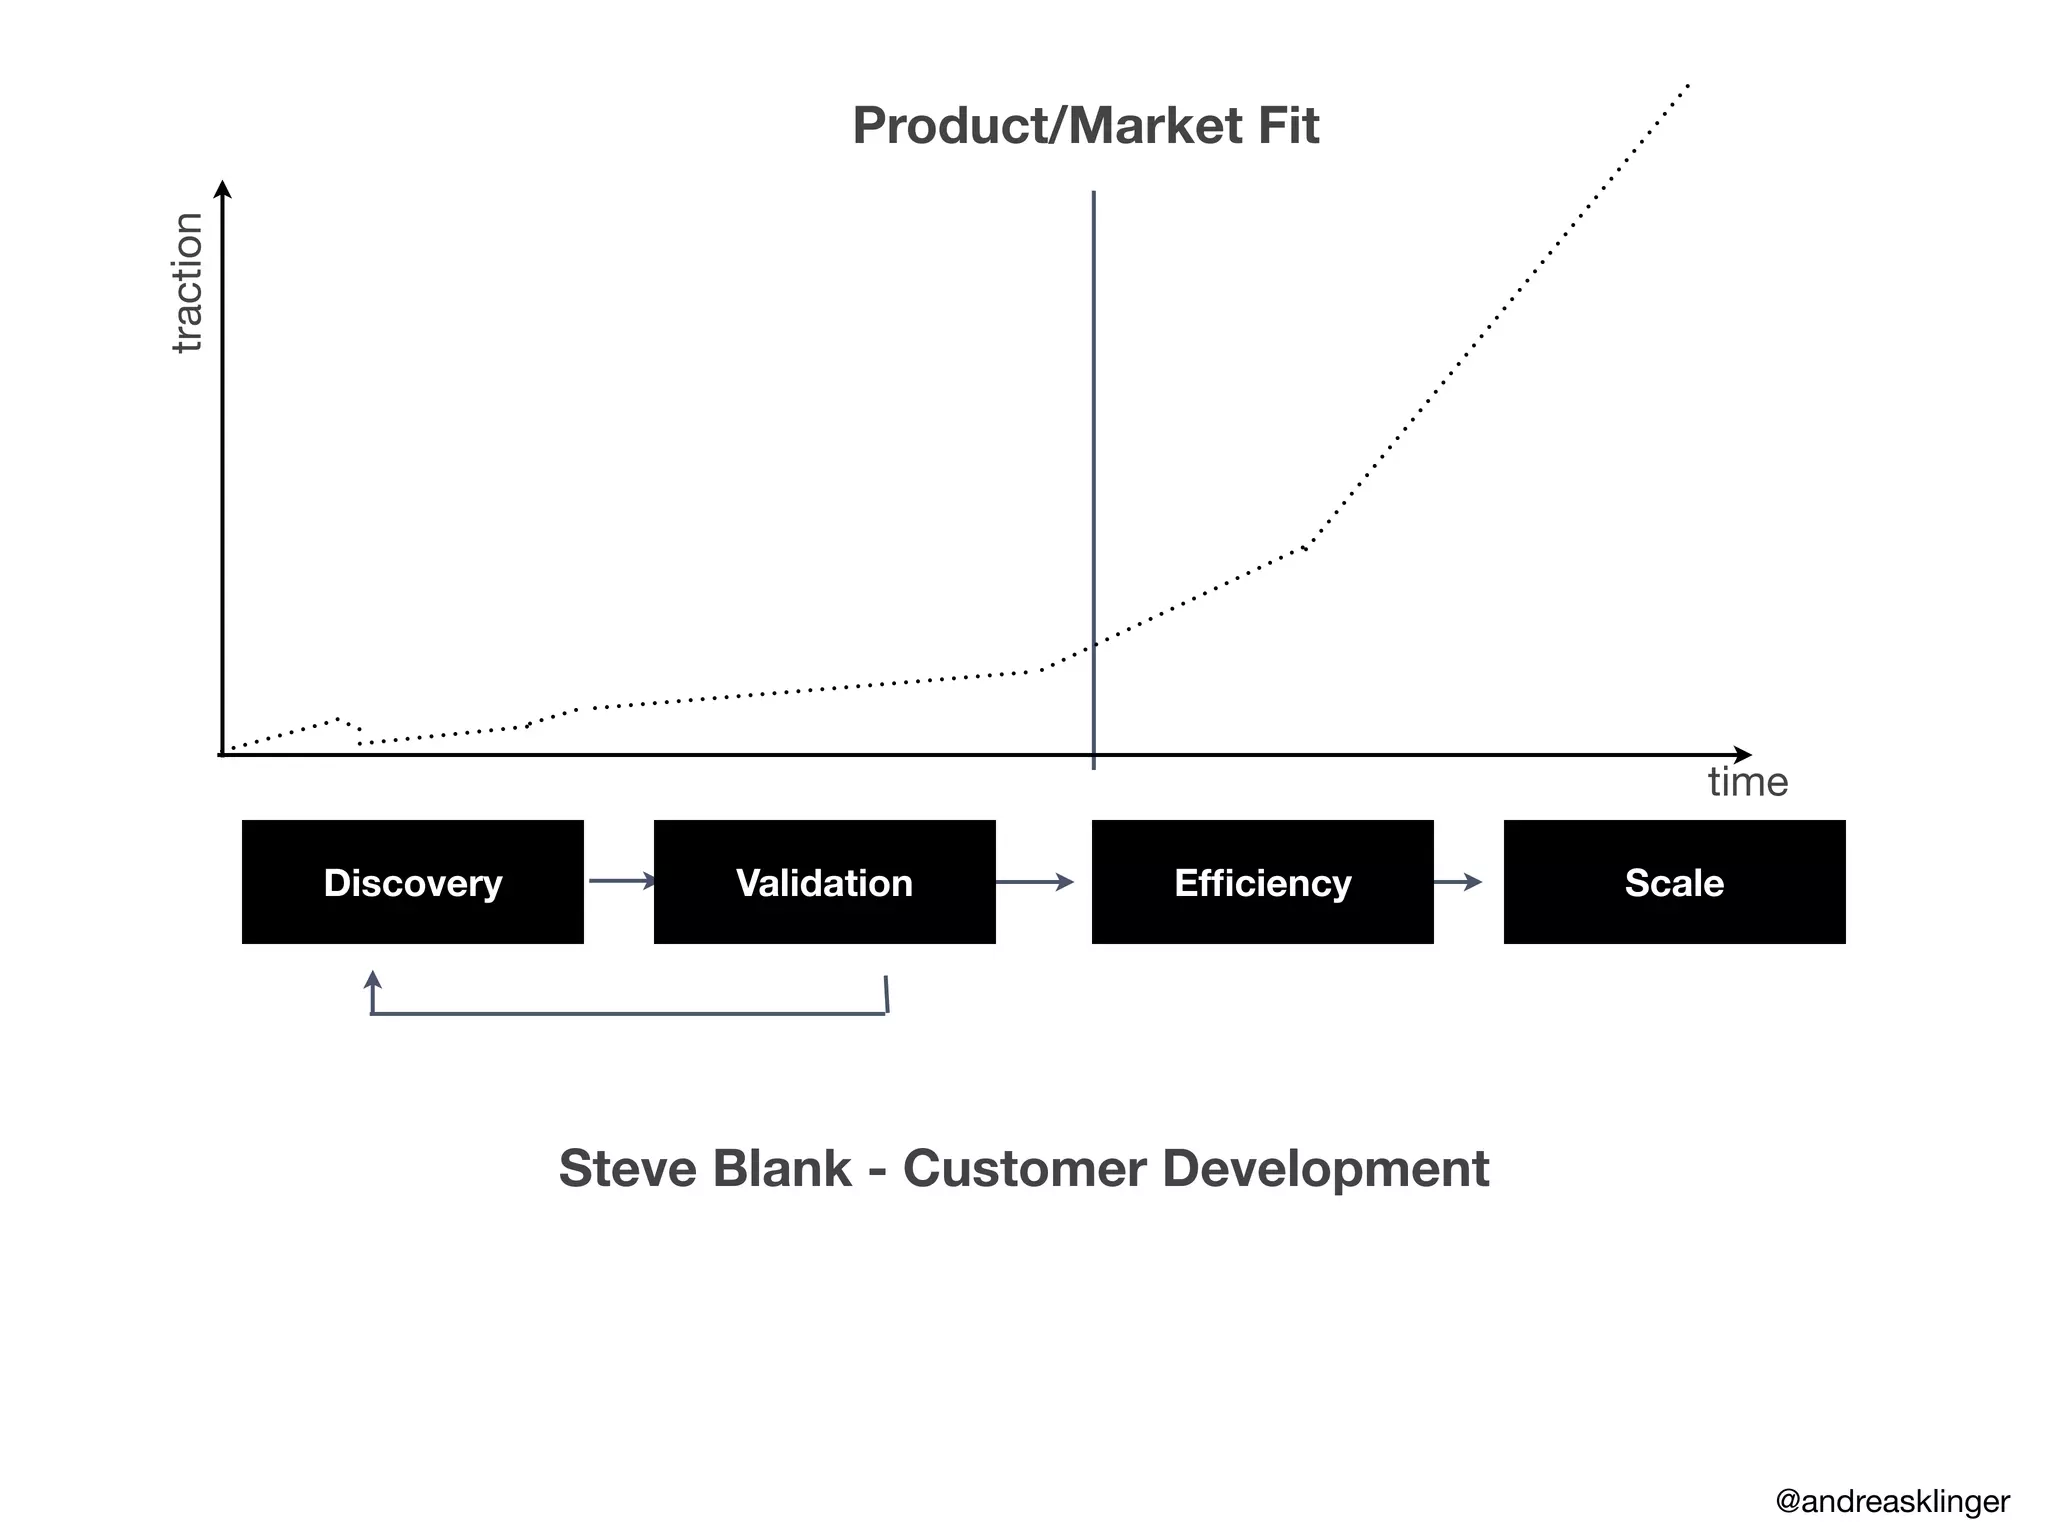
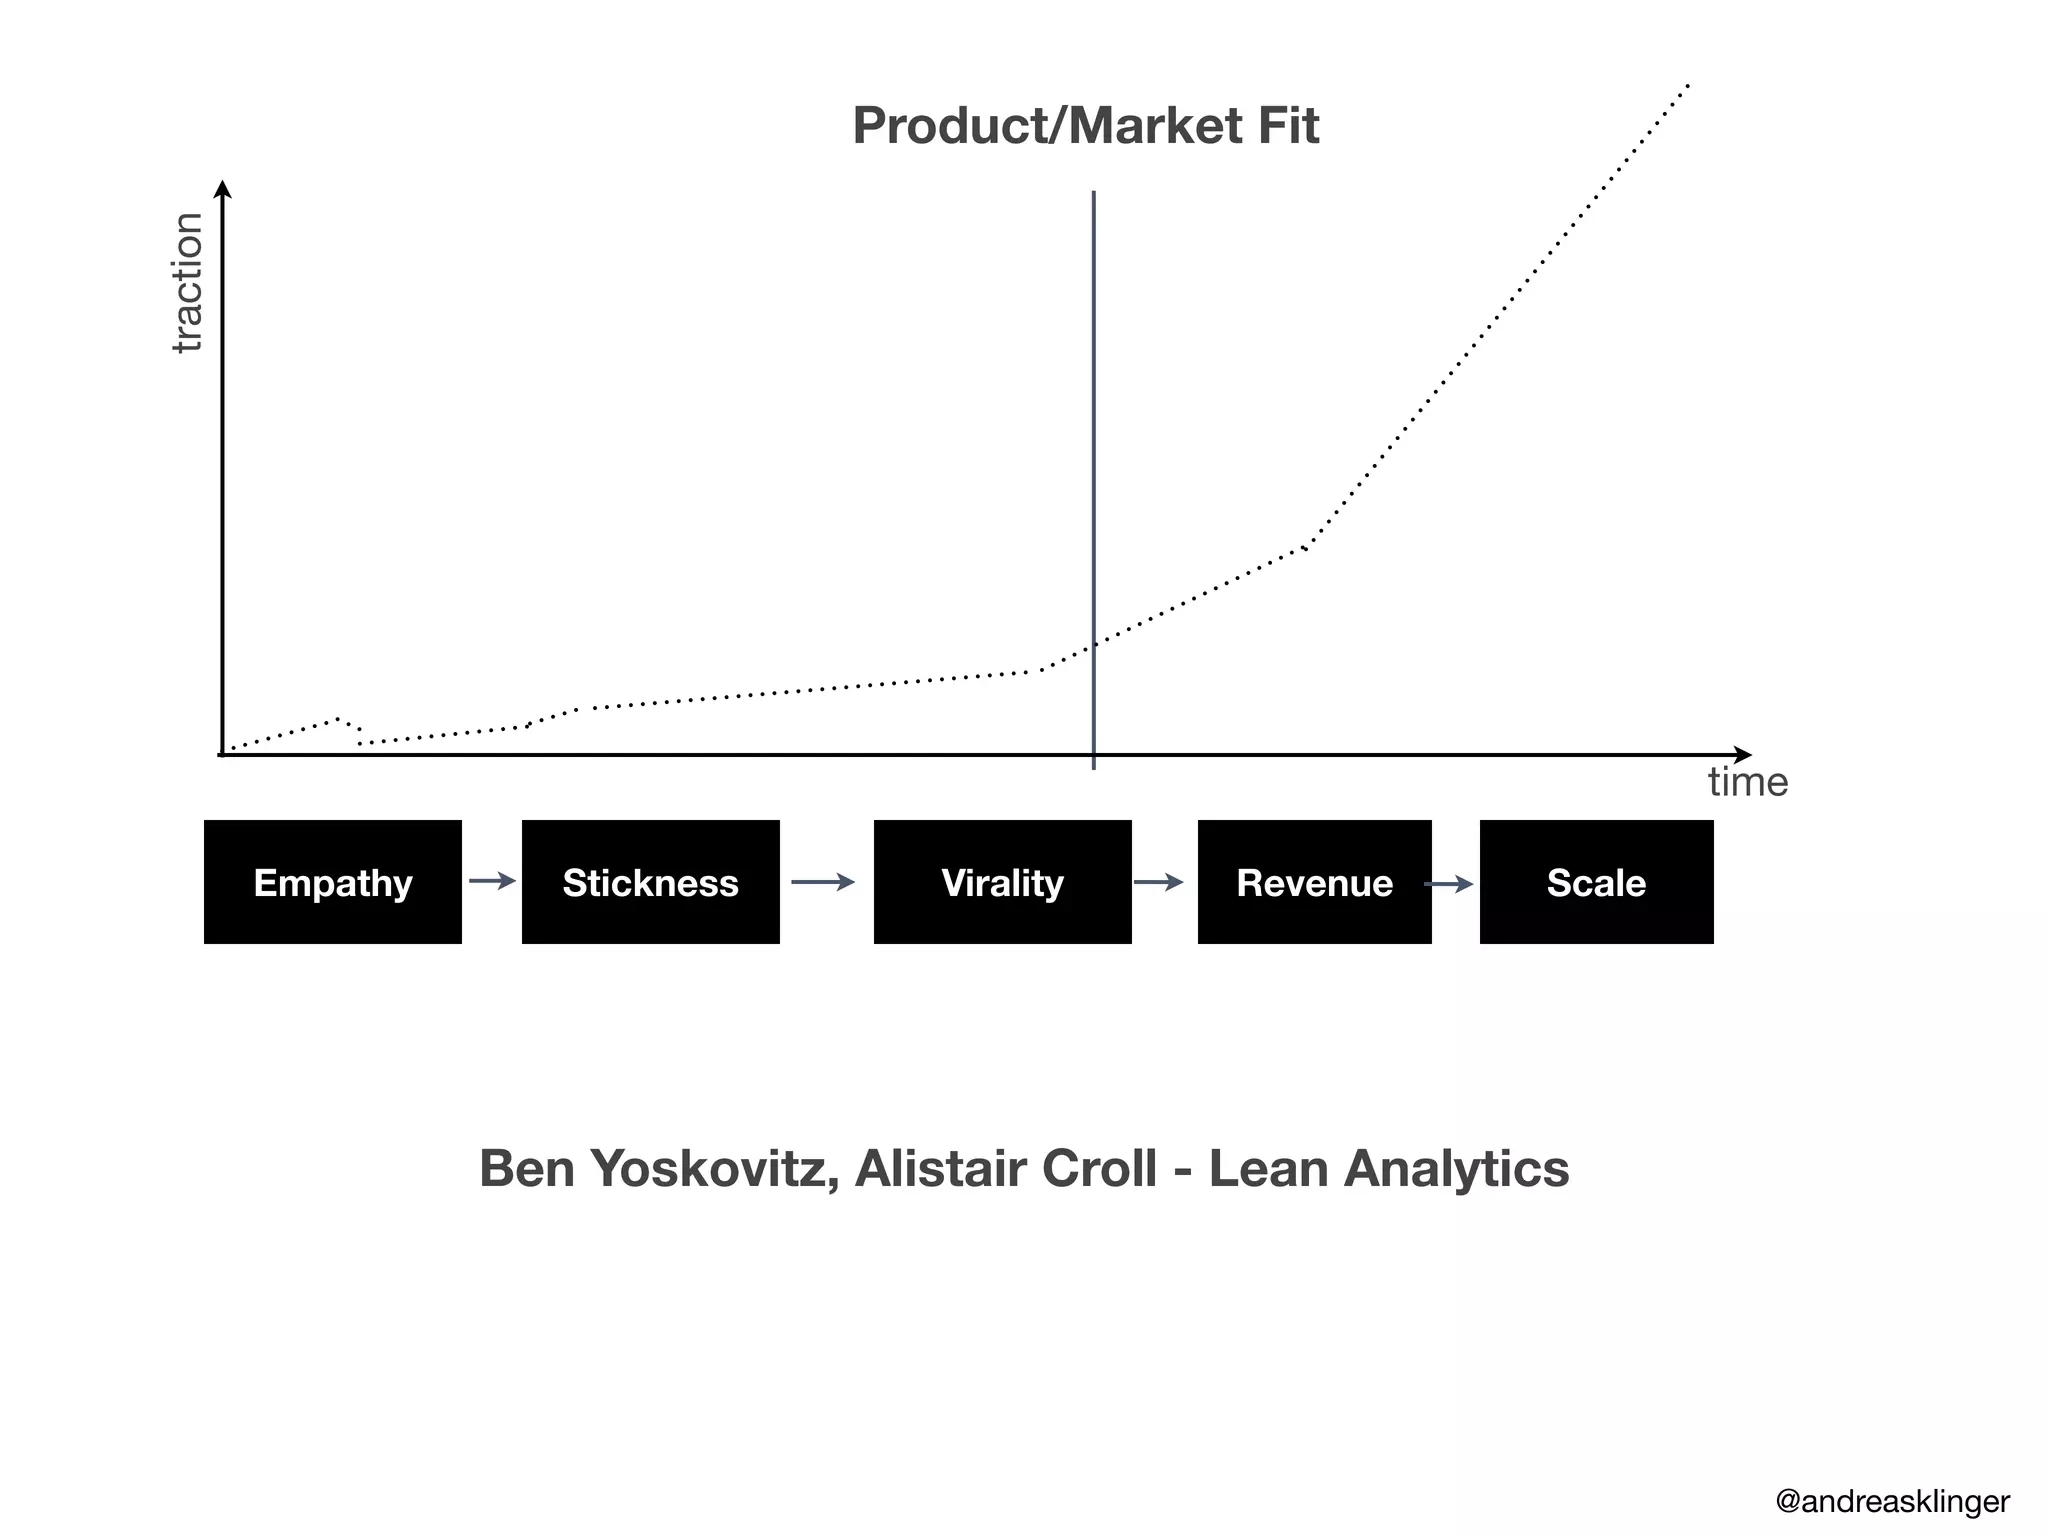
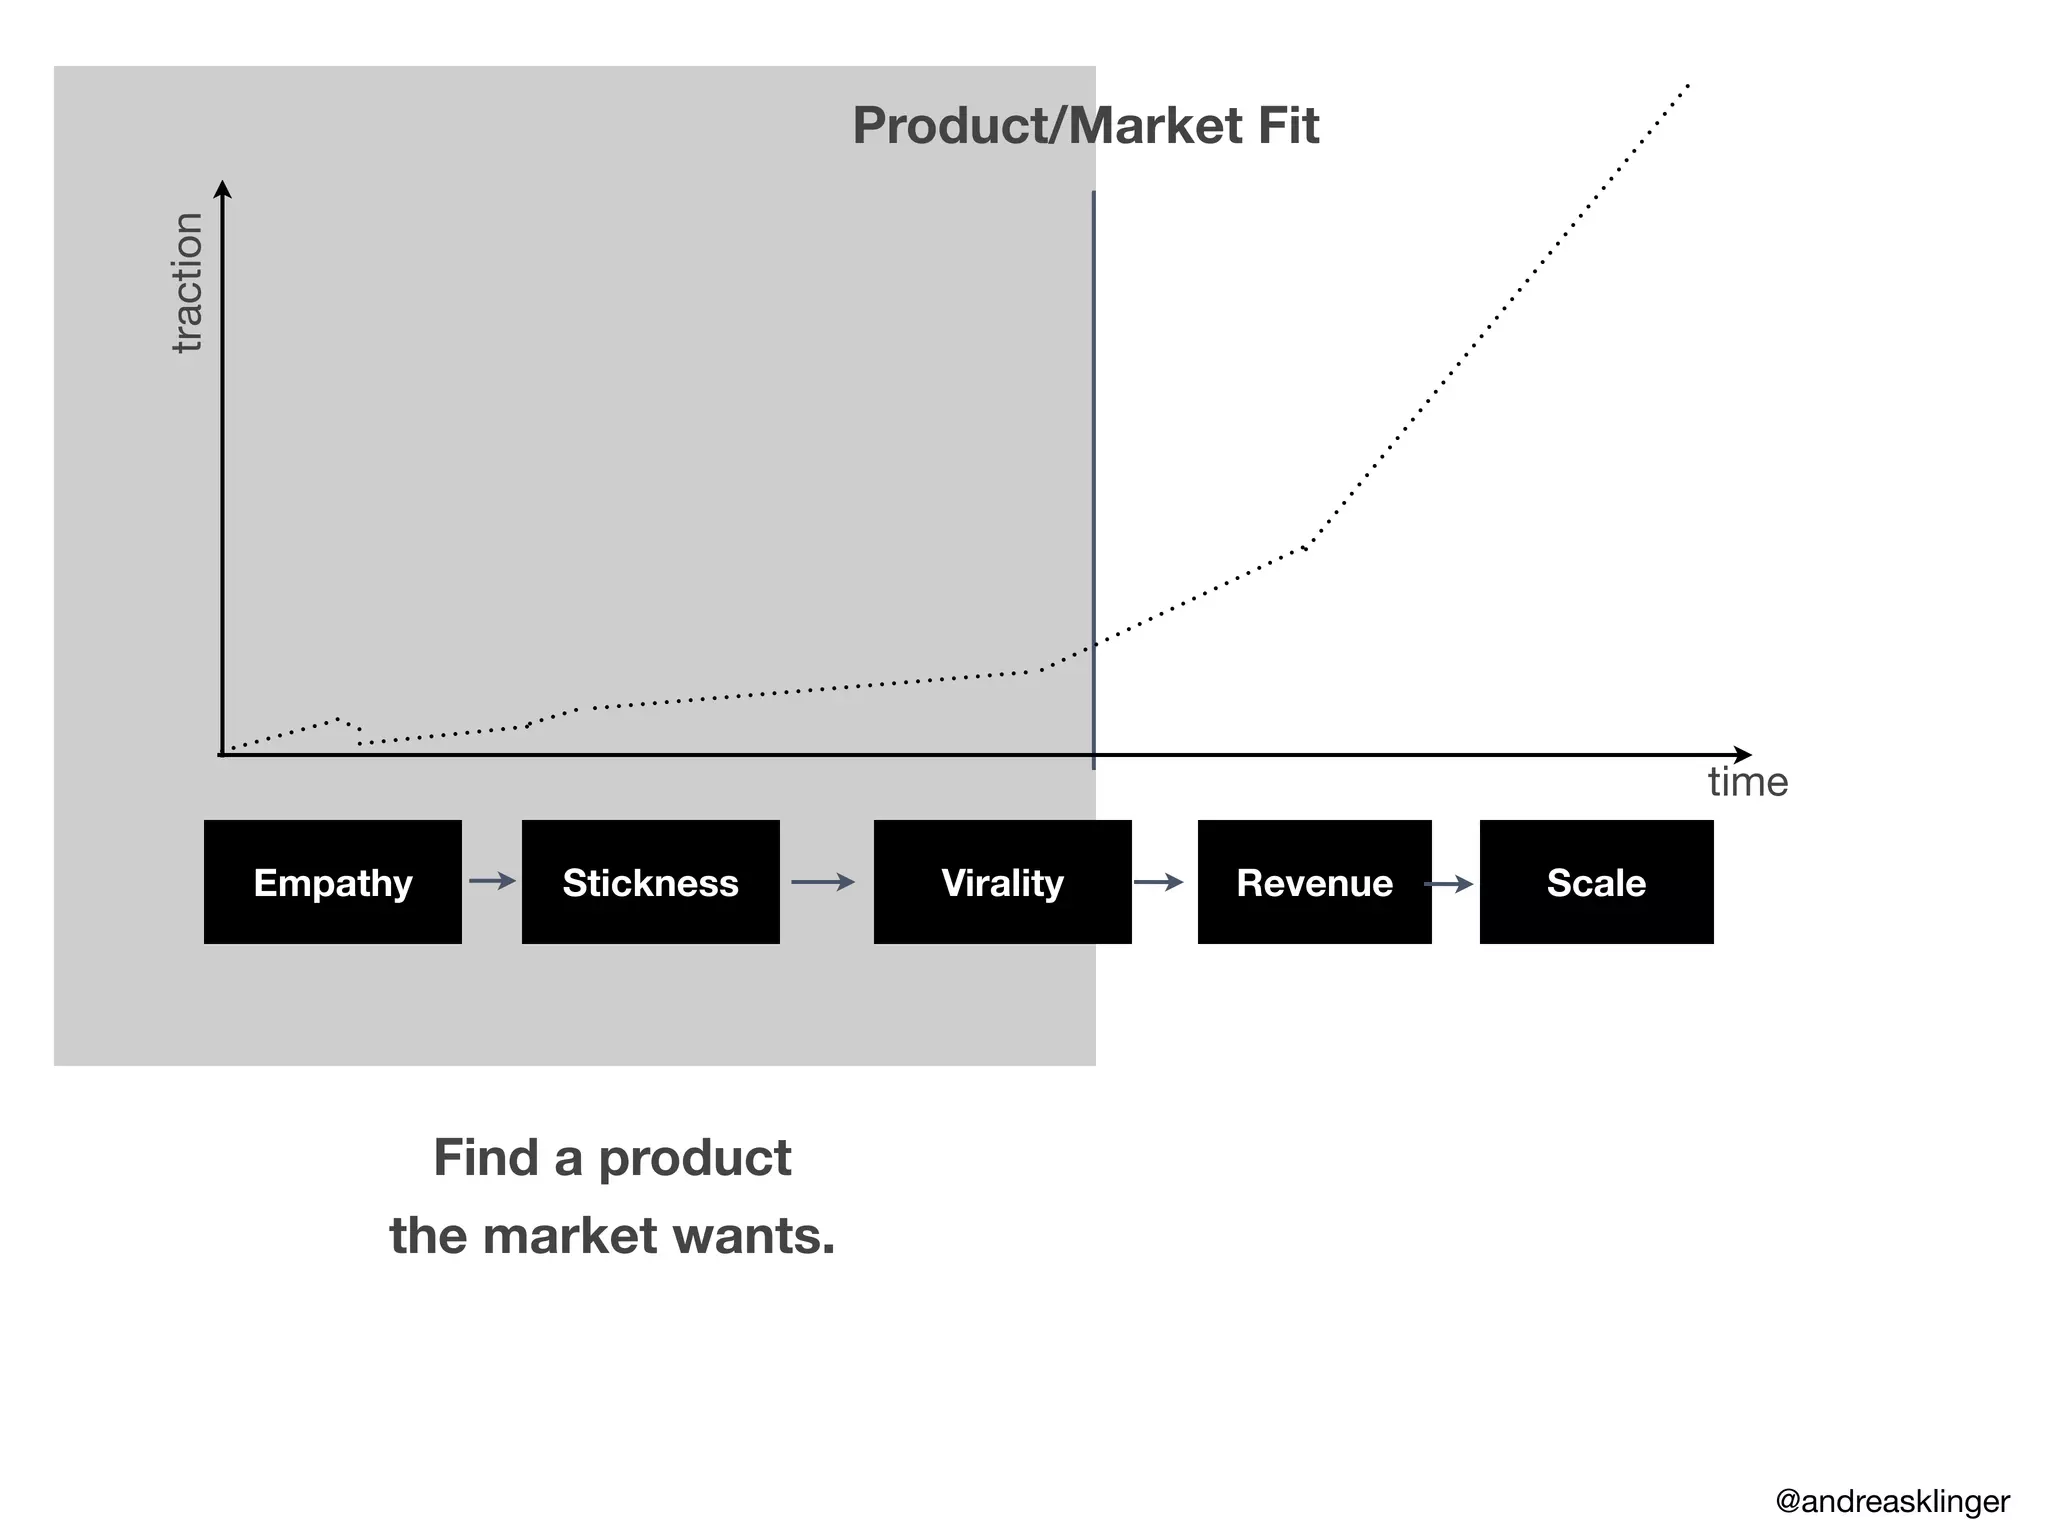
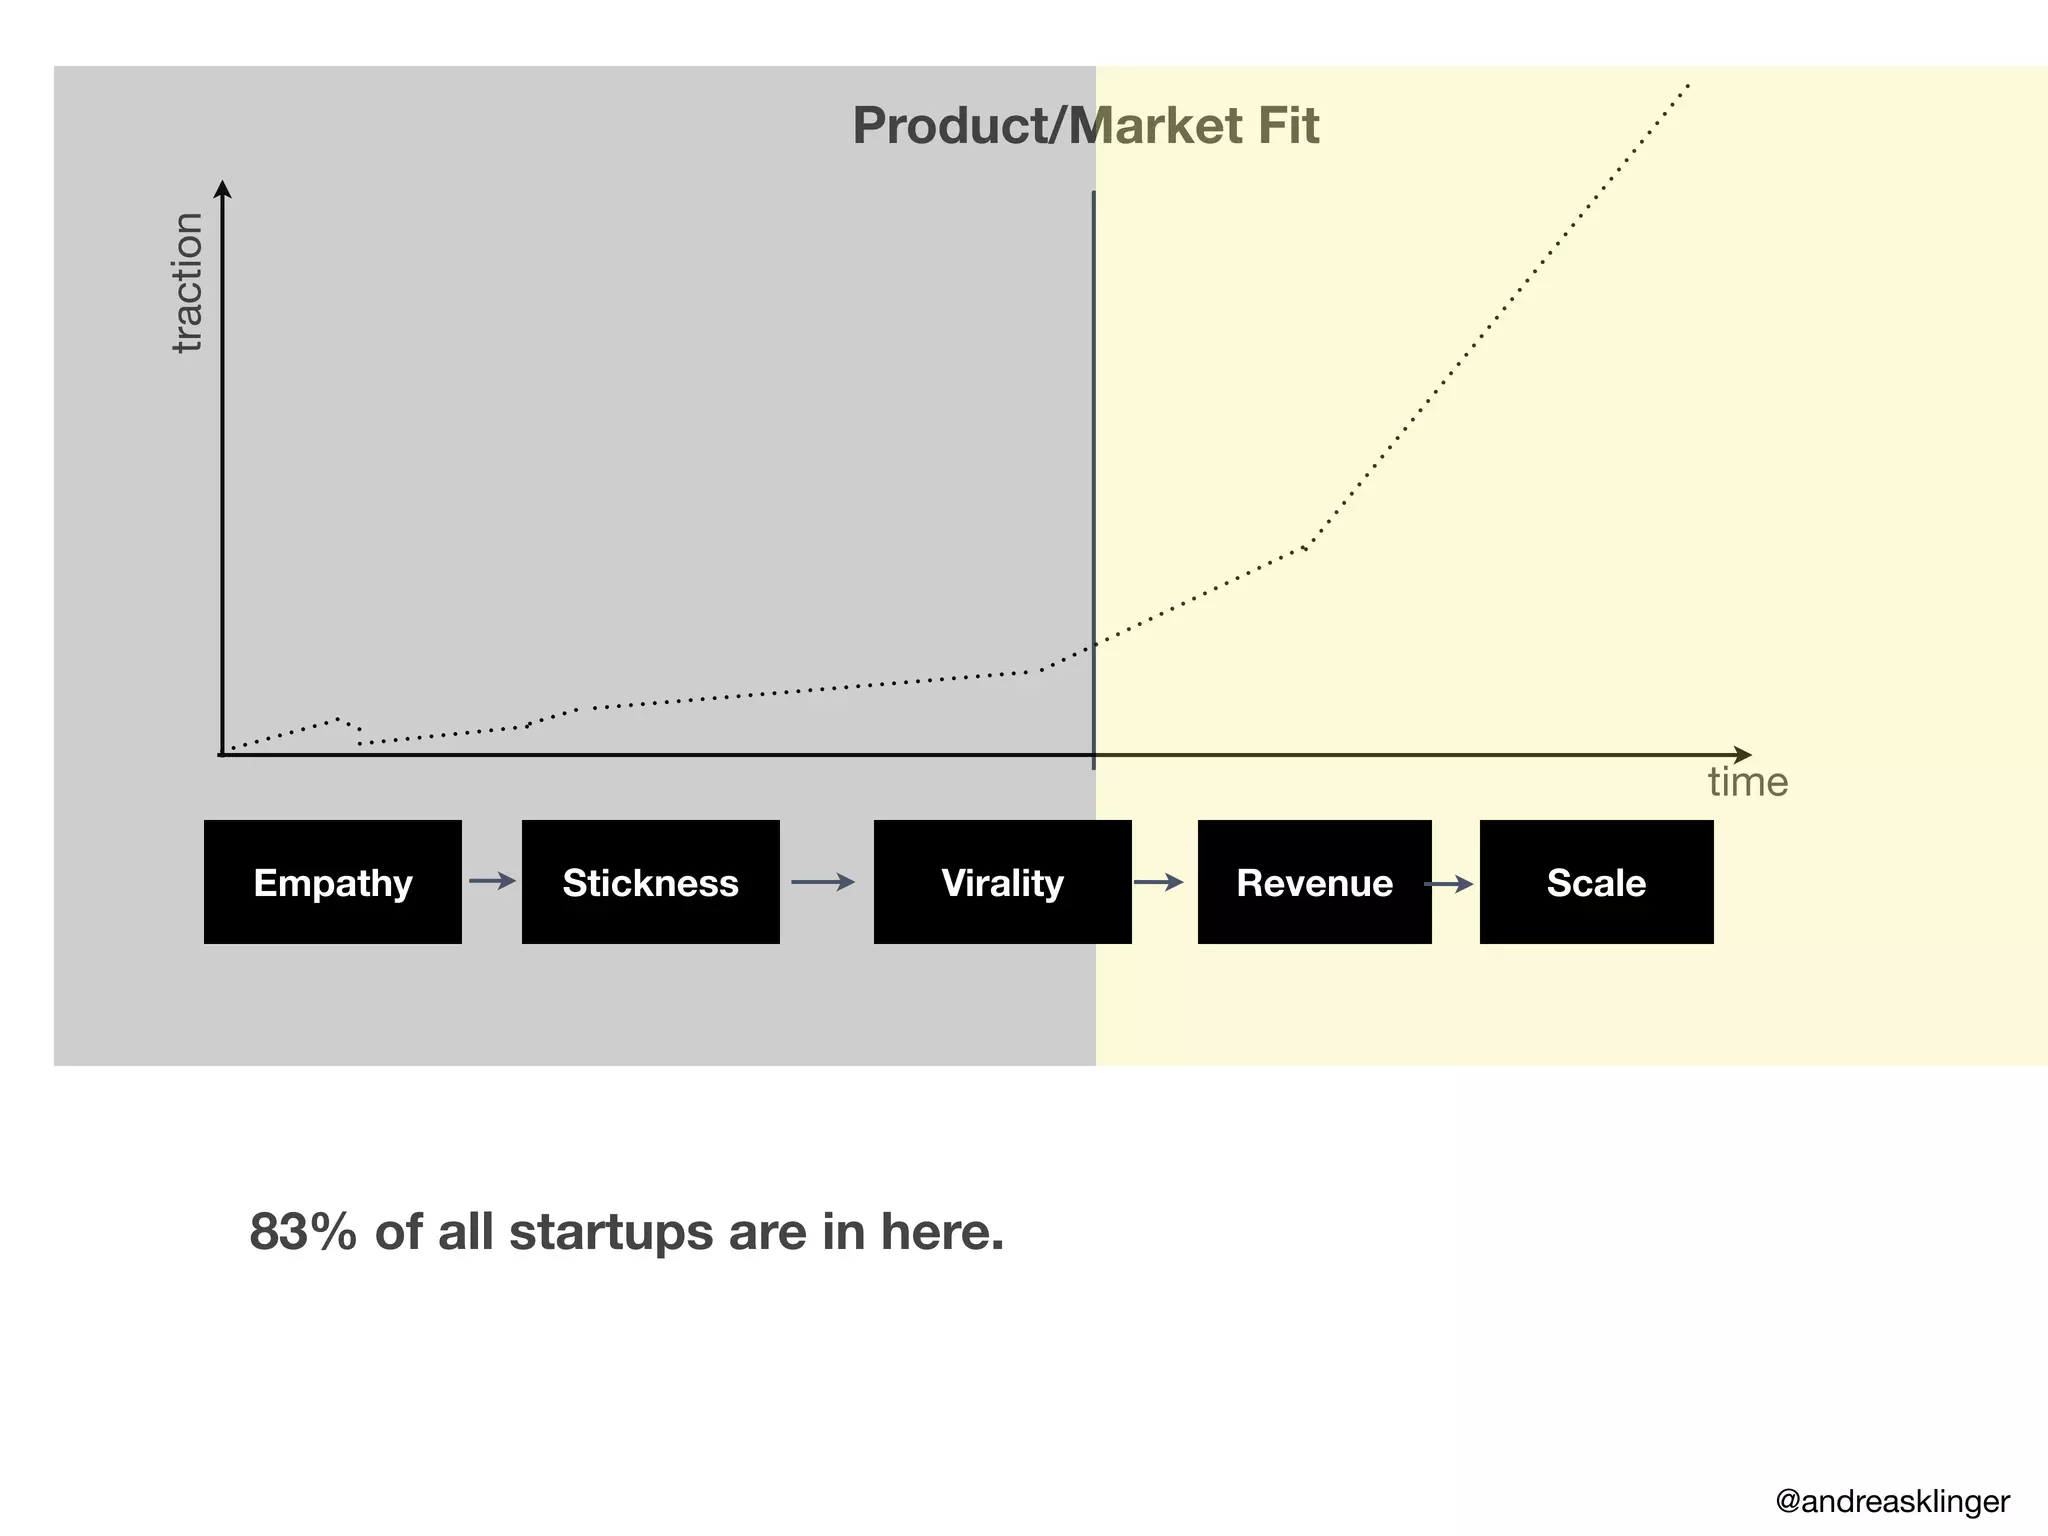
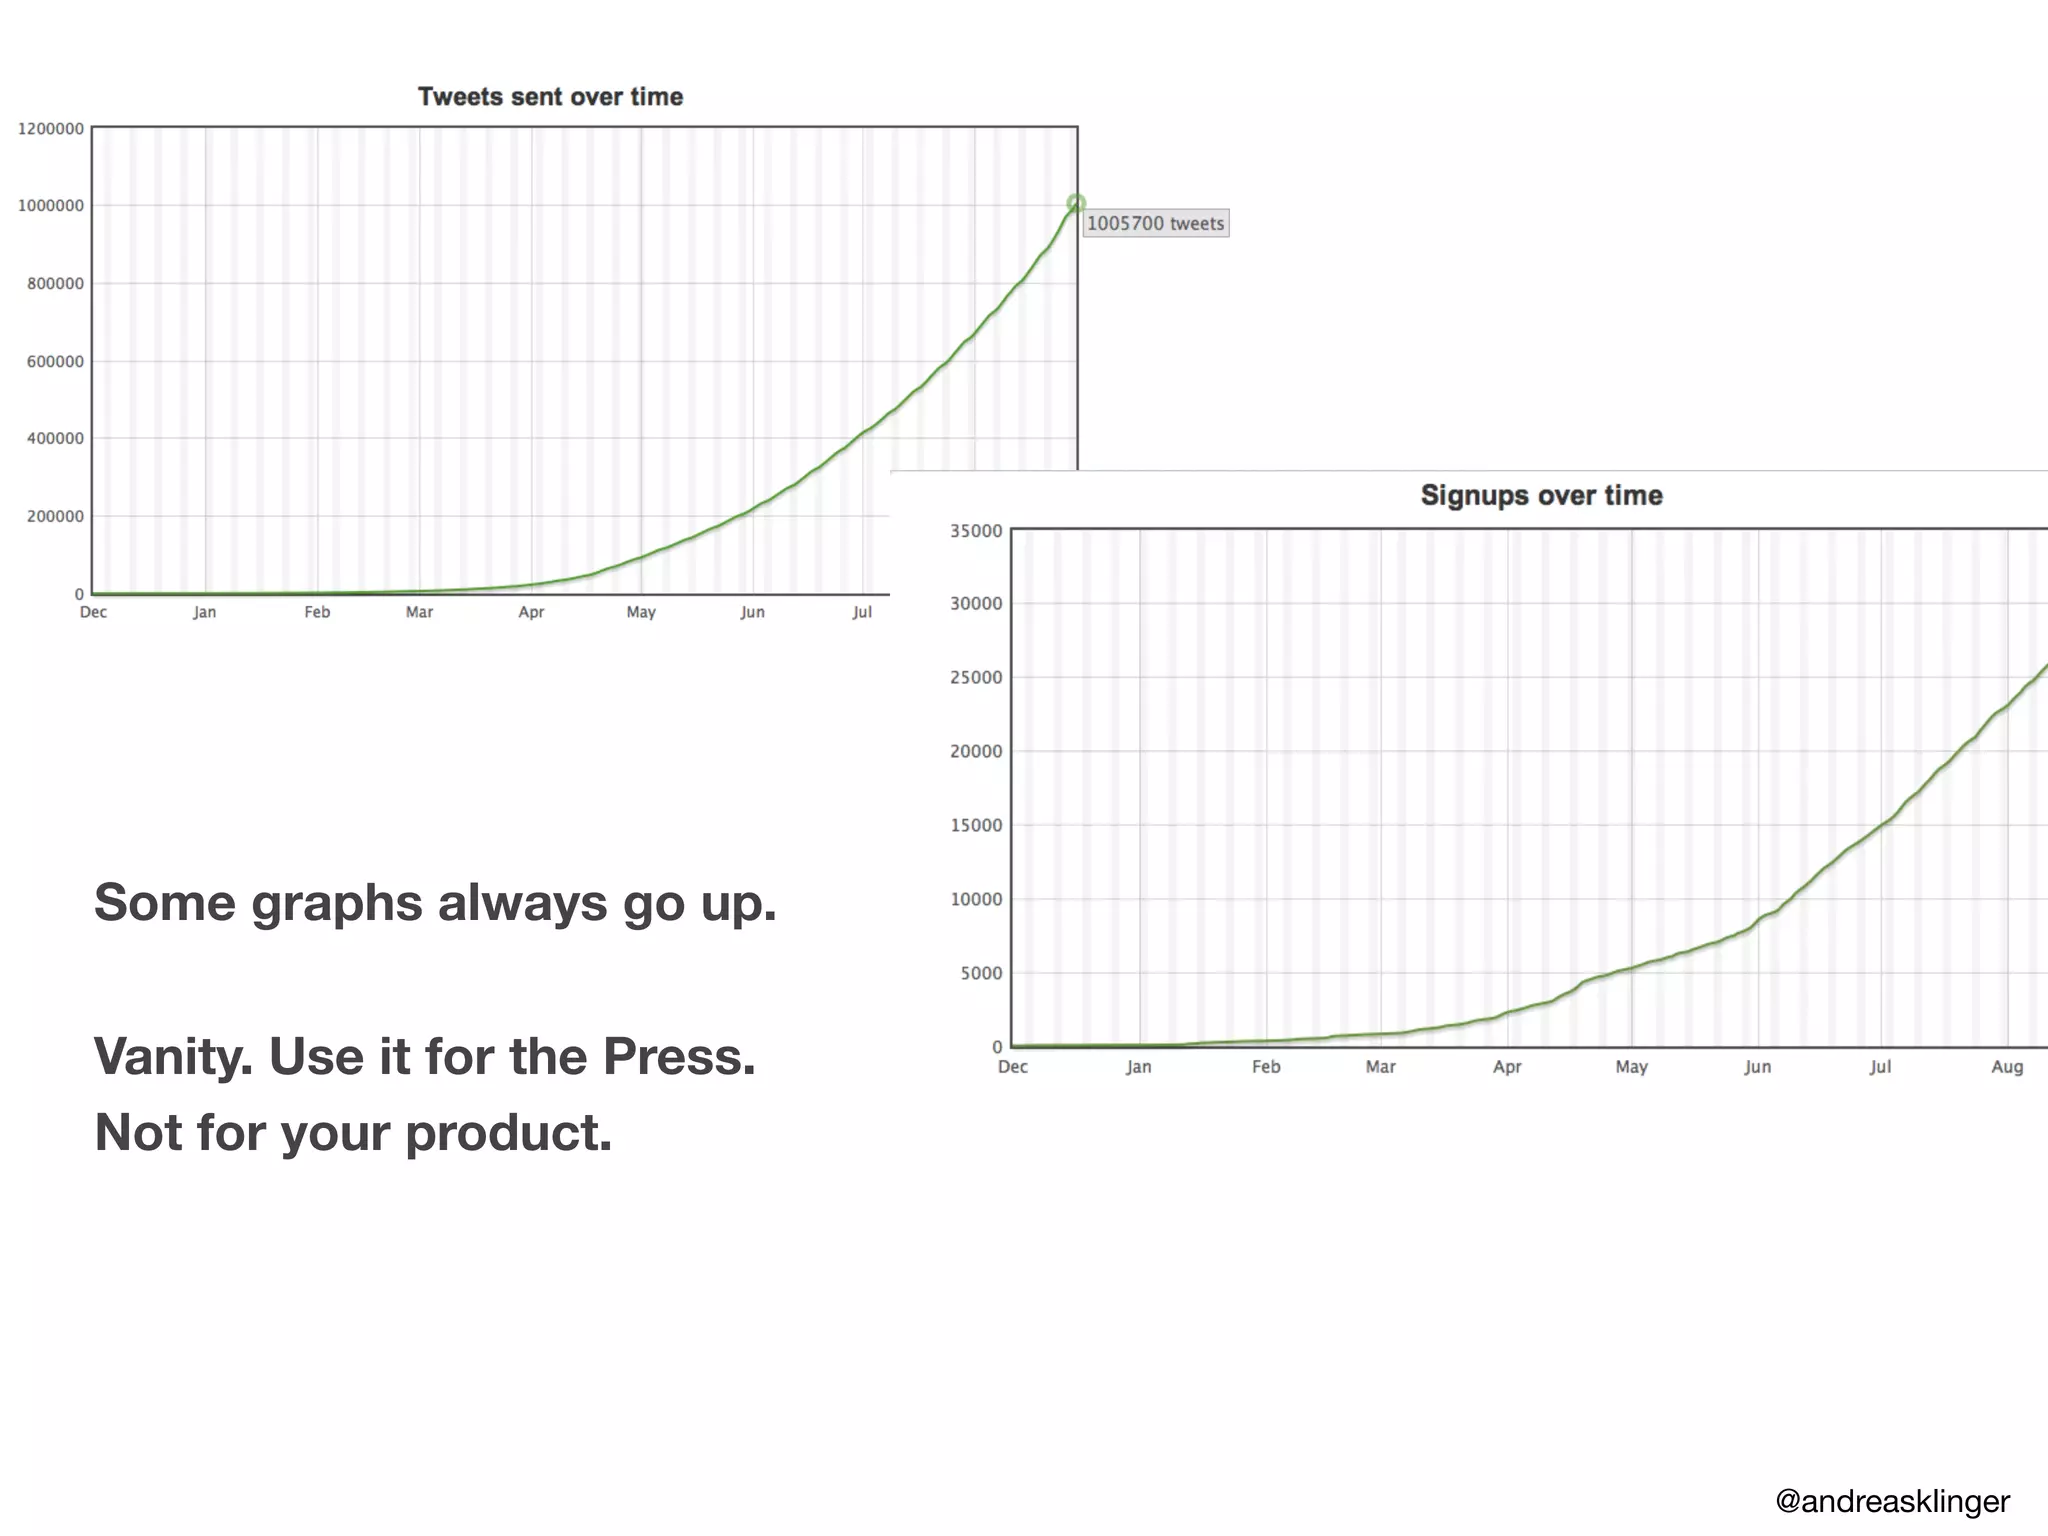
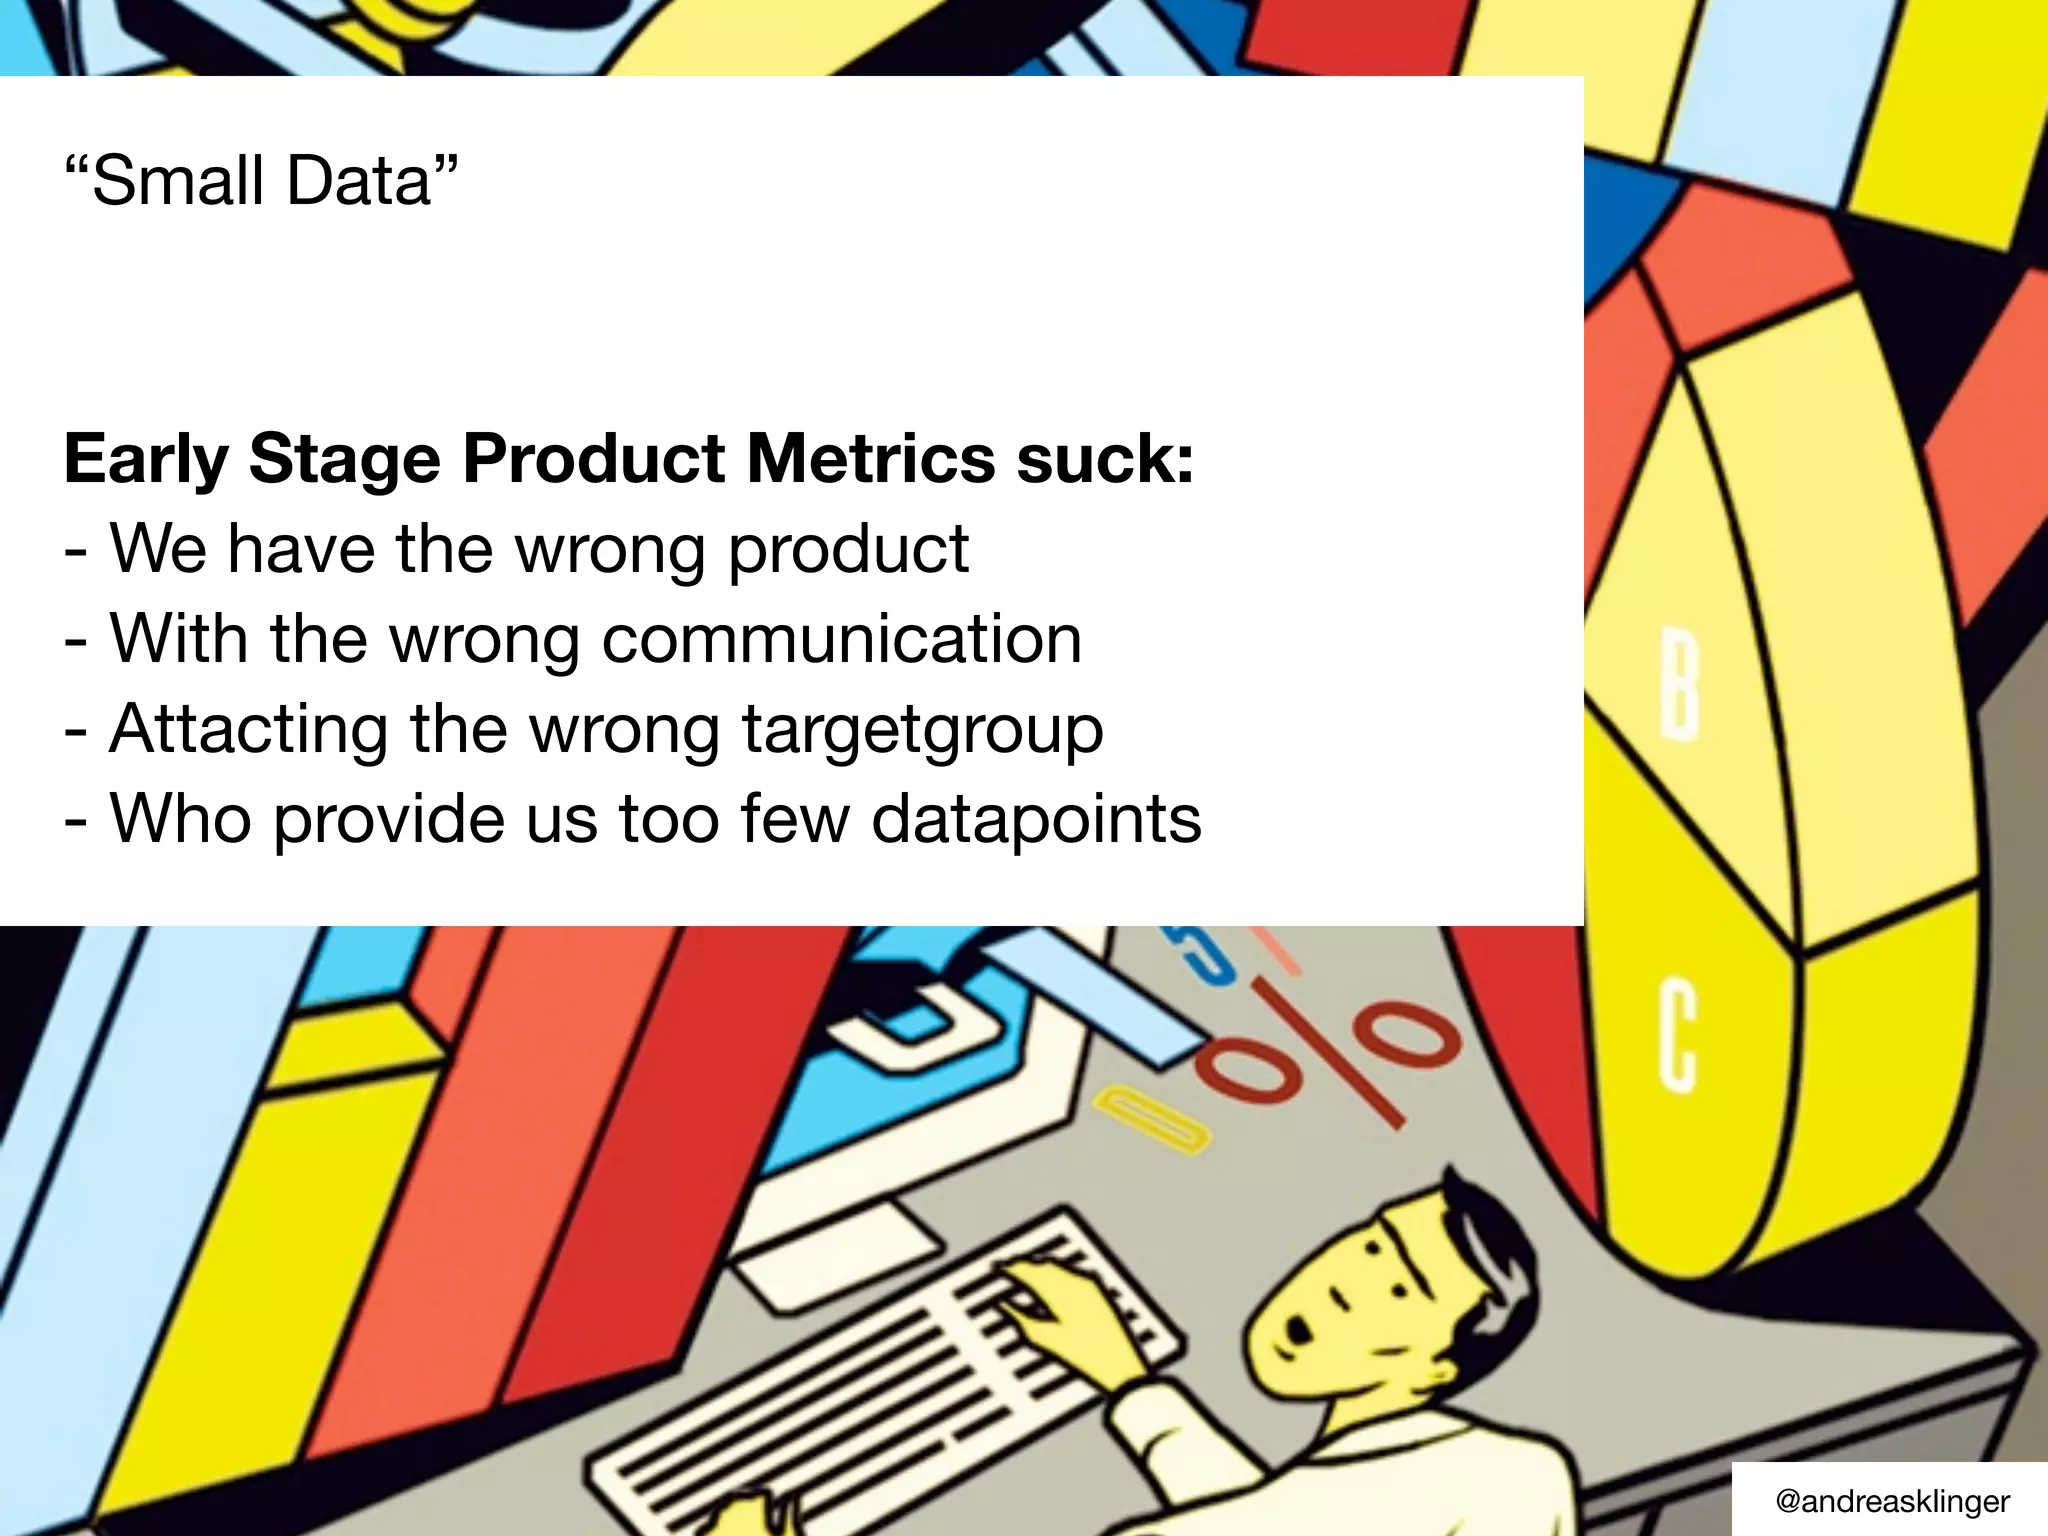
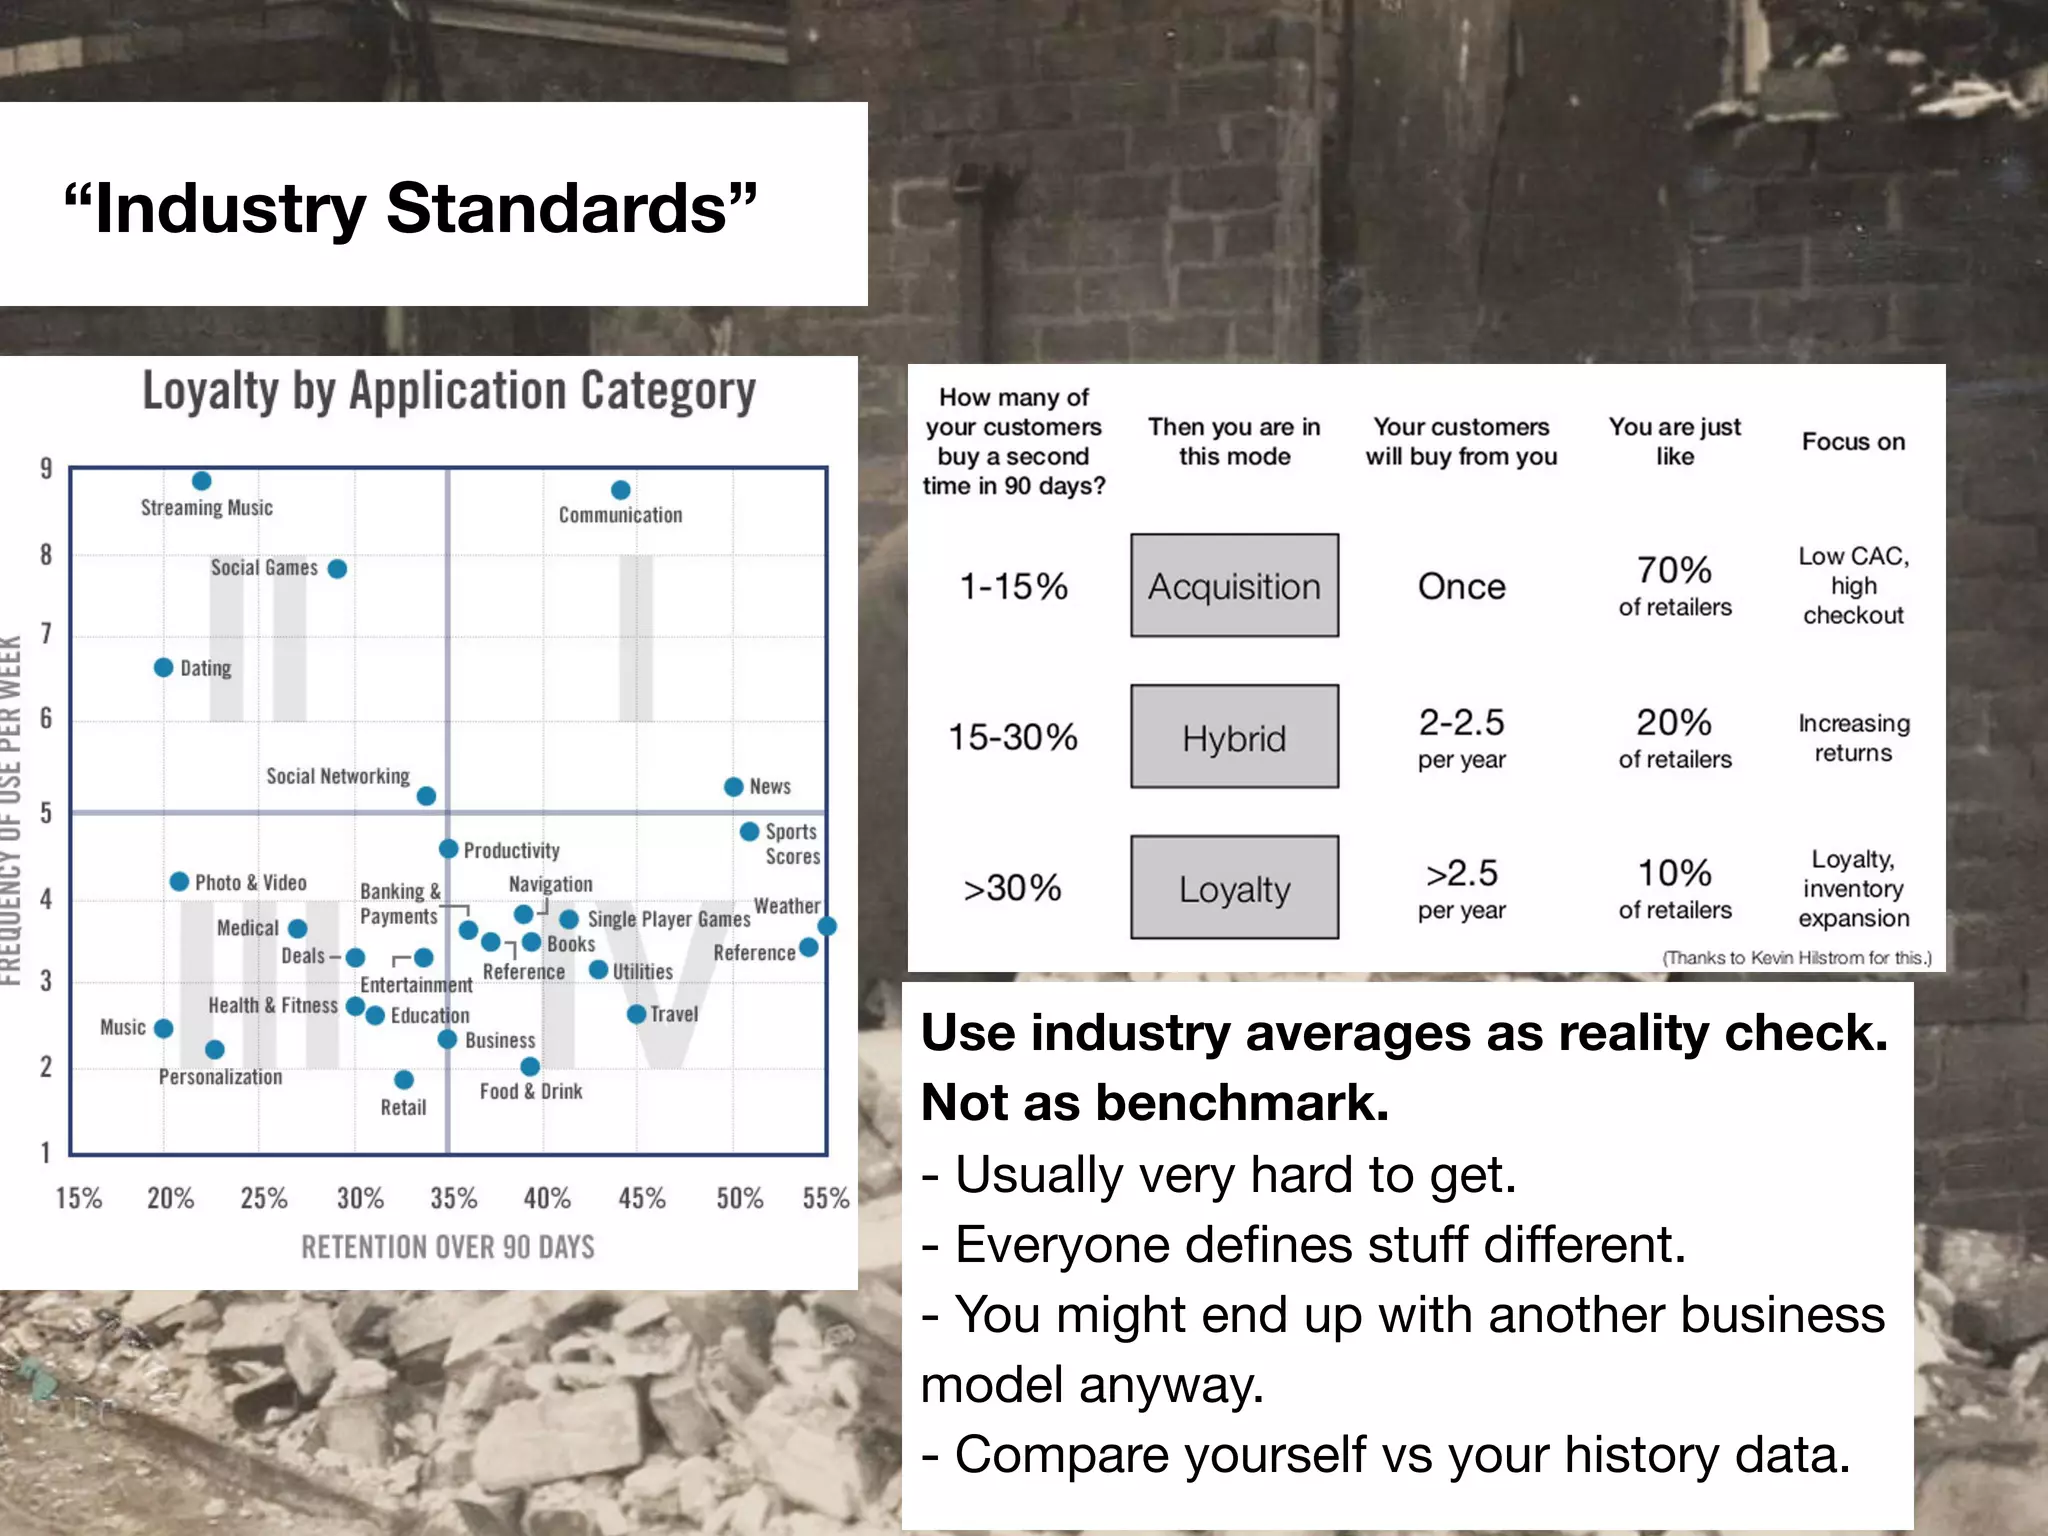
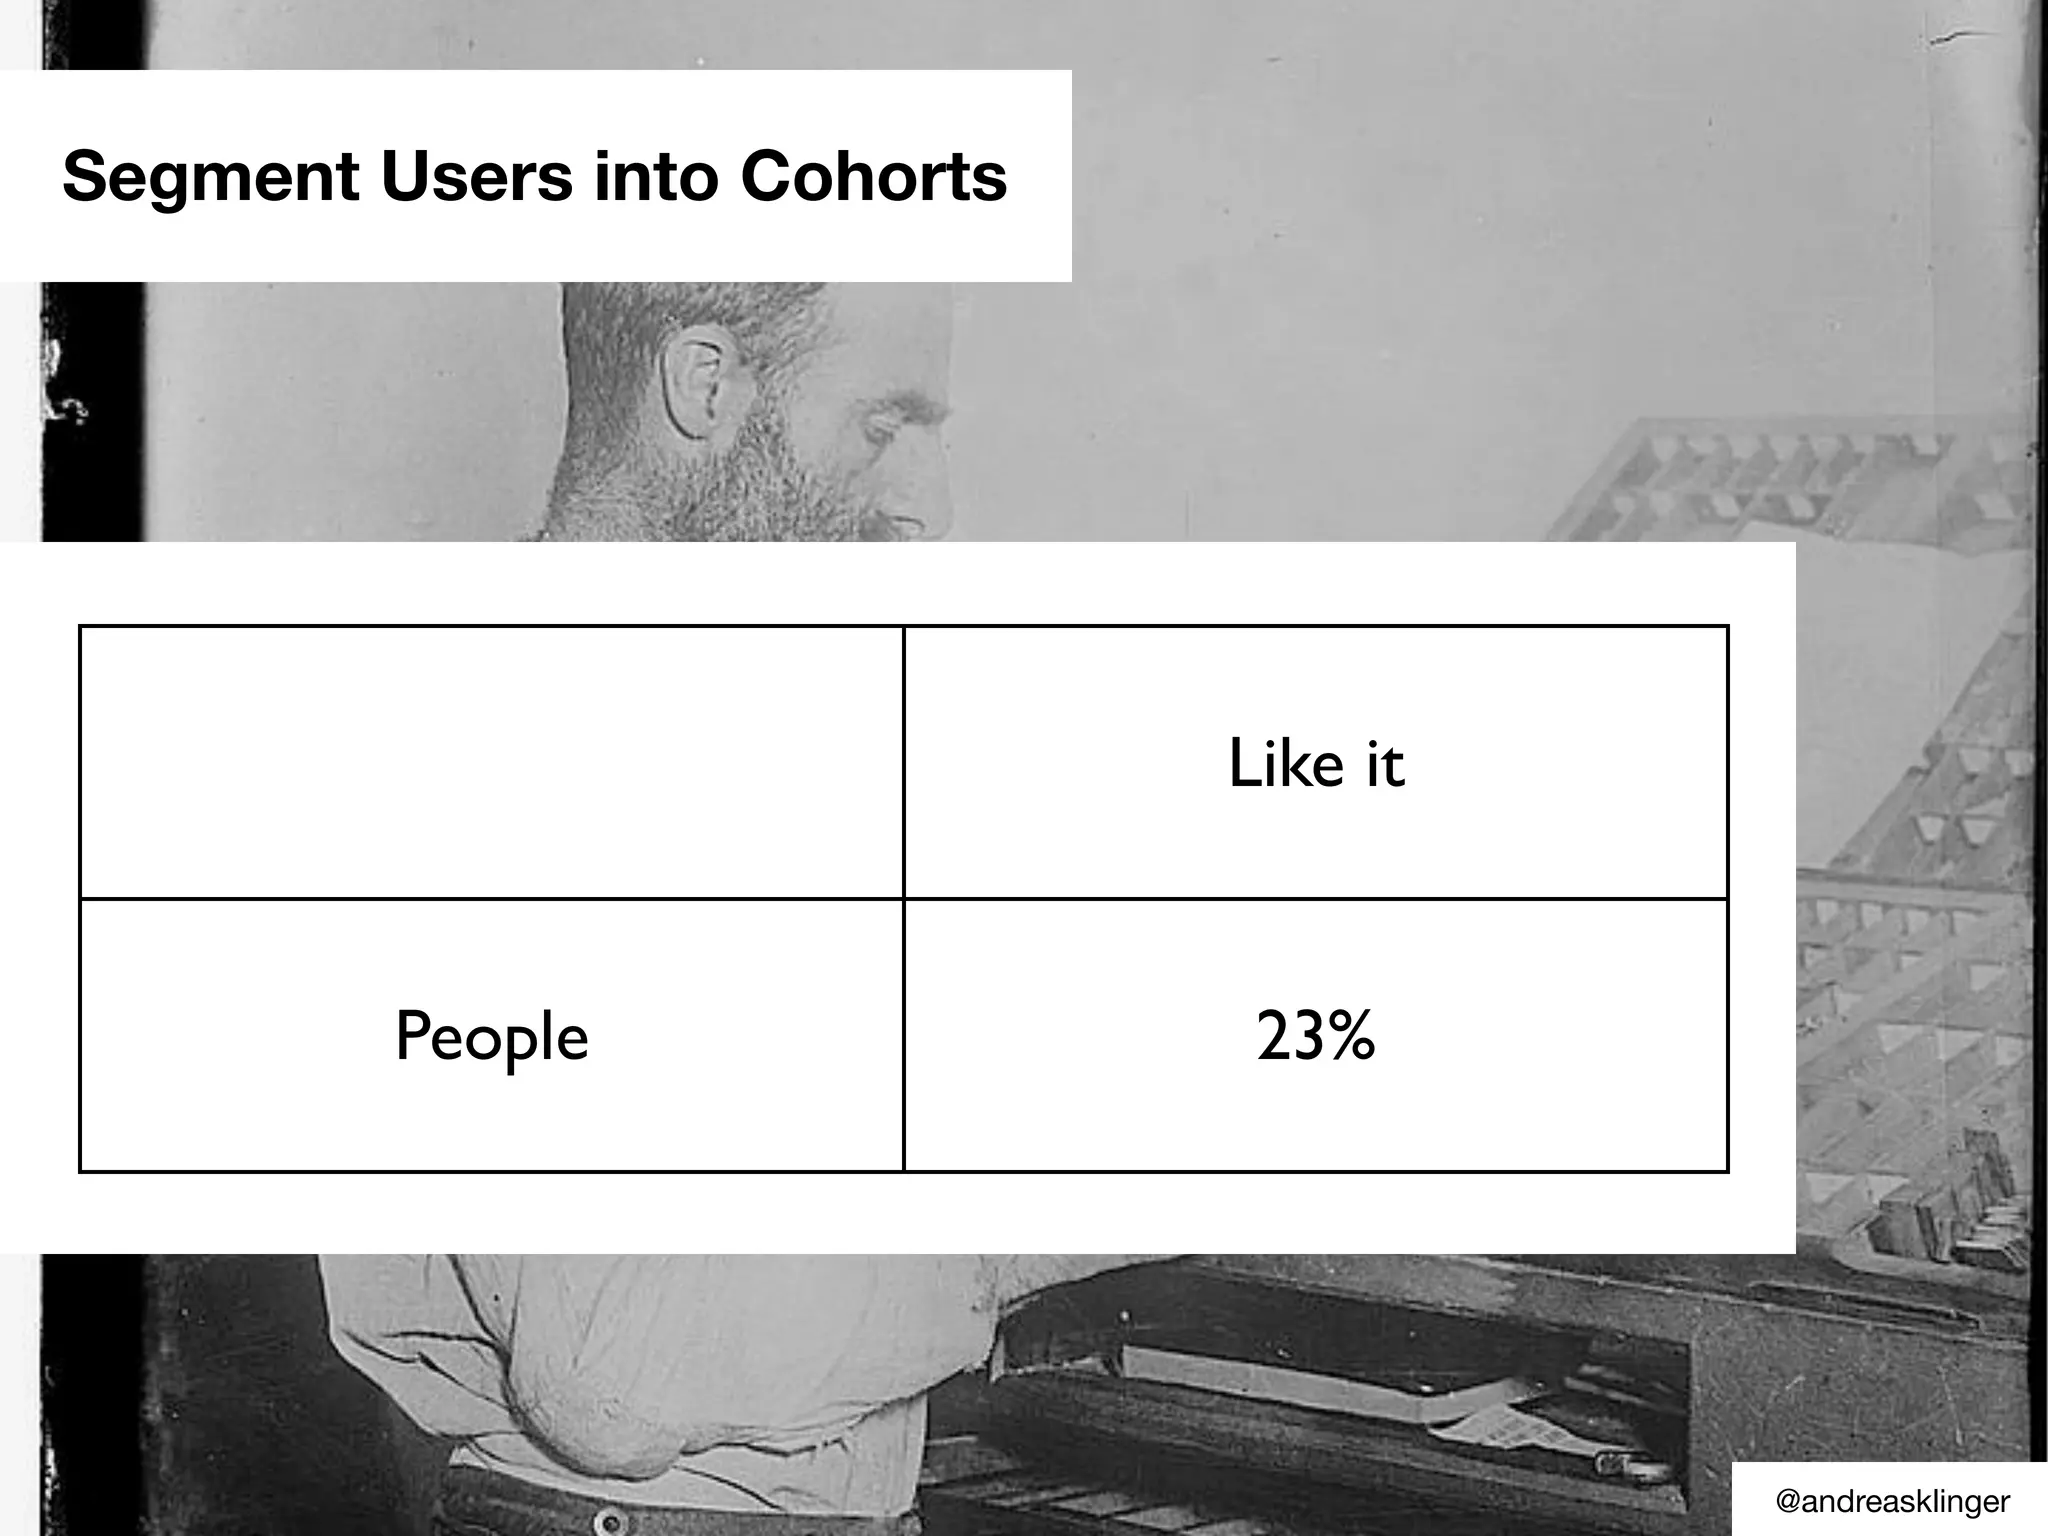
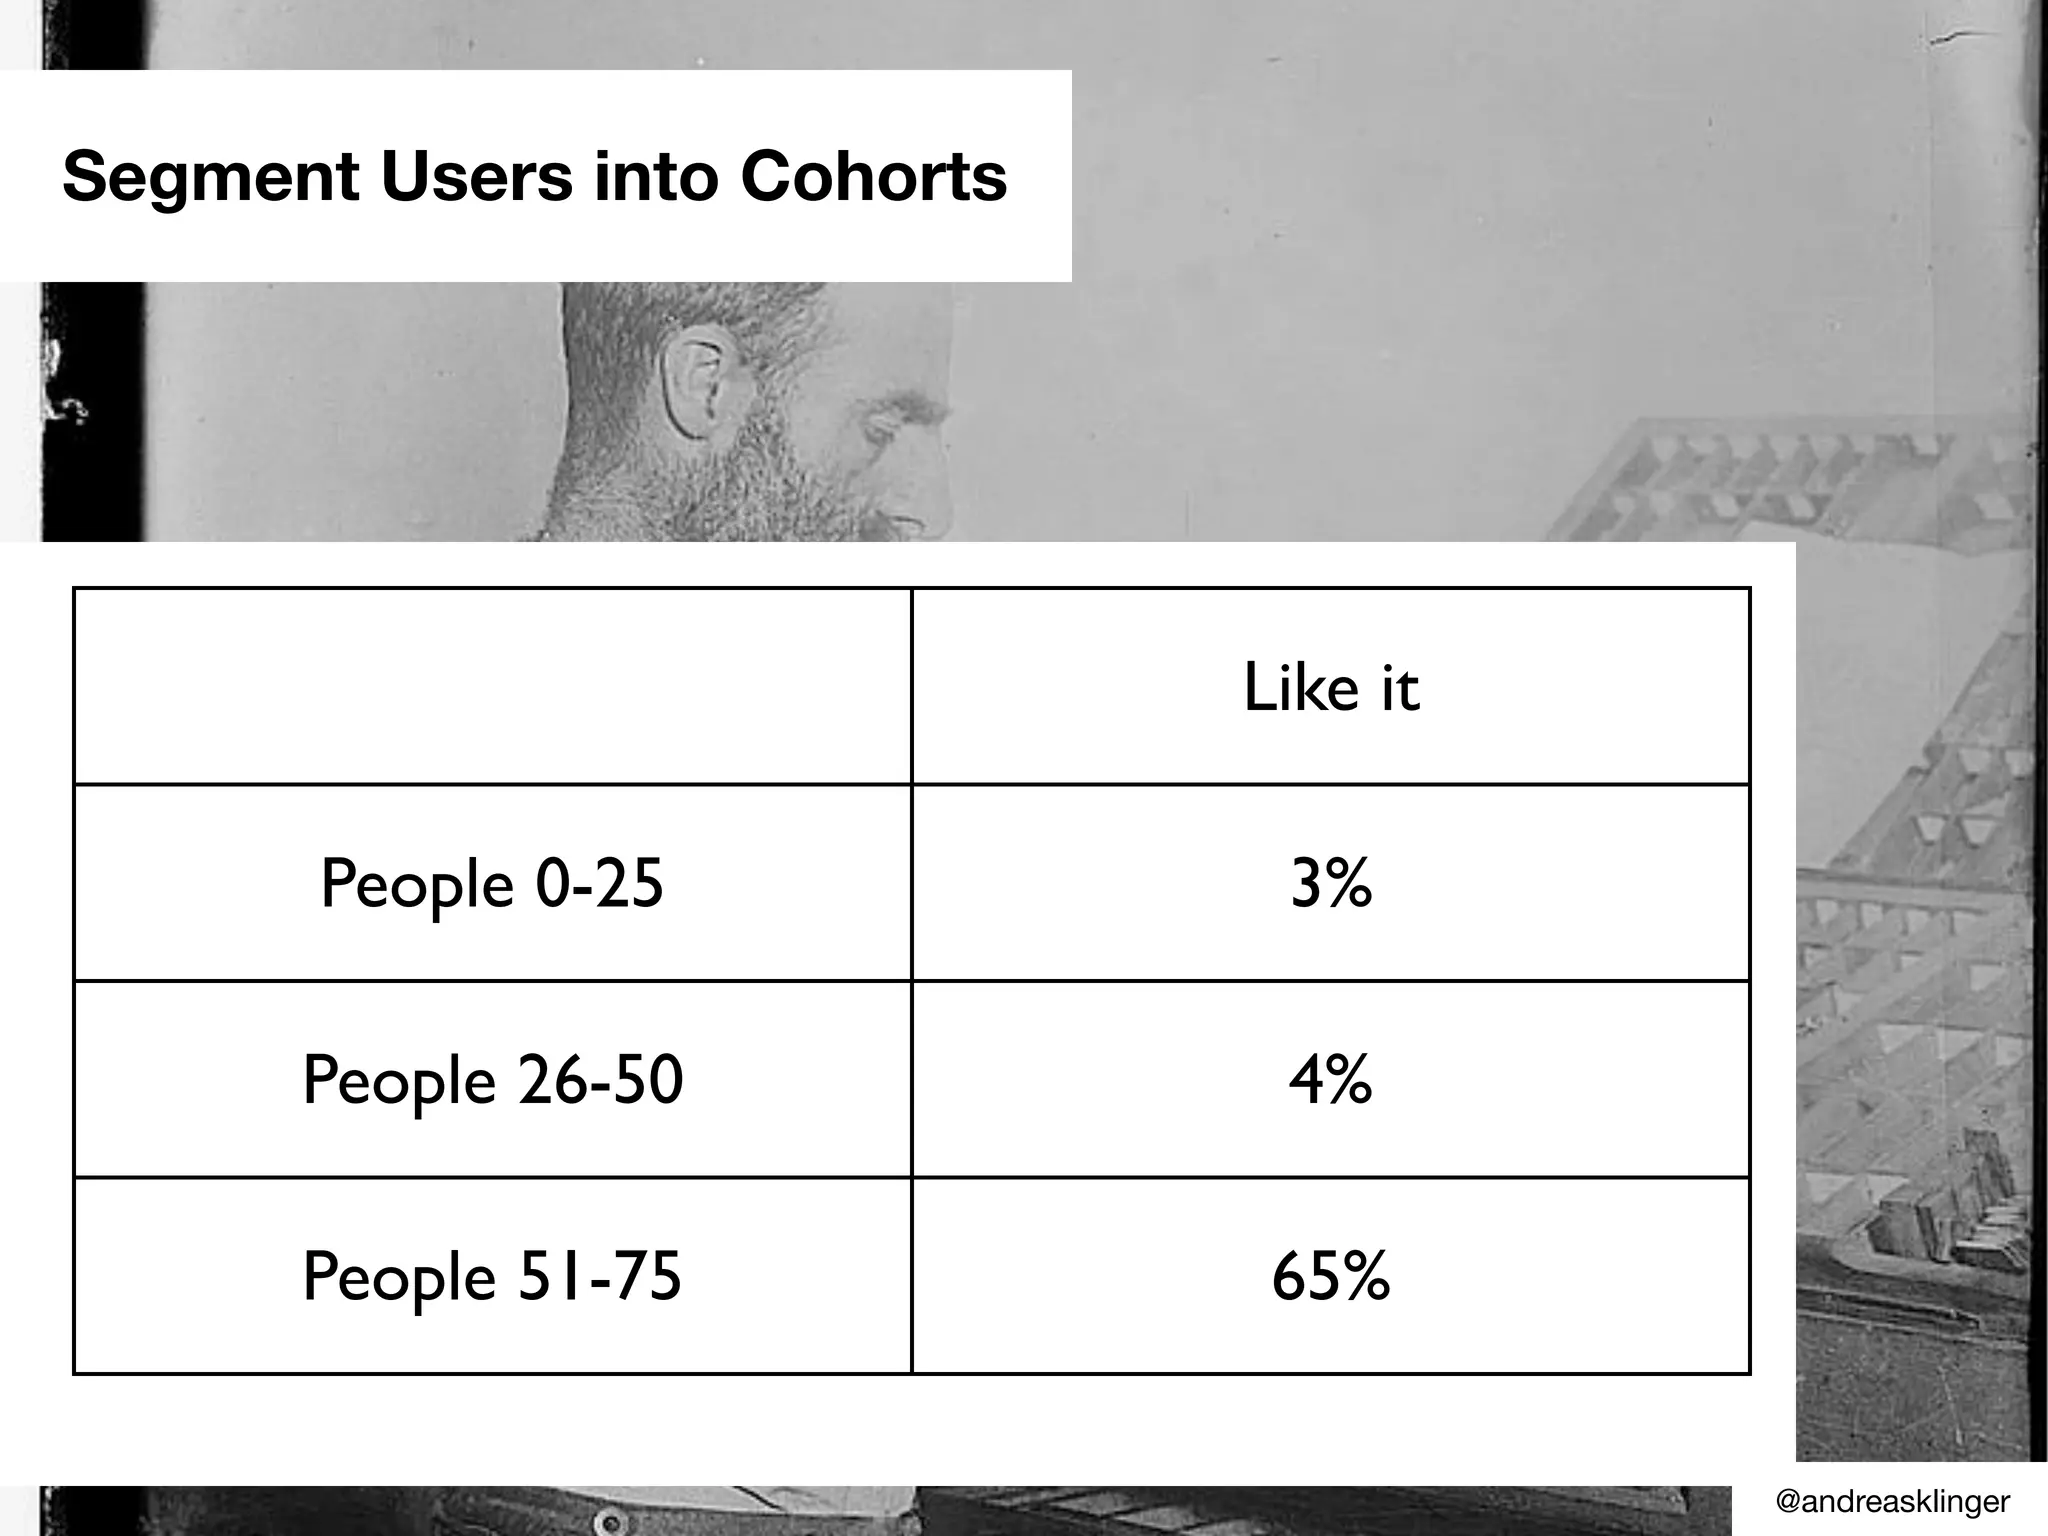
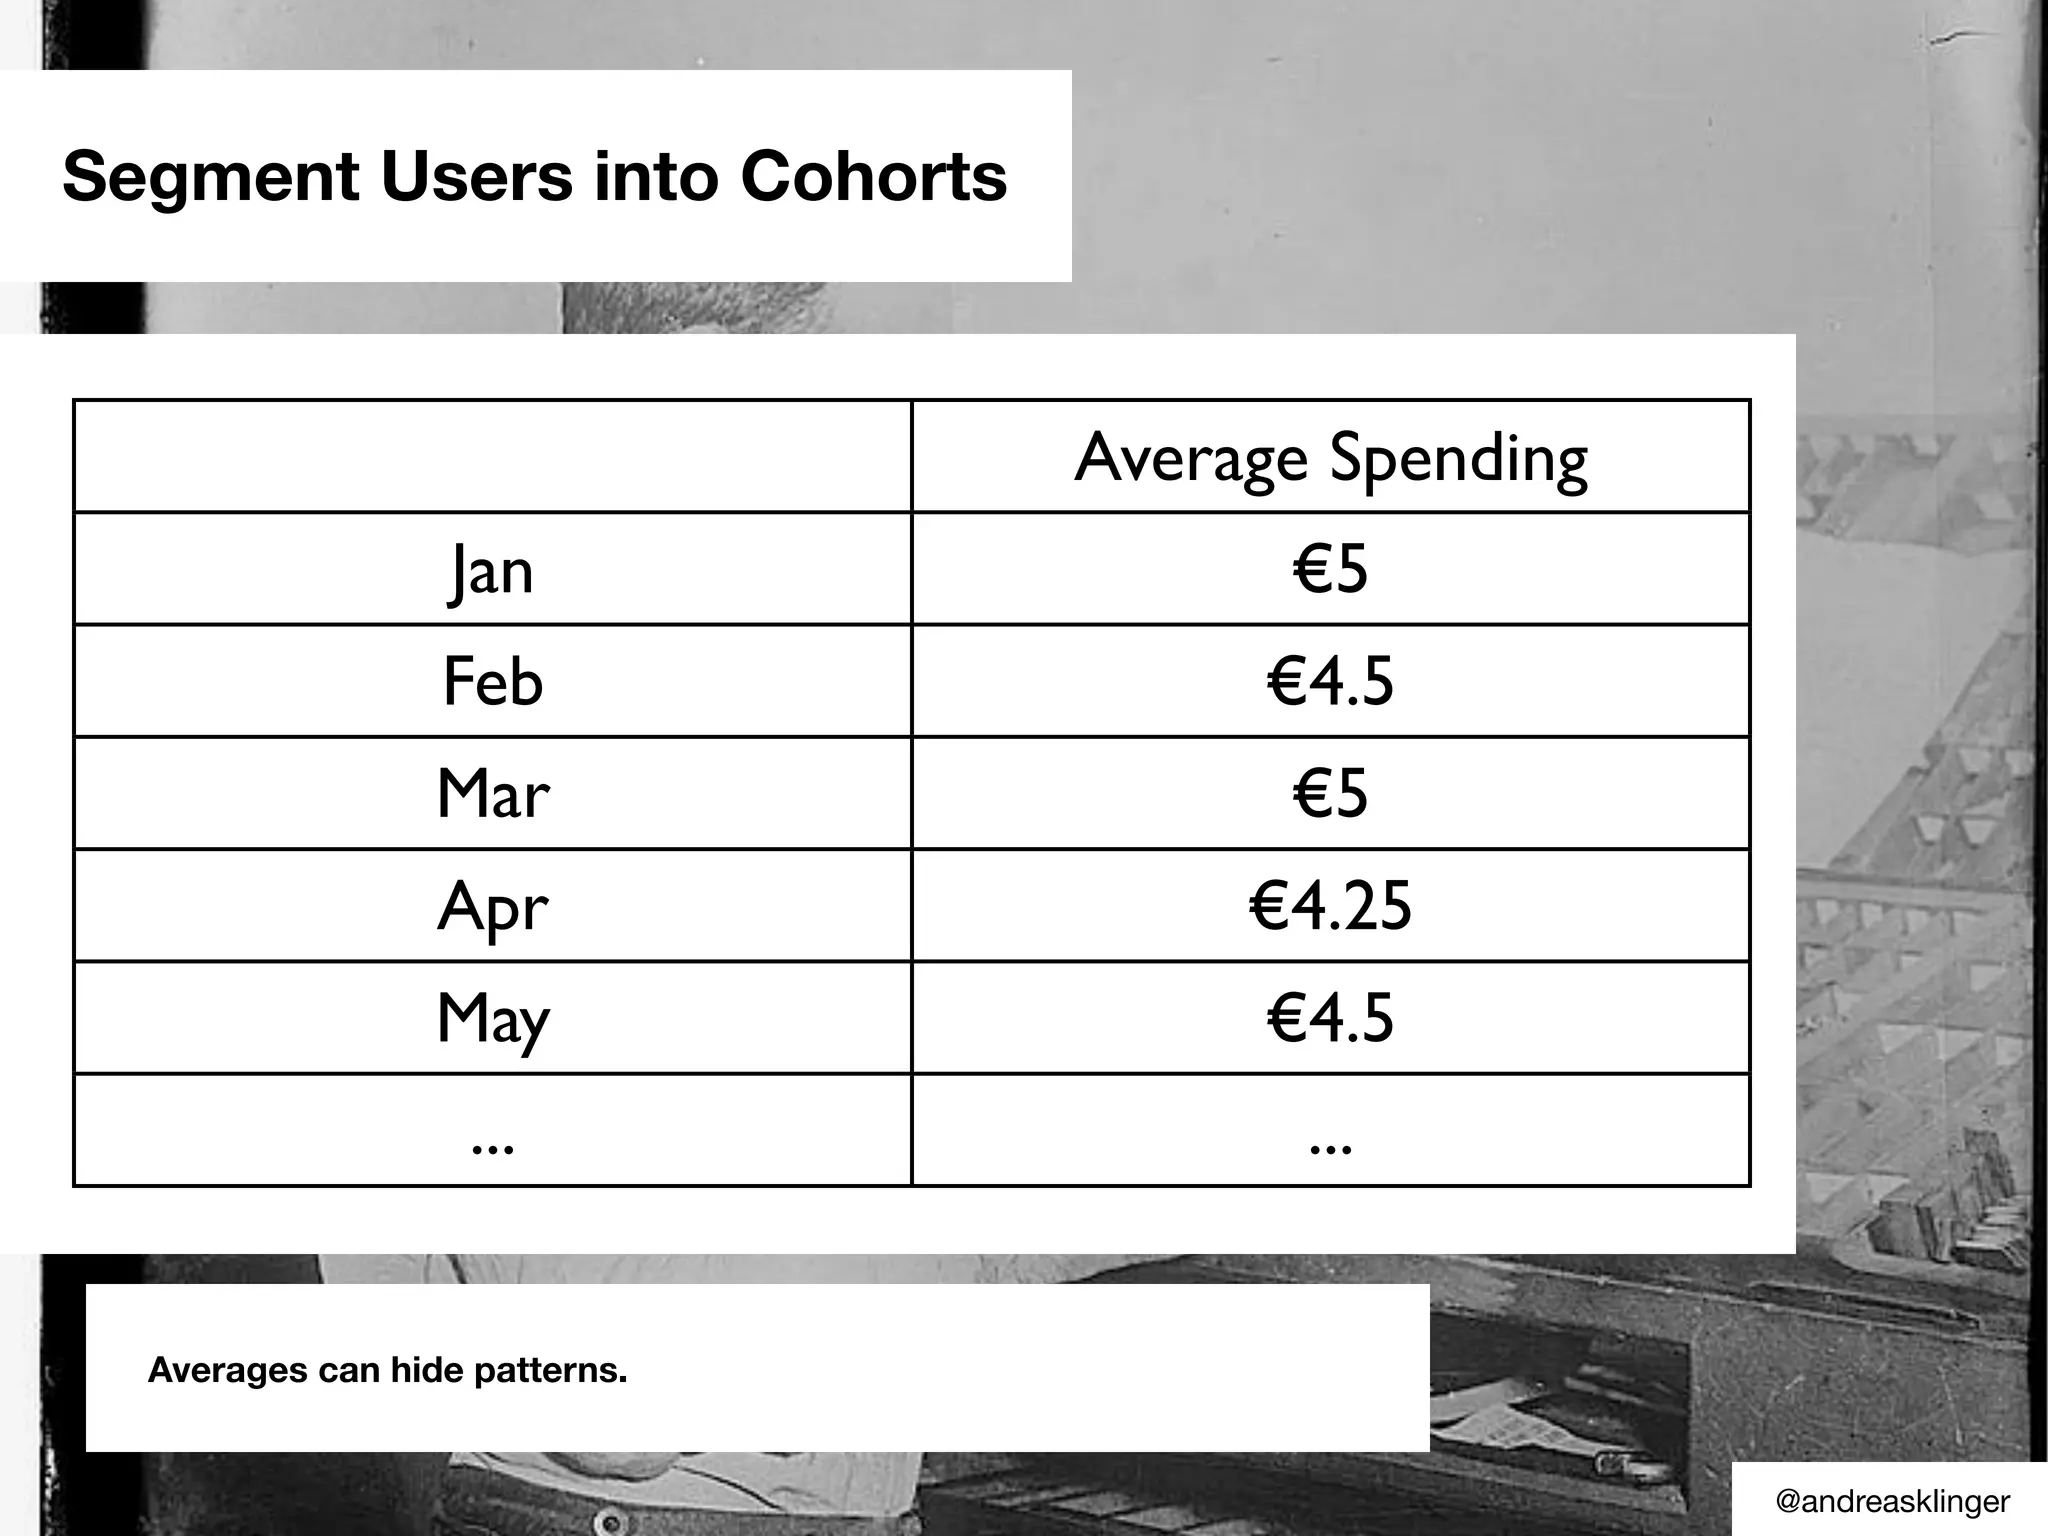
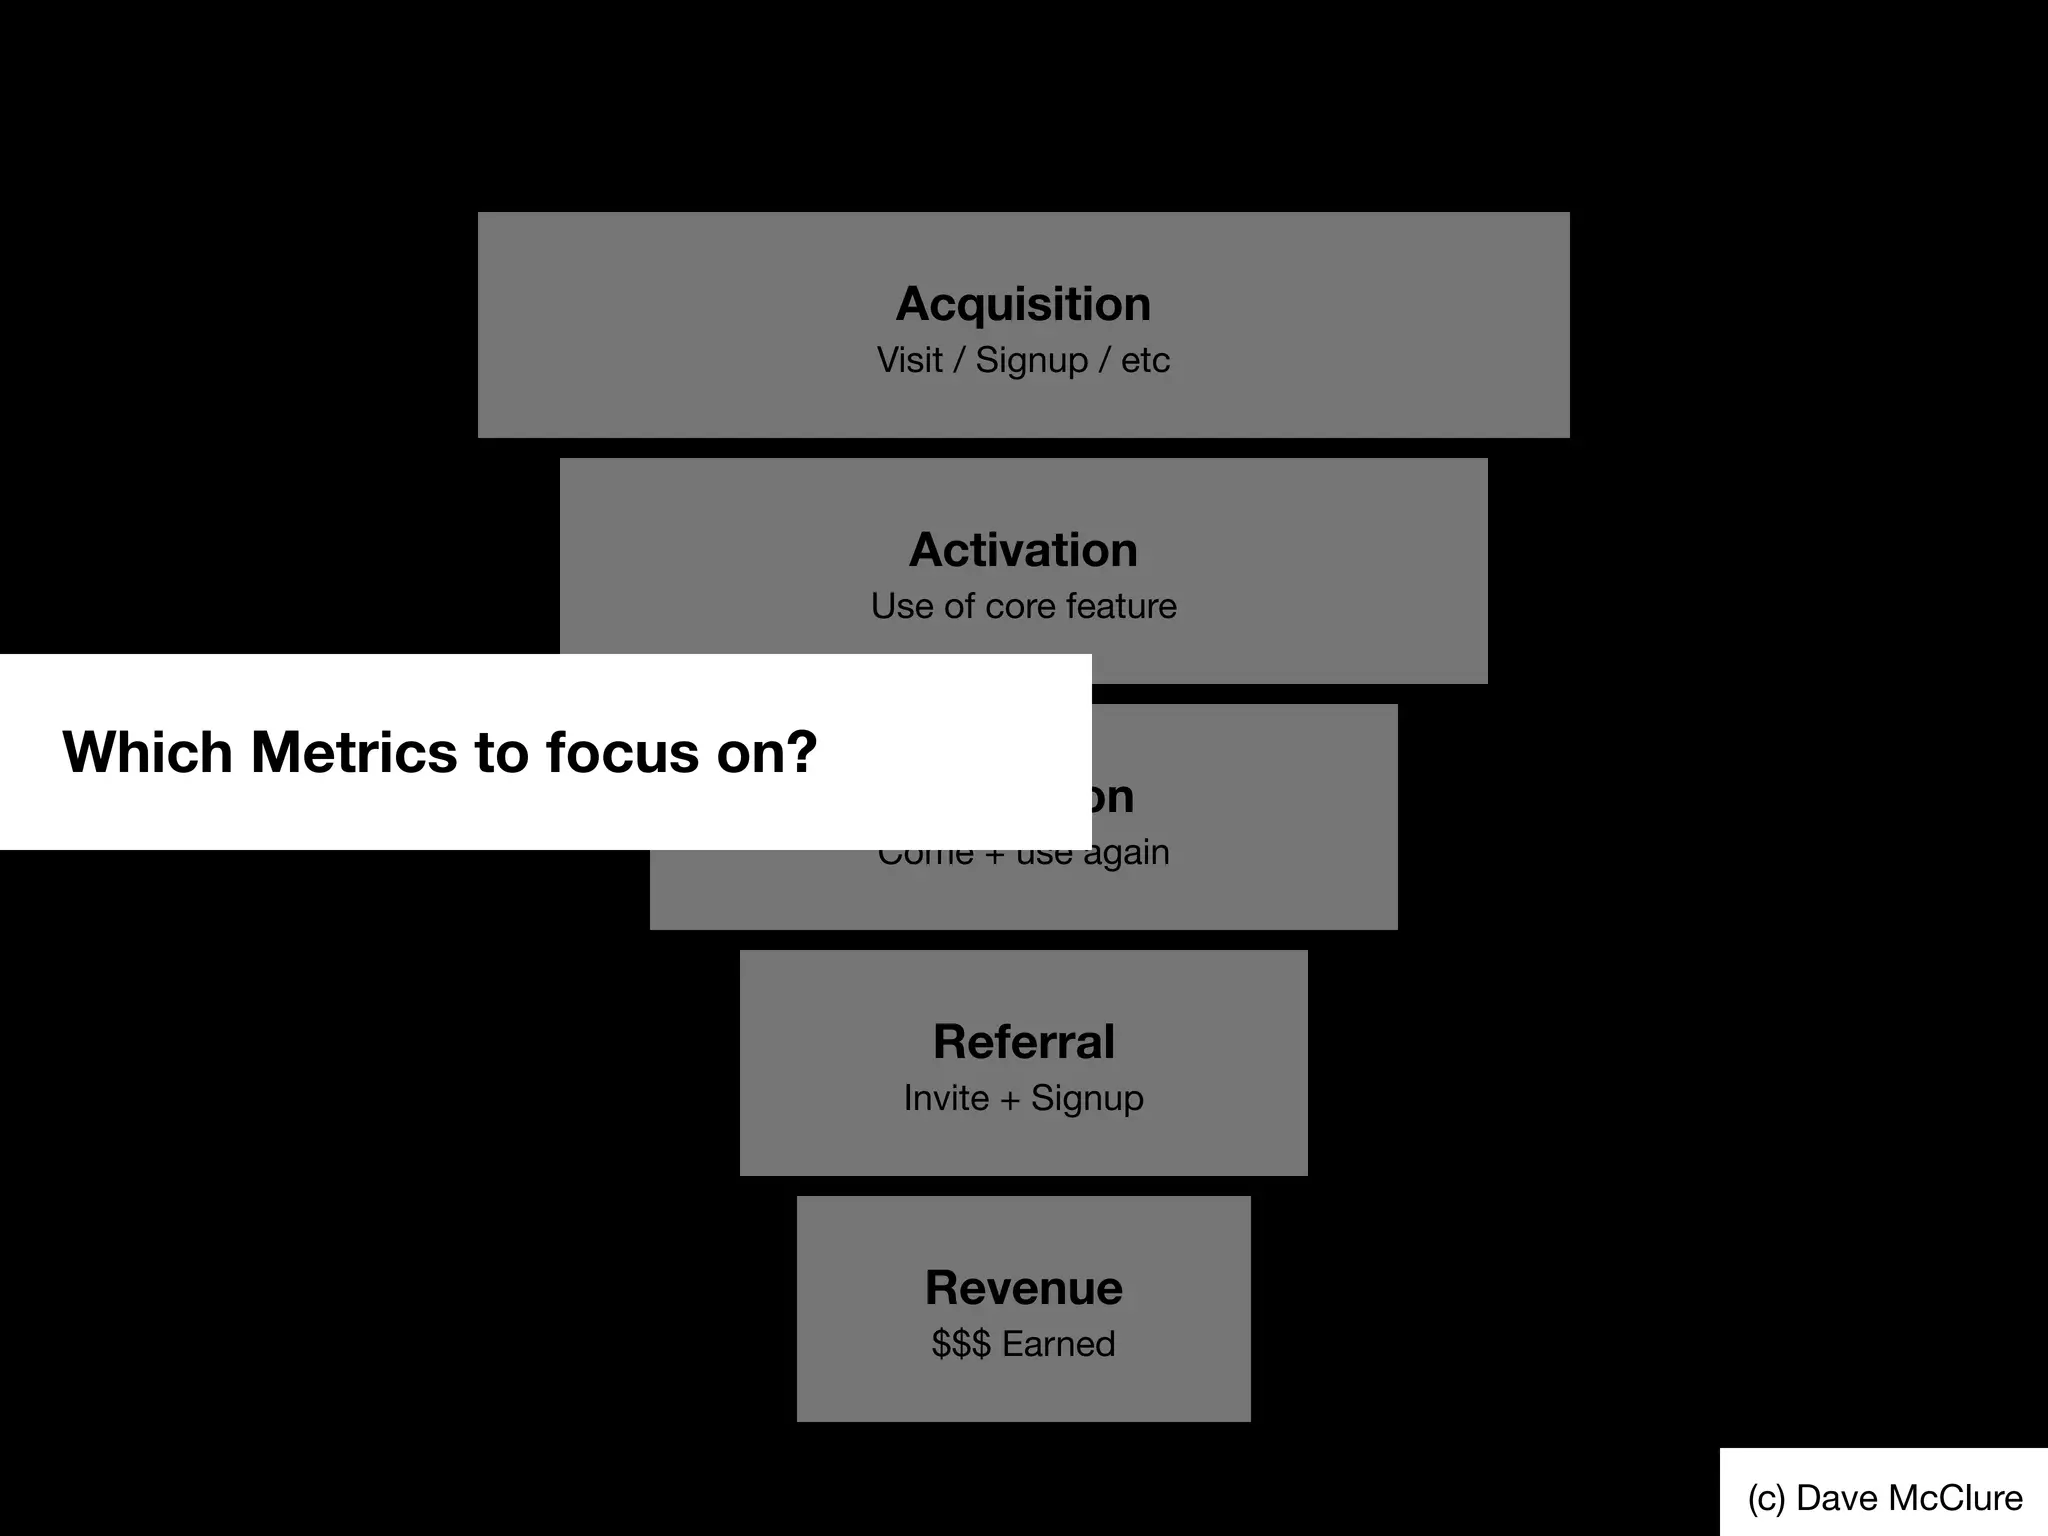
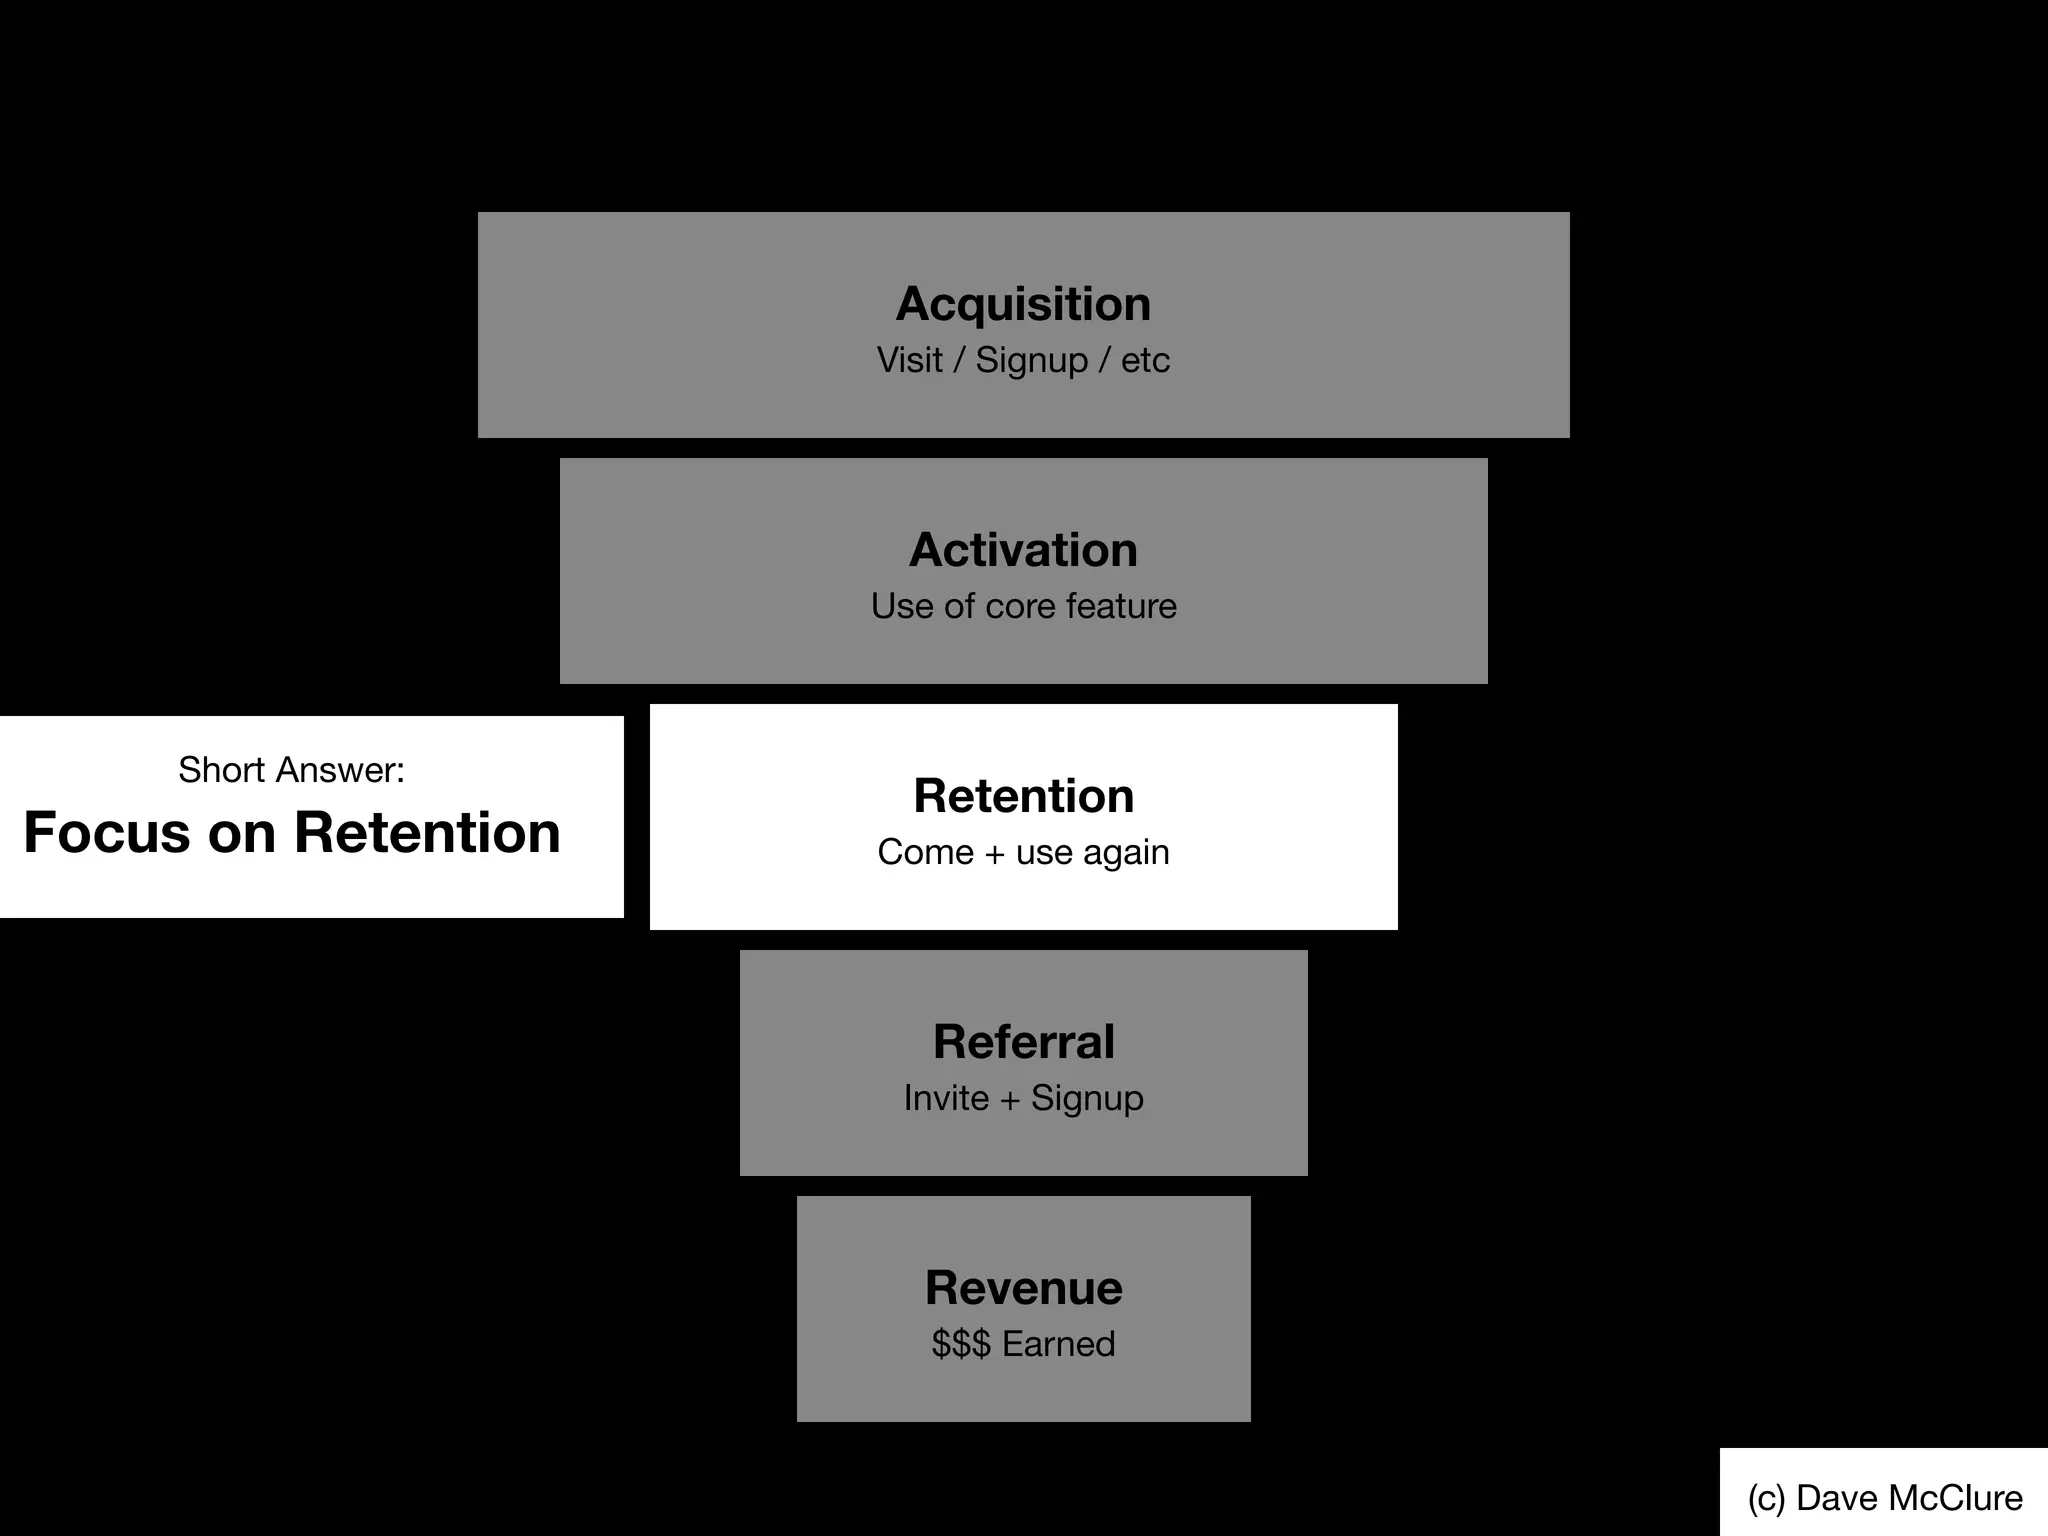
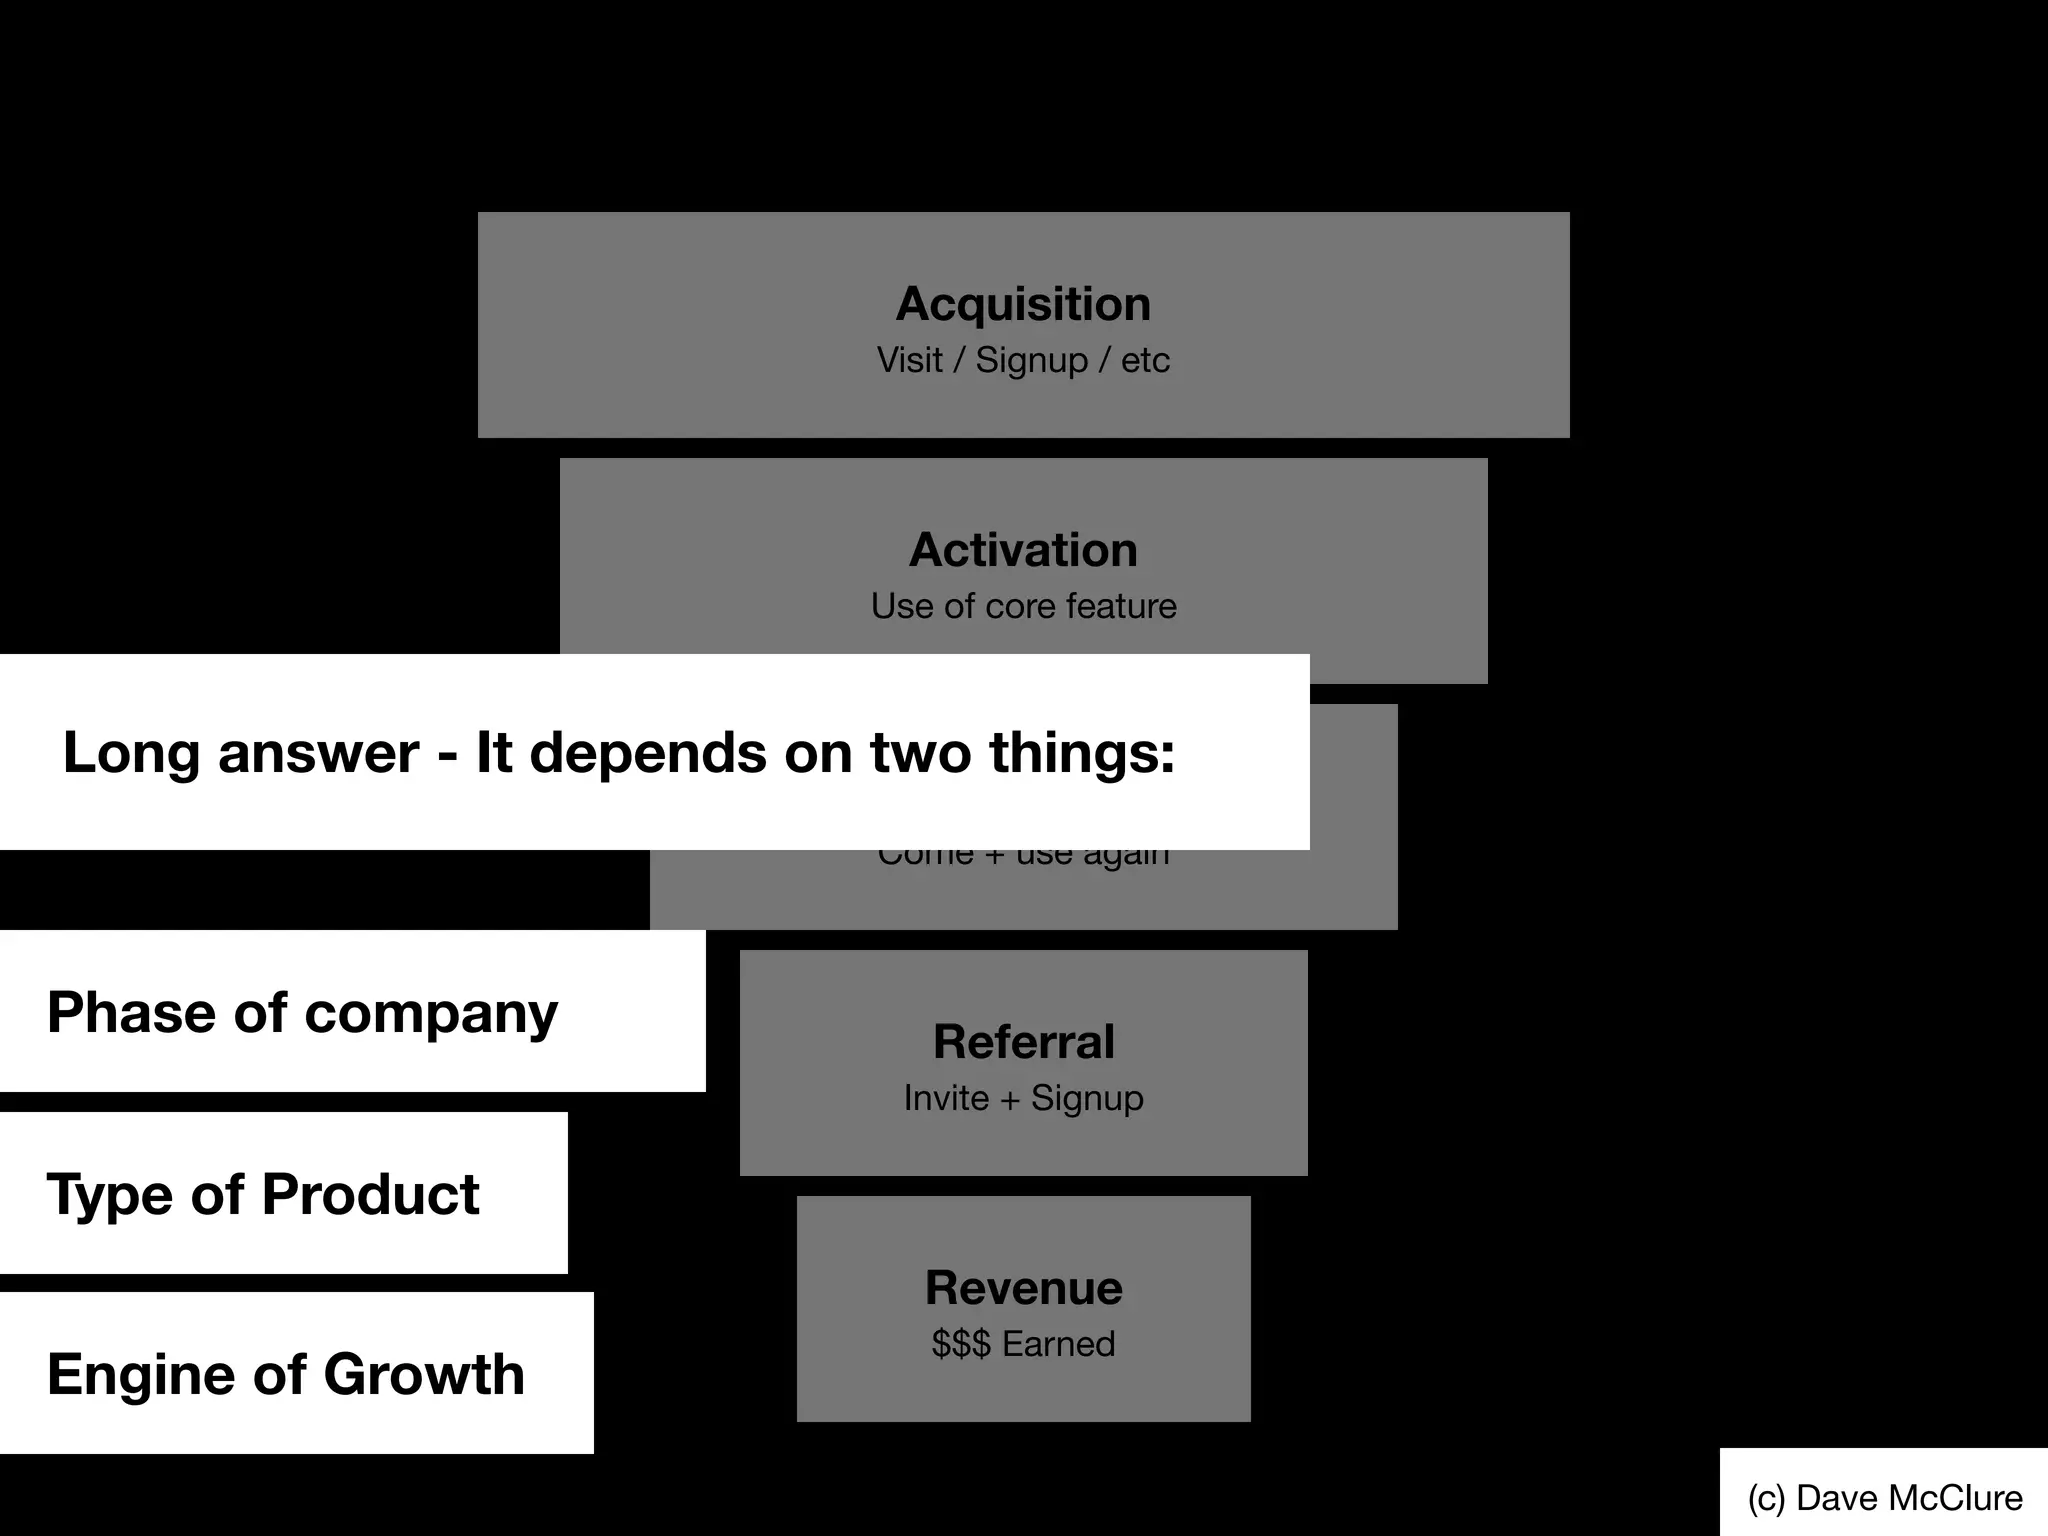
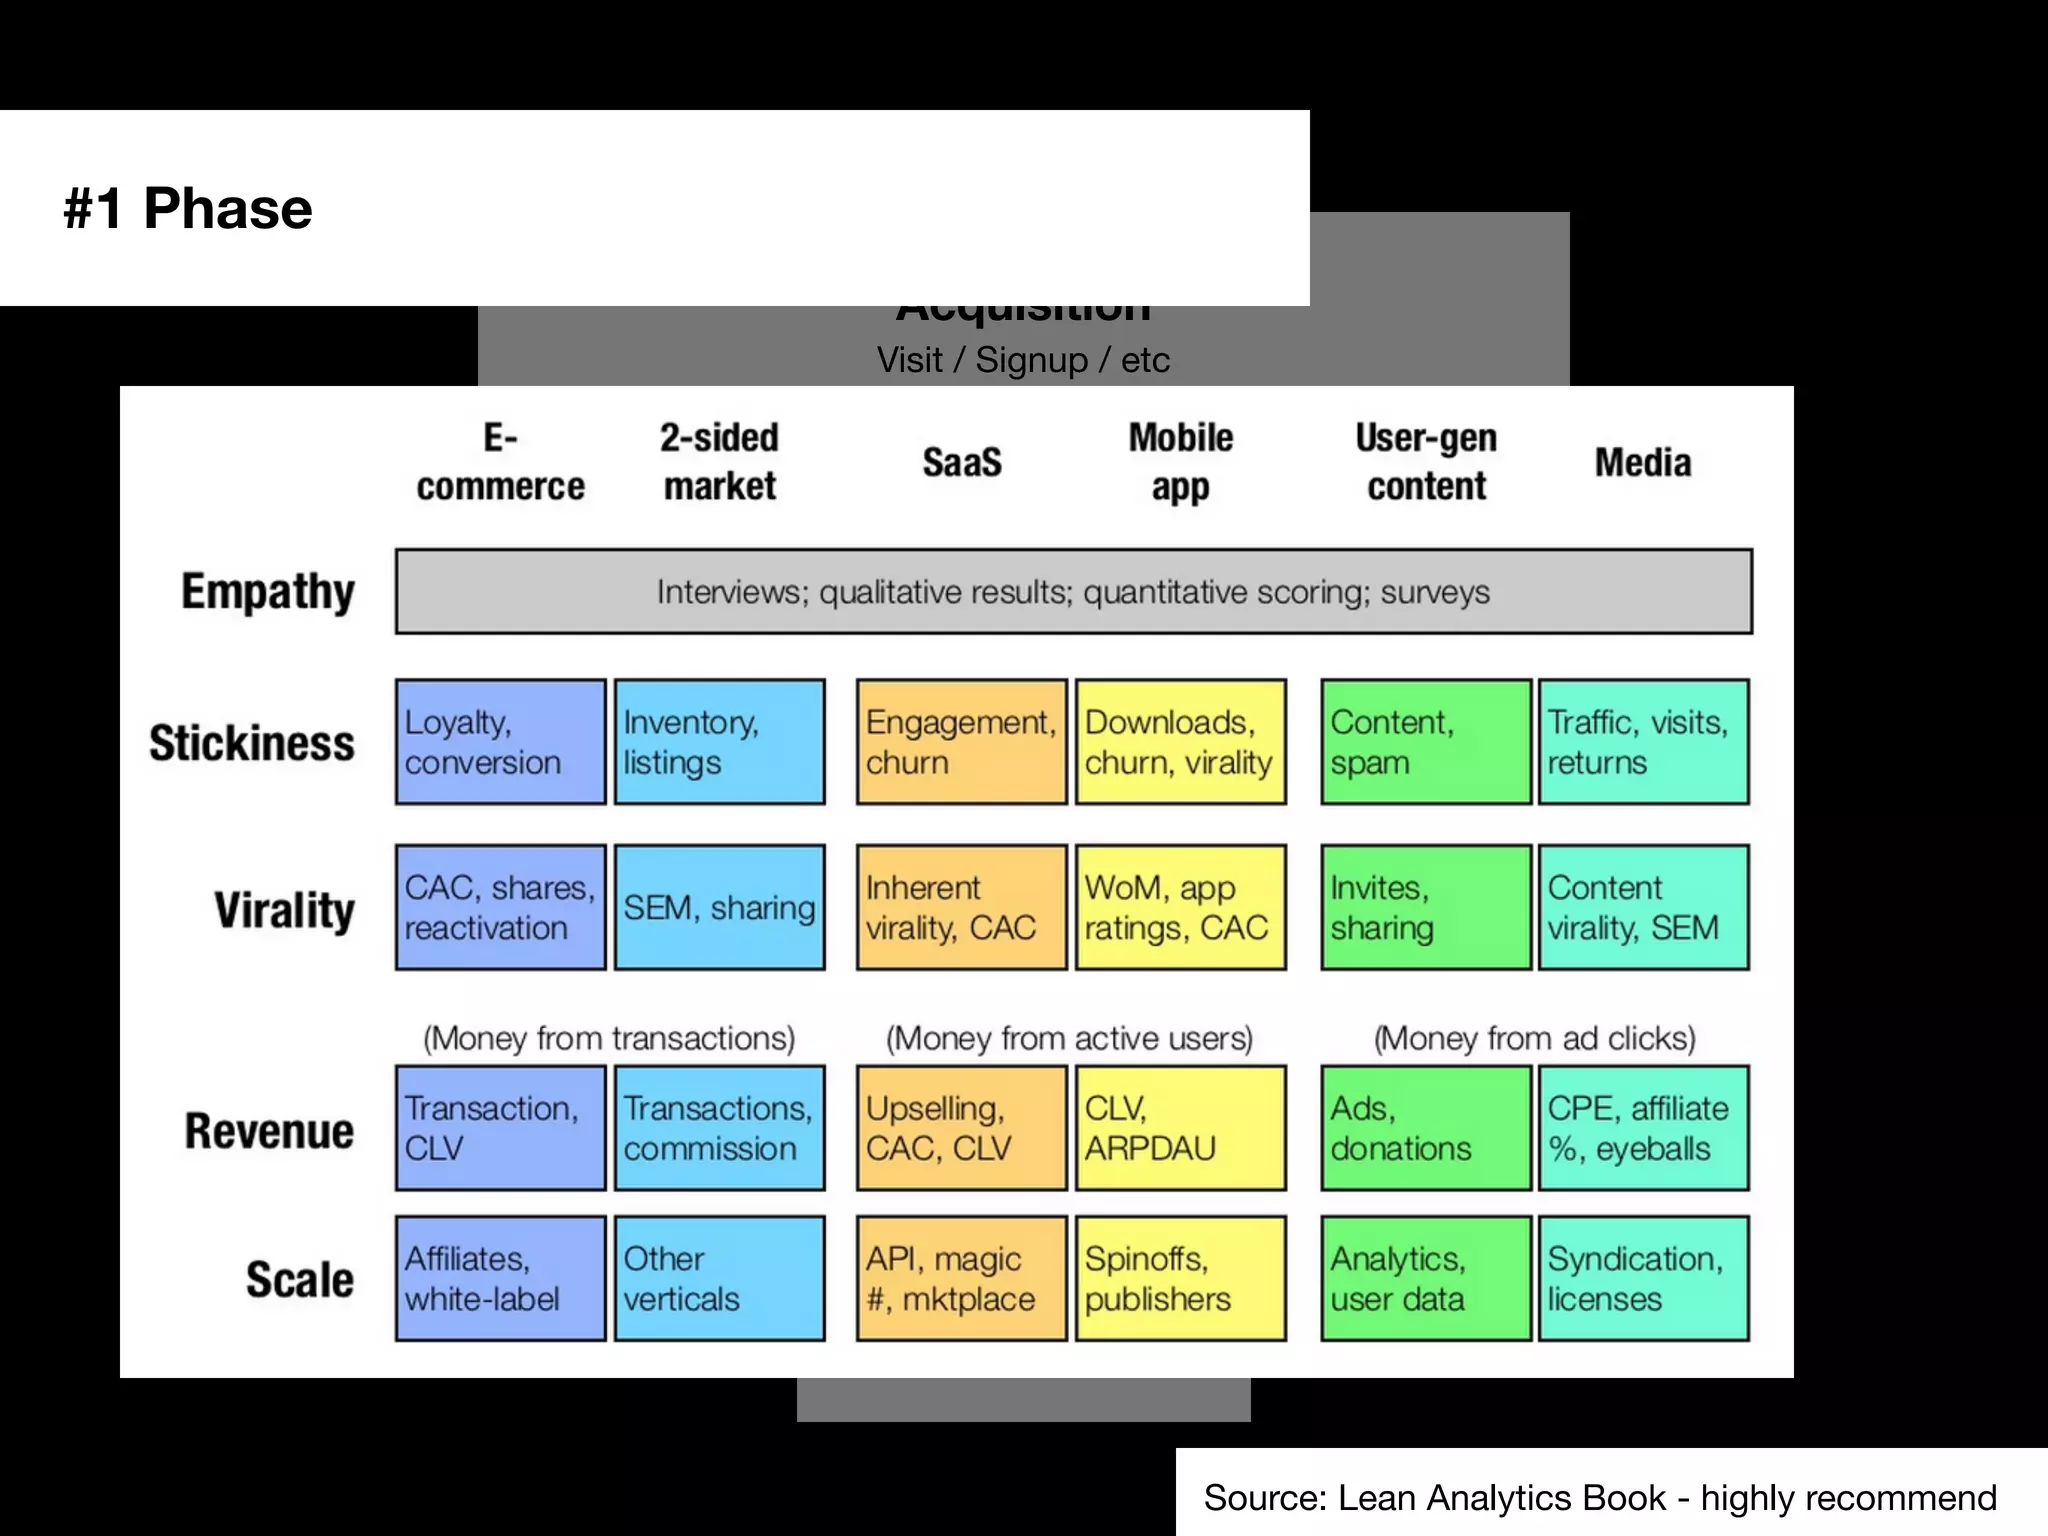
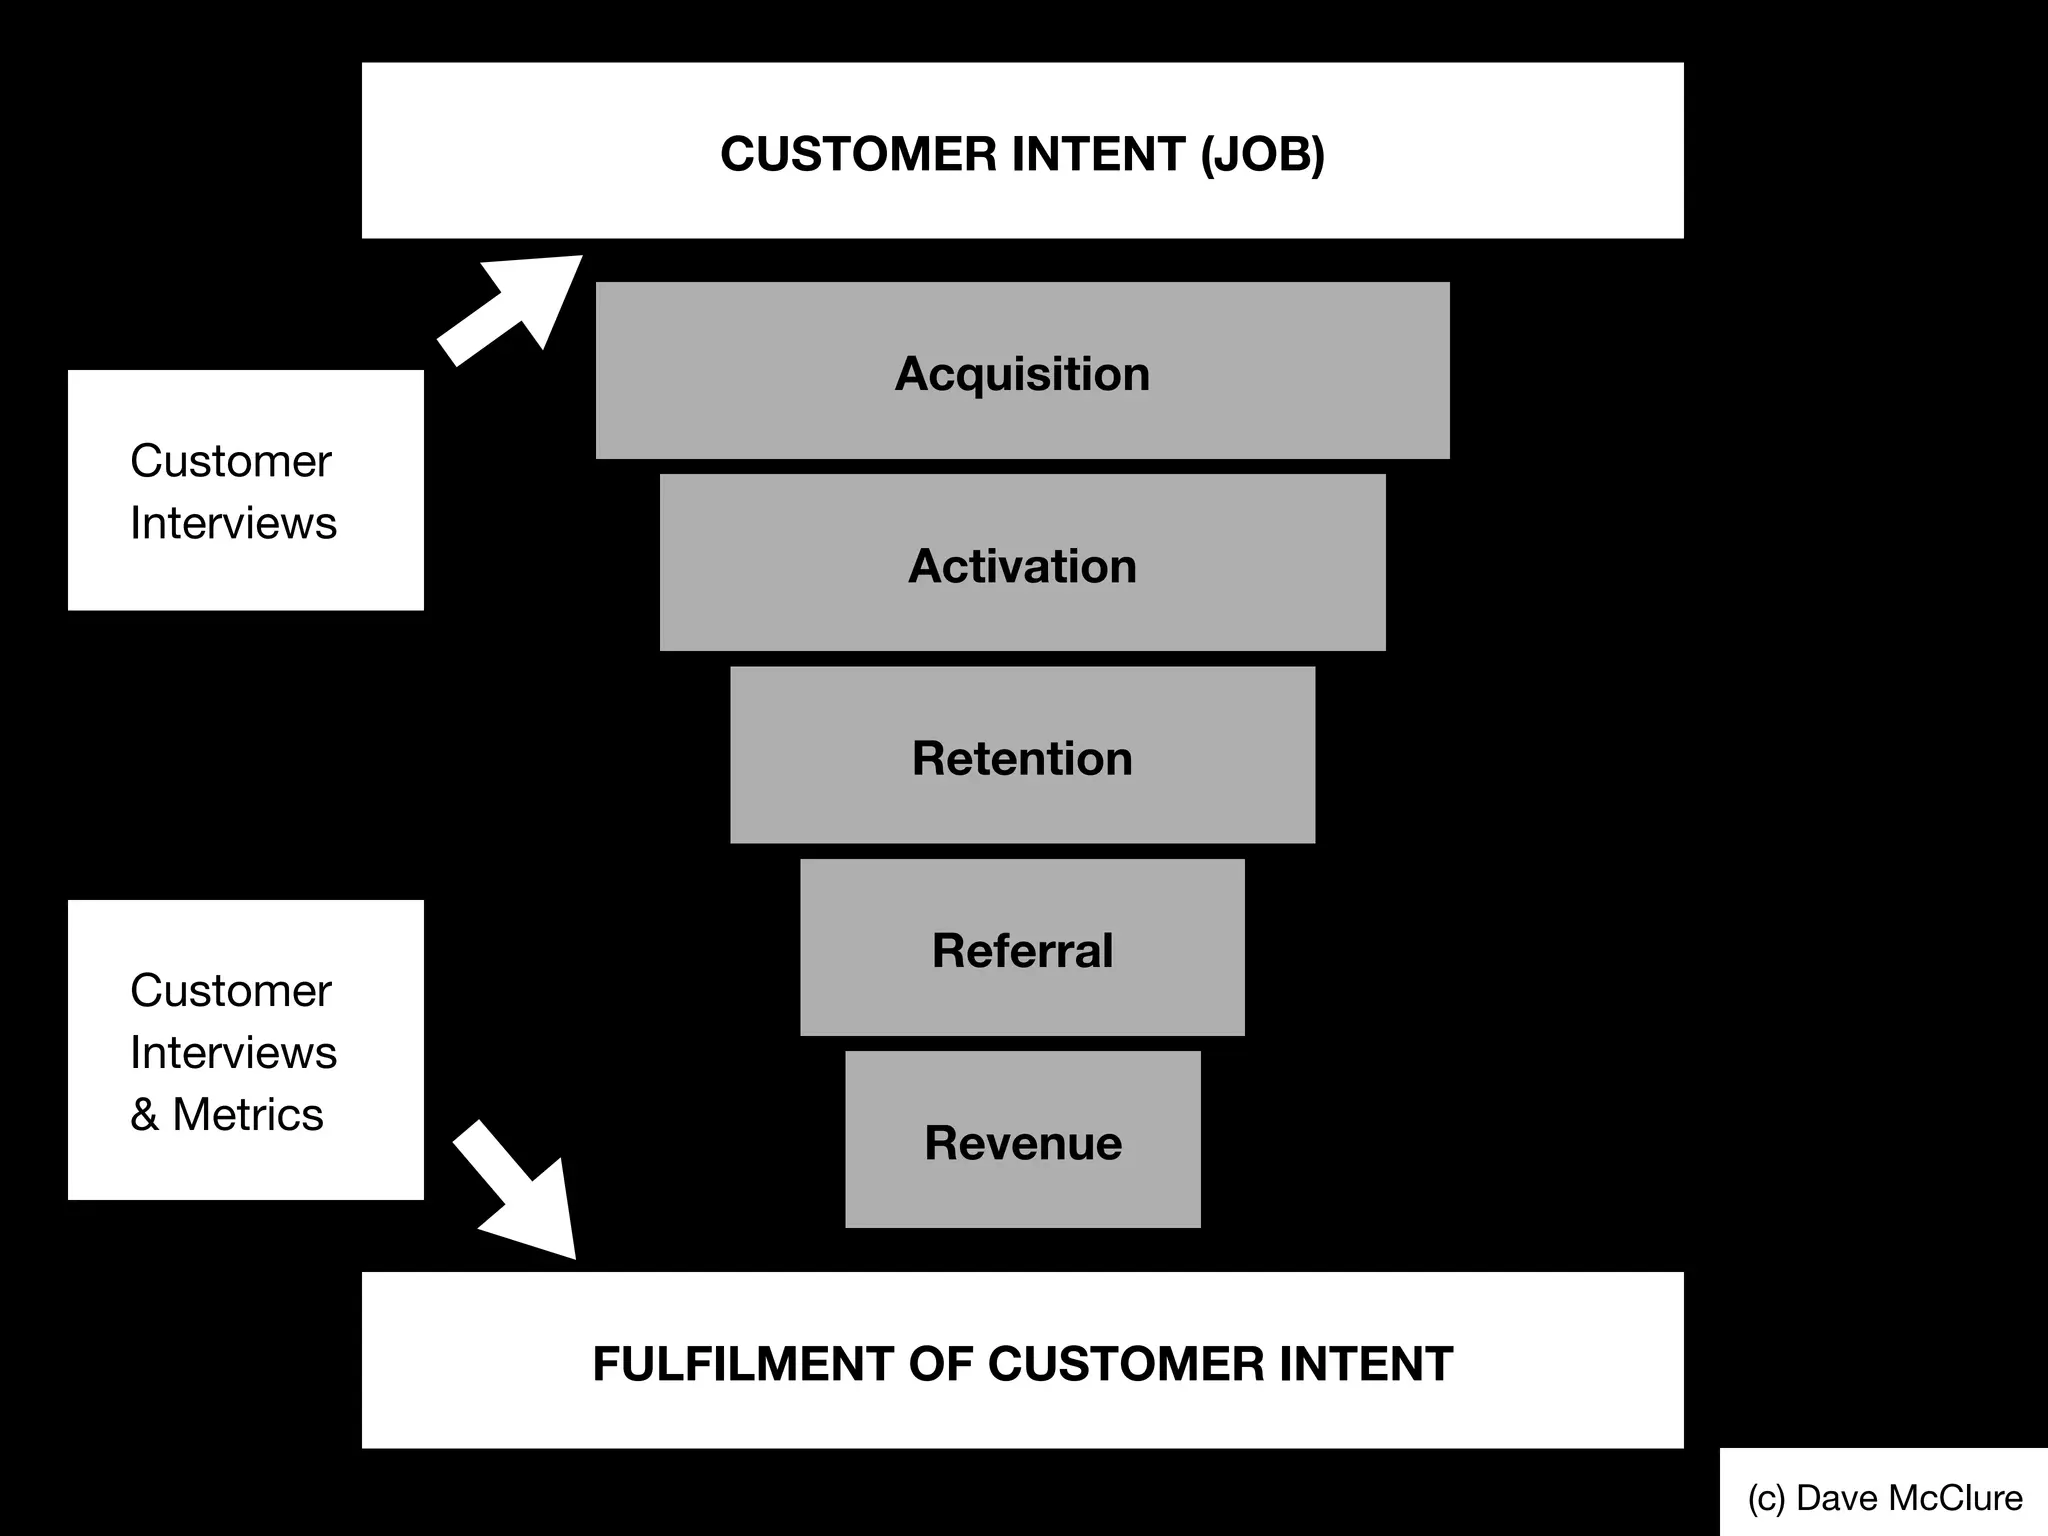
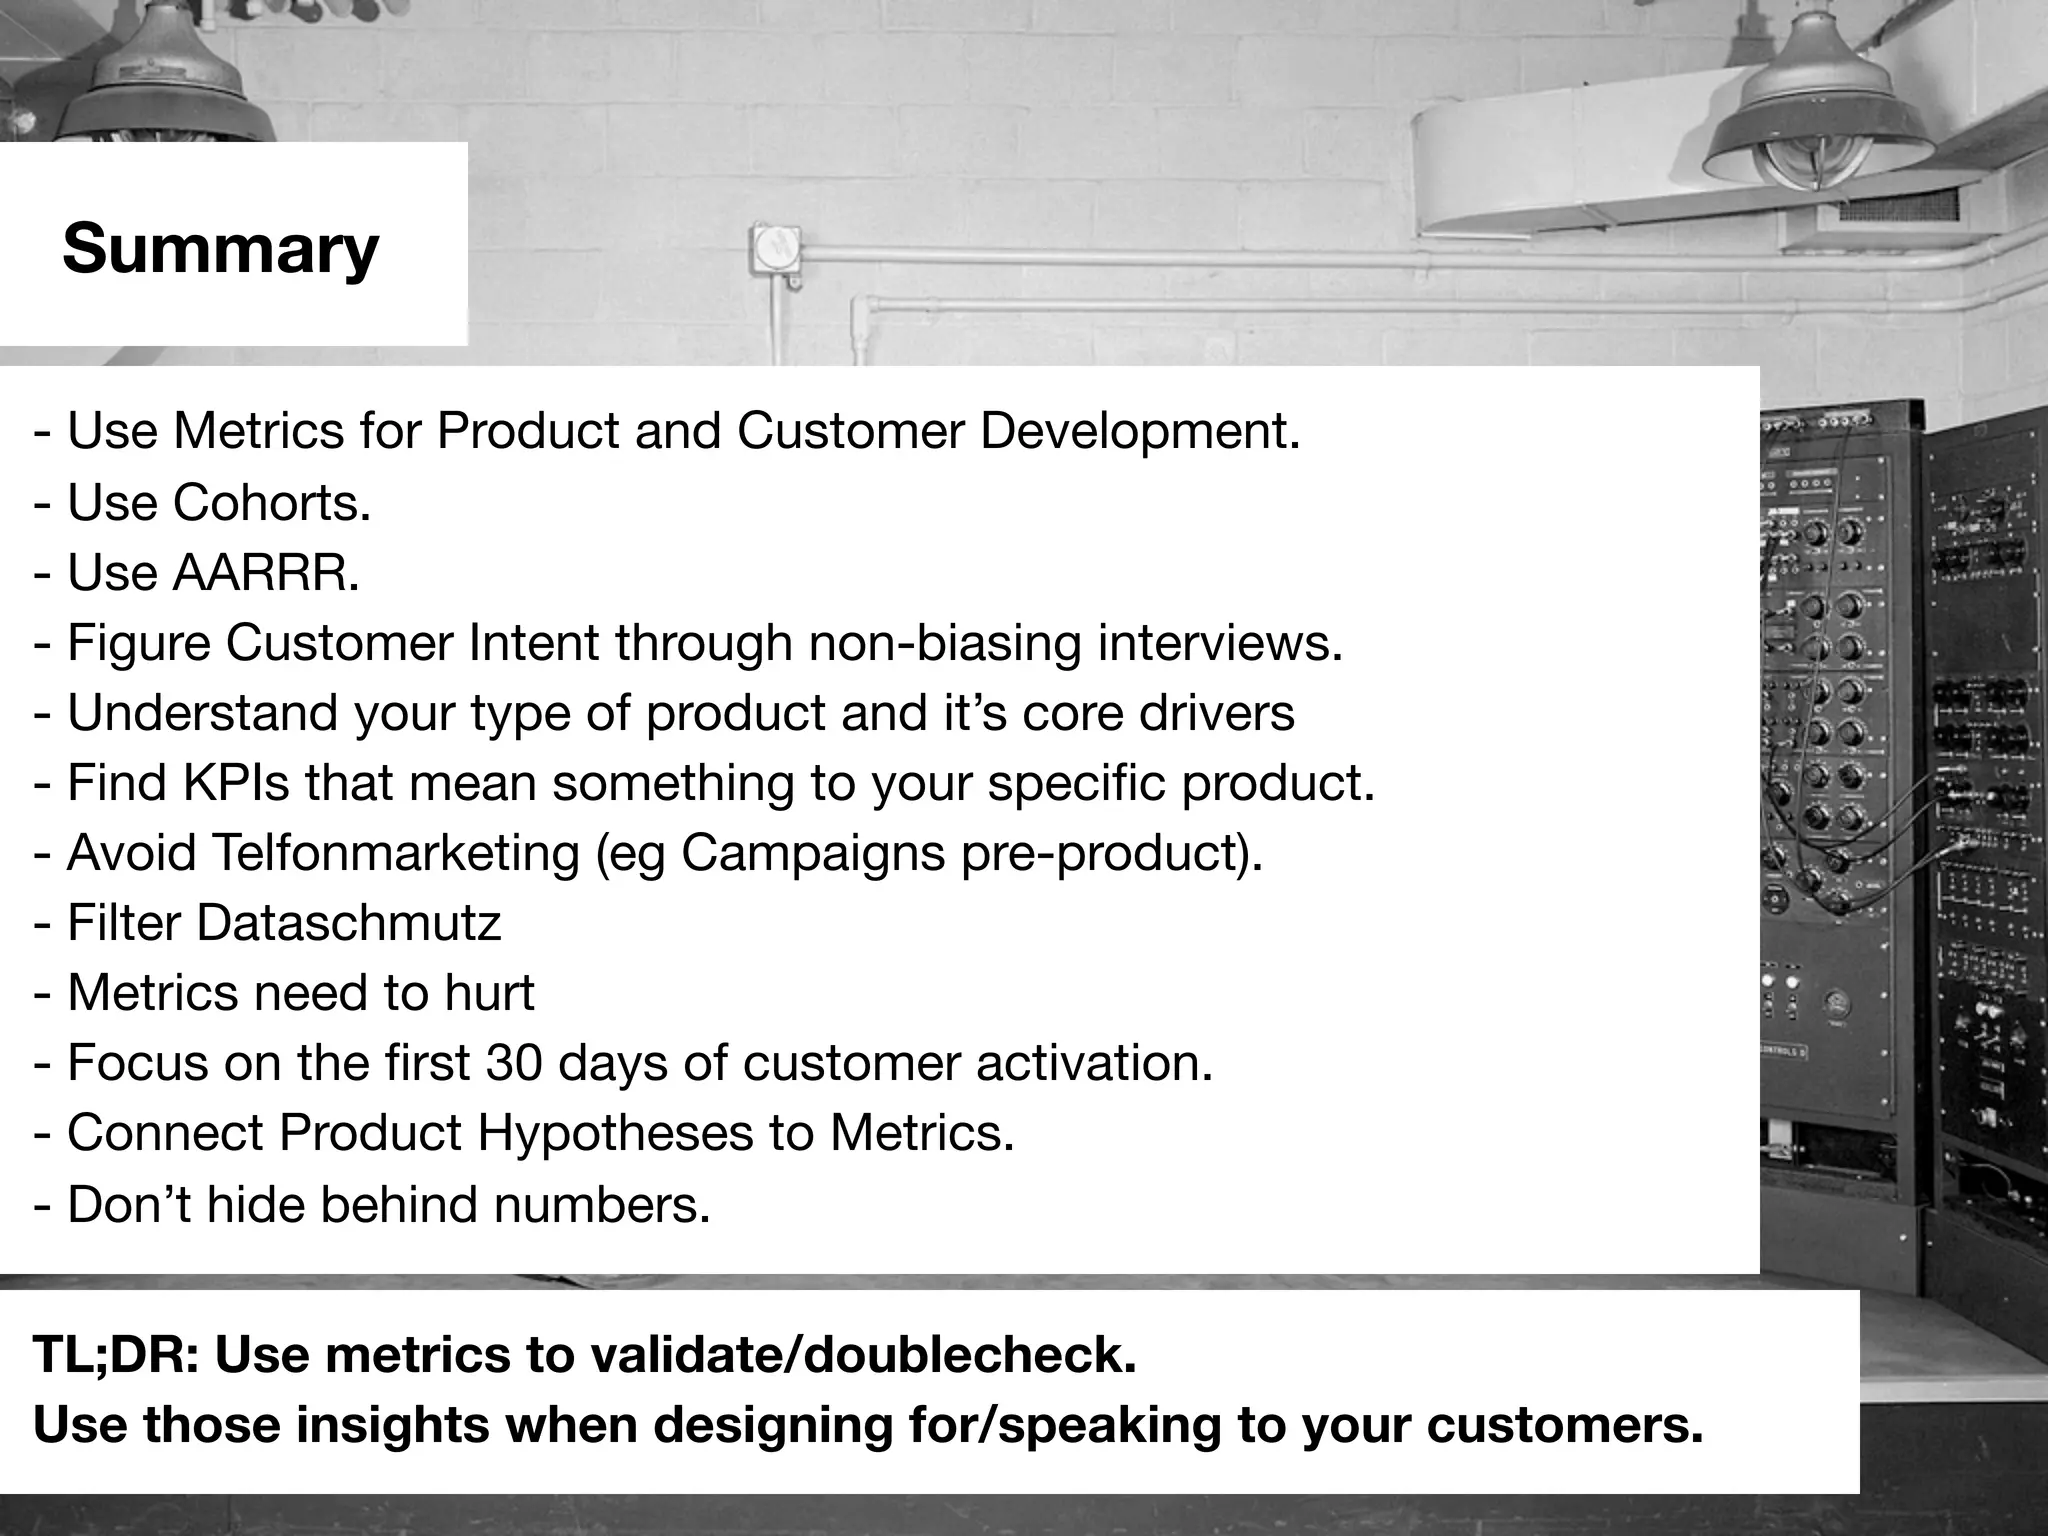
The document discusses startup metrics and emphasizes the importance of focusing on product-market fit, customer retention, and understanding the right metrics during early-stage development. It provides insights into early-stage metrics, potential pitfalls, and frameworks for evaluating customer success and engagement. The presentation stresses the need for startups to refine their product offerings based on customer feedback and to track meaningful KPIs that reflect potential growth and sustainability.
Overview of Startup Metrics, speaker introduction, and main topics including early stage metrics, dashboards, and lean analytics.
Discusses the major risks for startups, emphasizing customer acquisition and competitive challenges.
Insight on product/market fit; definition, significance, and characteristics of a product that meets market demand.
Explanation of traction over time, product/market fit, and statistics about startup phases with 83% being most critical.
Focus on marketing techniques, the importance of the right product insights, and pitfalls of early stage metrics.
Challenges with data accuracy in early stages, importance of user behavior insights, and using frameworks like AARRR for analysis. Segmenting users into cohorts, analyzing behavior and spending over time, applying AARRR framework for metrics.
Importance of retention metrics, user happiness, product type, and growth engines for startups.
Explores churn rates, user activation, reasons for churn, and strategies for reducing it.
Utilizing Lean Analytics to improve customer understanding and using metrics to gauge success.
Summary of key points on metrics, customer development, and resources for further reading about startup metrics.
Startup Metrics, a love story. All slides of an 6h Lean Analytics workshop.
1.
Startup Metrics, alove story.
Everything you need to know about
Startup Product Metrics.
#iCatapult Workshop - 2013-08-12
Slideshare Exclusive: The full Powerdeck. ;)
@andreasklinger
#emminvest – @andreasklinger
BuildingALMOST the right thing.
The Biggest Risk of a Startup?
Seeing the successful new competitor who does what you do,
but has one little detail different that you never focused on.
7.
“Startups don’t failbecause they lack a product;
they fail because they lack customers and a
profitable business model” Steve Blank
And it might have been where you didn’t look.
@andreasklinger
traction
time
Product/Market Fit
Find aproduct
the market wants.
Optimise the product
for the market.
Empathy Stickness Virality Revenue Scale
@andreasklinger
20.
traction
time
Product/Market Fit
Find aproduct
the market wants.
Optimise the product
for the market.
Most clones
start here.
People in search
for new product
start here.
Empathy Stickness Virality Revenue Scale
@andreasklinger
traction
time
Product/Market Fit
83% ofall startups are in here. Most stuff we learn about
web analytics is meant for this part
Empathy Stickness Virality Revenue Scale
@andreasklinger
25.
Most of thetechniques/pattern
we find when we look to learn about
metrics come out from Online Marketing
@andreasklinger
26.
A/B Testing, Funnels,Referral Optimization, etc etc
They are about optimizing, not innovating
@andreasklinger
What does itmean anyway?
“We have 50k registered users!”
Do they still use the service? Are they the right people?
“We have 5000 newsletter signups!”
Do they react? Are they potential customers?
“We have 500k app downloads!”
Do they still use the app?
@andreasklinger
38.
Some graphs alwaysgo up.
Vanity. Use it for the Press.
Not for your product.
@andreasklinger
It’s easy toimprove conversions
(of the wrong people)
This is a real example.
Thank the Internet.
Source: http://www.codinghorror.com/blog/2009/07/how-not-to-advertise-on-the-internet.html
@andreasklinger
41.
The same istrue for funnels.
It’s easy to optimize by pushing the wrong
people forward.
Disclaimer: this is not a real example. btw newrelic is awesome ;)
@andreasklinger
42.
The same istrue for funnels.
It’s easy to optimize by pushing the wrong
people forward.
Disclaimer: this is not a real example. btw newrelic is awesome ;)
@andreasklinger
43.
why early stagemetrics suck.
small something
Most likely
“Small Data”
Early Stage Product Metrics suck:
- We have the wrong product
- With the wrong communication
- Attacting the wrong targetgroup
- Who provide us too few datapoints
@andreasklinger
44.
Early stage productmetrics get easily
affected by external traffic.
One of our main goals is to minimize that effect.
@andreasklinger
45.
Values: 0, 0,0, 100
What’s the average?
#1
@andreasklinger
46.
Values: 0, 0,0, 100
What’s the average? 25
What’s the median?
#1
@andreasklinger
47.
#scb13 – @andreasklinger
Values:0, 0, 0, 100
What’s the average? 25
What’s the median? 0
Eg. “Average Interactions”
can be Bollocks
#1
48.
#scb13 – @andreasklinger
Values:0, 0, 0, 100
What’s the average? 25
What’s the median? 0
Eg. “Average Interactions”
can be Bollocks
#1
49.
Values: 0, 5,10
What’s the average?
#2
@andreasklinger
50.
#scb13 – @andreasklinger
Values:0, 5, 10
What’s the average? 5
What’s the standard
deviation? 4,08
=> “Average” hides information.
#2
51.
“This is notstatistical
significant.”
I don’t care.
We are anyway playing dart in a
dark room.
Let’s try to get it as good as
possible and use our intuation
for the rest.
#3
@andreasklinger
How can weuse metrics?
To Explore (Examples)
Investigate an
assumption.
Look for causalities.
Validate customer
feedback.
Validate internal opinions.
To Report (Examples)
Measure Progress.
(Accounting)
Measure Feature Impact.
See customer happiness/
health.
@andreasklinger
56.
What do imeasure?
TL;DR: In case of doubt, people.
Hits
Visits
Visitors
People
Views
Clicks
Page Views
Conversions
Engagement
@andreasklinger
#scb13 – @andreasklinger
Framework:AARRR
Explainable (If you don’t get it it means nothing)
What are good KPIs?
Linked to assumptions of your product (validation/falsify)
Rate or Ratio (0.X or %)
Comparable (To your history (or a/b). Forget the market)
62.
#scb13 – @andreasklinger
Framework:AARRR
“Industry Standards”
Use industry averages as reality check.
Not as benchmark.
- Usually very hard to get.
- Everyone defines stuff different.
- You might end up with another business
model anyway.
- Compare yourself vs your history data.
Segment Users intoCohorts
Like it
People 0-25 3%
People 26-50 4%
People 51-75 65%
@andreasklinger
67.
Segment Users intoCohorts
Average Spending
Jan €5
Feb €4.5
Mar €5
Apr €4.25
May €4.5
... ...
Averages can hide patterns.
@andreasklinger
68.
Segment Users intoCohorts
1 2 3 4 5
Jan €5 €3 €2 €1 €0.5
Feb €6 €4 €2 €1
Mar €7 €6 €5
Apr €8 €7
May €9
... ...
Registration Month
Month Lifecycle
Insight: Users spend less over time in average.
We still don’t know if they spend less, or if less people spend at all.
@andreasklinger
Acquisition
Visit / Signup/ etc
Activation
Use of core feature
Retention
Come + use again
Referral
Invite + Signup
Revenue
$$$ Earned
(c) Dave McClure
71.
Example: Blossom.io
Kanban ProjectMangement Tool
created a card
Activation
moved a card
Retention
invited team members
Referral
have upgraded
Revenue
(people who) registered an account
Acquisition
72.
Example: Photoapp
created firstphoto
Activation
opened app twice in perioid
Retention
shared photo to fb
Referral
??? (exit?)
Revenue
(people who) registered an account
Acquisition
Acquisition
Visit / Signup/ etc
Activation
Use of core feature
Retention
Come + use again
Referral
Invite + Signup
Revenue
$$$ Earned
(c) Dave McClure
Which Metrics to focus on?
76.
Acquisition
Visit / Signup/ etc
Activation
Use of core feature
Retention
Come + use again
Referral
Invite + Signup
Revenue
$$$ Earned
Short Answer:
Focus on Retention
(c) Dave McClure
Acquisition
Visit / Signup/ etc
Activation
Use of core feature
Retention
Come + use again
Referral
Invite + Signup
Revenue
$$$ Earned
(c) Dave McClure
Long answer - It depends on two things:
Phase of company
Type of Product
Engine of Growth
80.
Acquisition
Visit / Signup/ etc
Activation
Use of core feature
Retention
Come + use again
Referral
Invite + Signup
Revenue
$$$ Earned
Source: Lean Analytics Book - highly recommend
#1 Phase
81.
Acquisition
Visit / Signup/ etc
Activation
Use of core feature
Retention
Come + use again
Referral
Invite + Signup
Revenue
$$$ Earned
#2 Engine of Growth
Paid
Make more money on a customer
than you spend, to buy new ones. Eg. Saas
Viral
A Users brings more than one new user.
Eg. typical interactive ad-campaigns
@andreasklinger
Sticky
Keep your userbase to improve your quality.
Eg. Communities
82.
Acquisition
Visit / Signup/ etc
Activation
Use of core feature
Retention
Come + use again
Referral
Invite + Signup
Revenue
$$$ Earned
#2 Type of Company (linked to Engine of Growth)
Saas
Build a better product
Social Network/Community
“(subjective) Critical Mass”
Marketplace
Get the right sellers
and many more...
@andreasklinger
83.
Acquisition
Visit / Signup/ etc
Activation
Use of core feature
Retention
Come + use again
Referral
Invite + Signup
Revenue
$$$ Earned
Short Answer:
Focus on Retention
(c) Dave McClure
Acquisition
Visit / Signup/ etc
Activation
Use of core feature
Retention
Come + use again
Referral
Invite + Signup
Revenue
$$$ Earned
Short Answer:
Focus on Retention
(c) Dave McClure
Eg. Did core-action X
times in period.
86.
Dig deeper: Crashpadder’sHappiness Index
e.g. Weighted sum over core activities by hosts.
Cohorts by cities and time.
= Health/Happiness Dashboard
Marketplaces
/ 2-sided models
AmazonApproach:
1) Create loads of inventory
for longtail search
2) Create demand
3) Have shitloads of money.
4) Wait and win.
Boticca (aka Startup)
Approach:
1) Focus on one niche
Targetgroup
2) Create “enough”
inventory with very few
sellers
3) Create demand
4) Create more demand
5) Add a few more sellers.
Repeat. Pray.
90.
How to solvethe
Chicken and Egg
Problem TL;DR:
You need very few
but very good and
happy chickens
to get a lot of eggs.
Btw: If the chickens
don’t come by
themselves, buy them.
Uber paid 30$/h to the
first drivers.
Ignore the “minor
chickens”, they come
anyway.
91.
#scb13 – @andreasklinger
Framework:AARRR
Example Mobile App: Pusher2000
Trainer2peer pressure sport app (prelaunch “beta”).
Rev channel: Trainers pay monthly fee.
Two sided => Segment AARRR for both sides (trainer/user)
Marketplace => Value = Transactions / Supplier
Social Software => DAU/MAU to see if activated users stay active
Chicken/Egg => You need a few very happy chickens for loads of eggs.
Activated User: More than two training sessions
Week/Week retention to see if public launch makes sense
Optimize retention: Interviews with Users that left
Measure Trainer Happiness Index
Pushups / User / Week to see if the core assumption (People will do
more pushups) is valid
A Startup shouldalways only focus on
one core metric to optimize.
Metrics need to hurt
Your dashboard should only show
metrics you are ashamed of.
@andreasklinger
99.
Have two dashboards(example bufferApp):
A actionable board to work on your product
(eg. % people buffering tweets in week 2)
A vanity board one to show to investors and tell to the press
(eg. total amount of tweets buffered)
Metrics need to hurt
@andreasklinger
100.
If you arenot ashamed about the KPIs in
your product dashboard than something is
wrong.
Either you focus on the wrong KPIs.
OR you do not drill deep enough.
Metrics need to hurt
@andreasklinger
101.
Example: Garmz/LOOKK
Great Numbers:
90%activation (activation = vote)
But they only voted for friends
instead of actually using the platform.
We drilled (not far) deeper:
Activation = Vote for 2 different designers. Boom. Pain.
Metrics need to hurt.
Metrics need to hurt
@andreasklinger
Viral Distribution
3 kindsof virality
Product Inherent
A function of use. Eg. Dropbox sharing
Product Artificial
Added to support behaviour. E.g.
Reward systems
Word of Mouth
Function of customer satisfaction.
Source: Lean Analytics
110.
Viral Distribution
Invitation Rate= Invited people / inviters
eg. 1250 users invited 2000 people = 1.6
Acceptance Rate = Invited Signed-up / Invited total
eg. out of the 2000 people 580 signed up = 0.29
Viral Coefficient = Invitation Rate * Acceptance Rate
eg. 1.6 * 0.29 = 0.464
(every customer will bring half a customer additionally)
111.
Viral Distribution
Important #1:
Unlessyour Growth Engine is Viral,
don’t focus early on Viral Factors.
Focus on retention/stickyness.
Important #2: Viral Cycle Time (time between recv
invite and sending invite) is extremely important.
eg. K = 2
Cycle Time: 2 days => 20 days = 20.470 users
Cycle Time: 1 day => 20 days = 20mio users
Source: http://www.forentrepreneurs.com/lessons-learnt-viral-marketing/
#scb13 – @andreasklinger
Churnis not what you think it is
“5% Churnrate per month”
One of the highest churn reasons is expired
credit cards.
Sad Fact: People forget about you.
@andreasklinger
114.
#scb13 – @andreasklinger
Churnis not what you think it is
People don’t
wake up and
suddenly want to
unsubscribe your
service...
“Oh.. it’s May 5th..
Better churn from that
random online startup i
found 2 months ago.”
@andreasklinger
115.
#scb13 – @andreasklinger
Churnis not what you think it is
You loose them in the
first 3 weeks.
And then at some point just
remind them to unsubscribe.
That’s when we measure it (too
late).
Source: Intercom.io
User activation.
Some usersare happy (power users)
Some come never again (churned users)
What differs them? It’s their activities in their first 30 days.
@andreasklinger
119.
Sub-funnels
“What did thepeople do
that signed up,
before they signed up,
compare to those who didn’t?”
Source: Usercycle
120.
#scb13 – @andreasklinger
Howoften did activated users
use twitter in the first month:
7 times
What did they do?
Follow 20 people, followed
back by 10
Churn:
If they don’t keep them 7 times
in the first 30 days.
They will lose them forever.
It doesn’t matter when a user
remembers to unsubscribe
Example Twitter
121.
#scb13 – @andreasklinger
ExampleTwitter:
How did they get more people
to follow 30people within
7visits in the first 30 days?
Ran assumptions, created
features and ran experiments!
Watch: http://www.youtube.com/watch?v=L2snRPbhsF0
Example Twitter
Dataschmutz
A layer ofdirt obfuscating
your useable data.
(~ sample noise we created ourselves)
Usually “wrong intent”.
Usually our fault.
@andreasklinger
Dataschmutz
A layer ofdirt obfuscating
your useable data.
e.g. Traffic Spikes of wrong
customer segment.
(wrong intent)
@andreasklinger
More “wrong” people come.
Lower conversion rate on the
landing page.
131.
How to minimizethe impact of Dataschmutz
Base your KPIs on wavebreakers.
WK visitors acquisition activation retention referral revenue
Birchbox visit registration first photo
twice a
month
share …
1 6000 66% / 4000 62,5% 25% 10%
2 25000 35% / 8750 65% 23% 9%
3 5000 70% / 3500 64% 26% 4%
Competition Created
“Dataschmutz”
* Usershad huge extra incentive.
* Marketing can hurt your numbers.
* While we decided on how to
relaunch we had dirty numbers.
Dataschmutz
Competitions (before P/M Fit)
are nothing but Teflon Marketing
People come. People leave.
They leave dirt in your database.
Competitions create artificial incentive
“Would you use my app and might
win 1.000.000 USD?”
@andreasklinger
Lean Analytics
Hypothesis: Webelieve that introducing a newsfeed
will increase interaction between users.
Track: Engagement between users (comments/likes)
Falsifiable Hypothesis: People who visited the
newsfeed will give a 30% more comments and likes,
than people who didn’t.
138.
Lean Analytics
Important #1:
Don’tforget to timebox experiments.
Important #2:
Worry less about statistical significance (while early stage).
Just use experiments to doublecheck your entrepreneurial
intuition.
Metrics are horribleway to understand customer intent
Customer Intent = His “Job to be done”
Watch: http://bit.ly/cc-jtbd
Products are bought because
they solve a “job to be done”.
Learn about Jobs to be done Framework
@andreasklinger
144.
Metrics are horribleway to understand customer intent
Great Way: Customer Interviews
But: We bias our people,
when we ask them.
Even if we try not to.
Reason: we believe our
own bullshit.
Watch: www.hackertalks.io
#scb13 – @andreasklinger
Framework:AARRR
Groupwork.
- Draw your customer journey
- Pick a point where there is likely a problem
- Formulate assumption
- Formulate Success Criteria
Summary
- Use Metricsfor Product and Customer Development.
- Use Cohorts.
- Use AARRR.
- Figure Customer Intent through non-biasing interviews.
- Understand your type of product and it’s core drivers
- Find KPIs that mean something to your specific product.
- Avoid Telfonmarketing (eg Campaigns pre-product).
- Filter Dataschmutz
- Metrics need to hurt
- Focus on the first 30 days of customer activation.
- Connect Product Hypotheses to Metrics.
- Don’t hide behind numbers.
TL;DR: Use metrics to validate/doublecheck.
Use those insights when designing for/speaking to your customers.
151.
Read on
Startup metricsfor Pirates by Dave McClure
http://www.slideshare.net/dmc500hats/startup-metrics-for-pirates-long-version
Actionable Metrics by Ash Mauyra
http://www.ashmaurya.com/2010/07/3-rules-to-actionable-metrics/
Data Science Secrets by DJ Patil - LeWeb London 2012
http://www.youtube.com/watch?v=L2snRPbhsF0
Twitter sign up process
http://www.lukew.com/ff/entry.asp?1128
Lean startup metrics - @stueccles
http://www.slideshare.net/stueccles/lean-startup-metrics
Cohorts in Google Analytics - @serenestudios
http://danhilltech.tumblr.com/post/12509218078/startups-hacking-a-cohort-analysis-with-google
Rob Fitzpatrick’s Collection of best Custdev Videos - @robfitz
http://www.hackertalks.io
Lean Analytics Book
http://leananalyticsbook.com/introducing-lean-analytics/
Actionable Metrics - @lfittl
http://www.slideshare.net/lfittl/actionable-metrics-lean-startup-meetup-berlin
App Engagement Matrix - Flurry
http://blog.flurry.com/bid/90743/App-Engagement-The-Matrix-Reloaded
My Blog
http://www.klinger.io