Download to read offline
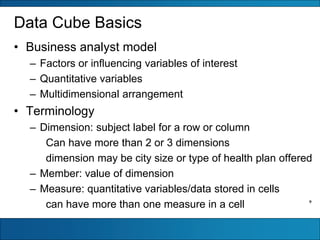


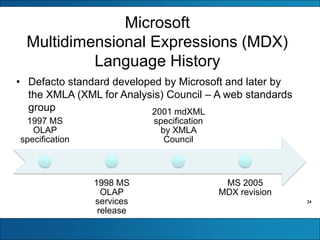
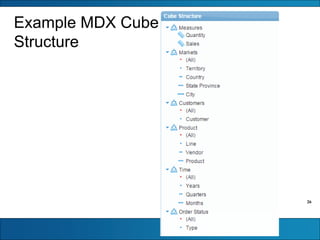
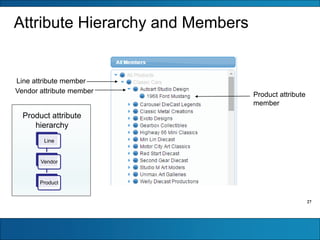
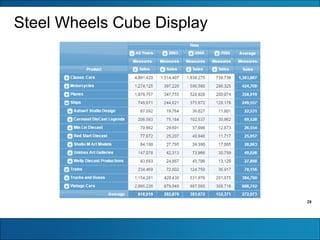
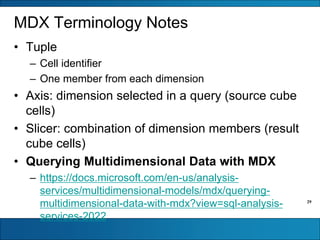
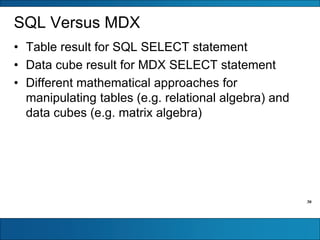
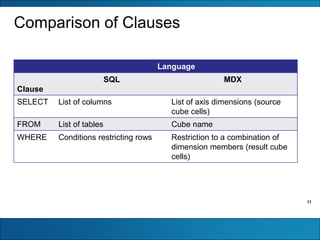

The document discusses multidimensional data representation and manipulation, focusing on data cube concepts relevant to business analysts, particularly in analyzing employee turnover and compensation factors. It covers data cube structure, dimensions, measures, and operational properties, including the use of Microsoft Multidimensional Expressions (MDX) for querying. Additionally, it contrasts SQL and MDX in terms of their querying capabilities and illustrates examples using a data cube model.


![[DSC Europe 25] Raul Cruz Bonilla - Harnessing GEN AI in Fashion, Luxury and ...](https://cdn.slidesharecdn.com/ss_thumbnails/me7nvup5thwqzwzblbvw-raul-cruz-harnessing-ai-en-luxury-260123083019-32ac5a43-thumbnail.jpg?width=640&height=640&fit=bounds)


![[DSC Europe 25] Milos Belcevic - Product Professional's Journey to Full-Stack...](https://cdn.slidesharecdn.com/ss_thumbnails/1zovd6fgsycdg4wvgvls-milos-belcevic-product-professionals-journey-to-full-stack-product-developer-260123083019-d993120d-thumbnail.jpg?width=640&height=640&fit=bounds)


