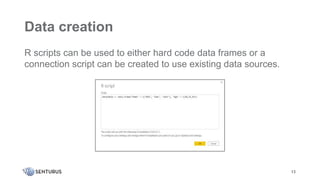
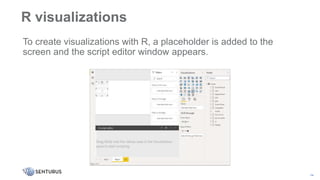
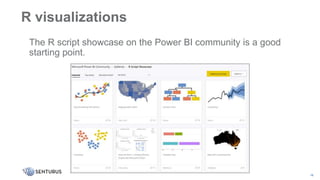
SlideShare a Scribd company logo
1
2
Hundreds of resources
Visit our Knowledge
Center to download this
presentation and
explore other assets:
senturus.com/resources
2
Patrick Powers
3
•Data Scientist, Consultant and Trainer
Senturus, Inc.
Michael Weinhauer
Director
Senturus, Inc.
Introductions
4
Agenda
• Introductions​
• Discussion of R and Power BI
• Demos
• Senturus overview​
• Additional resources​
• Q&A
4
• R basics
• Configuring Power BI
Desktop
• Using R for data
• R visualizations
• Transforming data
Topics
Enjoy the full webinar presentation
This slide deck is from the webinar Extending Power BI
Functionality with R.
To view the FREE video recording and download this deck,
go to https://senturus.com/resources/using-r-with-power-bi/
5
What is R?
6
R is a free, open-
source statistical
language
R allows you to
perform
sophisticated
statistical
analysis and
predictive
analytics
This includes:
• linear and
nonlinear
modeling
• statistical tests
• time-series
analysis
• classification
What is R?
7
R uses a
command line
interface primarily
However, many
GUI based
applications are
available for
download
With R, users can
create variables,
formulas, functions
and graphs to
visualize their
analysis and
predictions
• Before attempting Power BI integration, it is helpful to have a
working proficiency with R
• Terms such as data frame, working with the command line and
understanding the R environment are key success factors
• A good starting point is the R Project at www.r-project.org
• Additional resources available at the end of this presentation
Basic knowledge of R
8
• The R data frame function, data.frame, is the foundation for
storing data within R
• Similar to pandas in Python
• Stores Power BI data in a schema for access
Basic knowledge of R
9
• R provides a powerful way to do statistical analysis on large sets
of data
• Because it is also free, this is a compelling factor to its growth
• As an open-source product, new functions and packages are
created all the time
• If you can’t find a capability initially, you can search for a package
that can do it or even create a package of your own
Benefits of using R
10
• Using R in conjunction with Power BI can help with creating
visualizations, cleansing data and get around limitations in
Power BI
• A big advantage of using R is to connect to data sources not
directly supported in Power BI currently
• With R packages, analytics not directly built into Power BI can
be leveraged as well
Why R with Power BI?
11
• Installations available for Windows, Linux and Mac
• Many Linux distributions already include R in their package
management tools
• At a minimum, the command line interface is needed
• Additional 3rd party tools are available to add a graphical front
end to R
• Main download site: http://cran.r-project.org
Installing R
12
Data creation
R scripts can be used to either hard code data frames or a
connection script can be created to use existing data sources.
13
To create visualizations with R, a placeholder is added to the
screen and the script editor window appears.
R visualizations
14
As you select fields, Power BI automatically adds them to header
code which must be included in all scripts.
R visualizations
15
The R script showcase on the Power BI community is a good
starting point.
R visualizations
16
Data manipulation
• Scripts can be used in Power Query Editor
• Data can be shaped in multiple ways:
• completion of missing data
• pivoting data
• column and row removal
• predictions
• clustering
17
See the Power BI demos
https://senturus.com/resources/using-r-with-power-bi/
18
Creating an enterprise workbook
Configuring Power BI and libraries
Creating data
Building a visualization
Transforming data
Power BI & R summary
Using R in Power BI allows for:
• New and exciting visualizations
• Access to more data sources and complex data connections
• Cleansing and manipulation of data
• Re-use of existing code and leveraging in place technology
19
R versus Python
Which should you choose??
• A matter of which language is already in use in your organization
• R provides more statistical packages as a standard
• Python tends to have a lower entry learning curve
• Both have excellent communities with tons of examples
20
• The R Project for Statistical Computing
https://www.r-project.org
• R Tutorial: An R Introduction to Statistics
http://www.r-tutor.com
• R Tutorial W3 Schools
http://w3schools.com/r/
• R Documentation
http://rdocumentation.org
R resources
21
Additional resources
22
Insider viewpoints
Technical tips
Unbiased product reviews
Product demos Upcoming events
More on this subject
Your path to modern BI
Accelerating self-service analytics
for the enterprise
23
Decisions and actions
Business needs
Bridging the gap
24
Analysis-ready data
Full spectrum of BI services
• Data preparation and modern data warehousing
• Dashboards, reporting and visualizations in Power BI, Cognos
and Tableau
• Hybrid BI environments (migrations, security, etc.)
• Software to accelerate bimodal BI and migrations
• BI services and support retainer (expertise on demand)
• Training and mentoring
25
26
Instructor-led online courses Self-paced learning
Mentoring
Tailored group sessions
Complete BI training
A long, strong history of success
•20+ years
•1350+ clients
•3000+ projects
27
28
Join the
Senturus team
Send your resume to: jobs@senturus.com
We’re hiring talented and experienced professionals
• Senior Azure Architect
• Modern Analytics Solution Architect
• Senior Microsoft BI Architect
• ETL Developer
• And more
See job descriptions: https://senturus.com/company/business-analytics-careers/
© 2020 by Senturus, Inc. This presentation may not be reused or distributed without the written consent of Senturus, Inc.
www.senturus.com 888 601 6010 info@senturus.com
Thank You

More Related Content

Similar to Extending Power BI Functionality with R

Microsoft power bi vs tibco spotfire
Microsoft power bi vs tibco spotfireMicrosoft power bi vs tibco spotfire
Microsoft power bi vs tibco spotfire
Anirudh Kanneganti
 
Time to Fly - Why Predictive Analytics is Going Mainstream
Time to Fly - Why Predictive Analytics is Going MainstreamTime to Fly - Why Predictive Analytics is Going Mainstream
Time to Fly - Why Predictive Analytics is Going Mainstream
Inside Analysis
 
Are You Ready for Big Data Big Analytics?
Are You Ready for Big Data Big Analytics? Are You Ready for Big Data Big Analytics?
Are You Ready for Big Data Big Analytics?
Revolution Analytics
 
Business Analytics with R
Business Analytics with RBusiness Analytics with R
Business Analytics with REdureka!
 
Power BI reports and dashboards for Microsoft Project Server
Power BI reports and  dashboards for Microsoft Project ServerPower BI reports and  dashboards for Microsoft Project Server
Power BI reports and dashboards for Microsoft Project Server
Advaiya Solutions, Inc.
 
Sap business objects r4 course content
Sap business objects r4 course contentSap business objects r4 course content
Sap business objects r4 course content
saddagiri
 
Revolution Analytics Podcast
Revolution Analytics PodcastRevolution Analytics Podcast
Revolution Analytics Podcast
inside-BigData.com
 
Big Data in Action – Real-World Solution Showcase
 Big Data in Action – Real-World Solution Showcase Big Data in Action – Real-World Solution Showcase
Big Data in Action – Real-World Solution Showcase
Inside Analysis
 
The History and Use of R
The History and Use of RThe History and Use of R
The History and Use of R
AnalyticsWeek
 
Business Intelligence and Big Data Analytics with Pentaho
Business Intelligence and Big Data Analytics with Pentaho Business Intelligence and Big Data Analytics with Pentaho
Business Intelligence and Big Data Analytics with Pentaho
Uday Kothari
 
Power bi proof of concept
Power bi proof of conceptPower bi proof of concept
Power bi proof of concept
harrow812arhed
 
Using R in power BI
Using R in power BIUsing R in power BI
Using R in power BI
Guruprasad Vijayarao
 
Making the Most of Power BI with SQL Server 2014 and Azure
Making the Most of Power BI with SQL Server 2014 and AzureMaking the Most of Power BI with SQL Server 2014 and Azure
Making the Most of Power BI with SQL Server 2014 and Azure
Perficient, Inc.
 
Microsoft Data Platform Airlift 2017 Rui Quintino Machine Learning with SQL S...
Microsoft Data Platform Airlift 2017 Rui Quintino Machine Learning with SQL S...Microsoft Data Platform Airlift 2017 Rui Quintino Machine Learning with SQL S...
Microsoft Data Platform Airlift 2017 Rui Quintino Machine Learning with SQL S...
Rui Quintino
 
Choctaw Nation - Power bi dashboard, report server report in Day
Choctaw Nation - Power bi dashboard, report server report in DayChoctaw Nation - Power bi dashboard, report server report in Day
Choctaw Nation - Power bi dashboard, report server report in Day
Vishal Pawar
 
5 Data Integration Options for Microsoft Power BI
5 Data Integration Options for Microsoft Power BI5 Data Integration Options for Microsoft Power BI
5 Data Integration Options for Microsoft Power BI
Senturus
 
Big Data & SQL: The On-Ramp to Hadoop
Big Data & SQL: The On-Ramp to Hadoop Big Data & SQL: The On-Ramp to Hadoop
Big Data & SQL: The On-Ramp to Hadoop
Inside Analysis
 
Big Data Analytics with R
Big Data Analytics with RBig Data Analytics with R
Big Data Analytics with R
Great Wide Open
 
Office 365 Power Tools: What to use When? Forms, Flows, PowerApps, PowerBI
Office 365 Power Tools: What to use When? Forms, Flows, PowerApps, PowerBIOffice 365 Power Tools: What to use When? Forms, Flows, PowerApps, PowerBI
Office 365 Power Tools: What to use When? Forms, Flows, PowerApps, PowerBI
Joel Oleson
 
How to get started with R programming
How to get started with R programmingHow to get started with R programming
How to get started with R programming
Ramon Salazar
 

Similar to Extending Power BI Functionality with R (20)

Microsoft power bi vs tibco spotfire
Microsoft power bi vs tibco spotfireMicrosoft power bi vs tibco spotfire
Microsoft power bi vs tibco spotfire
 
Time to Fly - Why Predictive Analytics is Going Mainstream
Time to Fly - Why Predictive Analytics is Going MainstreamTime to Fly - Why Predictive Analytics is Going Mainstream
Time to Fly - Why Predictive Analytics is Going Mainstream
 
Are You Ready for Big Data Big Analytics?
Are You Ready for Big Data Big Analytics? Are You Ready for Big Data Big Analytics?
Are You Ready for Big Data Big Analytics?
 
Business Analytics with R
Business Analytics with RBusiness Analytics with R
Business Analytics with R
 
Power BI reports and dashboards for Microsoft Project Server
Power BI reports and  dashboards for Microsoft Project ServerPower BI reports and  dashboards for Microsoft Project Server
Power BI reports and dashboards for Microsoft Project Server
 
Sap business objects r4 course content
Sap business objects r4 course contentSap business objects r4 course content
Sap business objects r4 course content
 
Revolution Analytics Podcast
Revolution Analytics PodcastRevolution Analytics Podcast
Revolution Analytics Podcast
 
Big Data in Action – Real-World Solution Showcase
 Big Data in Action – Real-World Solution Showcase Big Data in Action – Real-World Solution Showcase
Big Data in Action – Real-World Solution Showcase
 
The History and Use of R
The History and Use of RThe History and Use of R
The History and Use of R
 
Business Intelligence and Big Data Analytics with Pentaho
Business Intelligence and Big Data Analytics with Pentaho Business Intelligence and Big Data Analytics with Pentaho
Business Intelligence and Big Data Analytics with Pentaho
 
Power bi proof of concept
Power bi proof of conceptPower bi proof of concept
Power bi proof of concept
 
Using R in power BI
Using R in power BIUsing R in power BI
Using R in power BI
 
Making the Most of Power BI with SQL Server 2014 and Azure
Making the Most of Power BI with SQL Server 2014 and AzureMaking the Most of Power BI with SQL Server 2014 and Azure
Making the Most of Power BI with SQL Server 2014 and Azure
 
Microsoft Data Platform Airlift 2017 Rui Quintino Machine Learning with SQL S...
Microsoft Data Platform Airlift 2017 Rui Quintino Machine Learning with SQL S...Microsoft Data Platform Airlift 2017 Rui Quintino Machine Learning with SQL S...
Microsoft Data Platform Airlift 2017 Rui Quintino Machine Learning with SQL S...
 
Choctaw Nation - Power bi dashboard, report server report in Day
Choctaw Nation - Power bi dashboard, report server report in DayChoctaw Nation - Power bi dashboard, report server report in Day
Choctaw Nation - Power bi dashboard, report server report in Day
 
5 Data Integration Options for Microsoft Power BI
5 Data Integration Options for Microsoft Power BI5 Data Integration Options for Microsoft Power BI
5 Data Integration Options for Microsoft Power BI
 
Big Data & SQL: The On-Ramp to Hadoop
Big Data & SQL: The On-Ramp to Hadoop Big Data & SQL: The On-Ramp to Hadoop
Big Data & SQL: The On-Ramp to Hadoop
 
Big Data Analytics with R
Big Data Analytics with RBig Data Analytics with R
Big Data Analytics with R
 
Office 365 Power Tools: What to use When? Forms, Flows, PowerApps, PowerBI
Office 365 Power Tools: What to use When? Forms, Flows, PowerApps, PowerBIOffice 365 Power Tools: What to use When? Forms, Flows, PowerApps, PowerBI
Office 365 Power Tools: What to use When? Forms, Flows, PowerApps, PowerBI
 
How to get started with R programming
How to get started with R programmingHow to get started with R programming
How to get started with R programming
 

More from Senturus

Power BI Gateway: Understanding, Installing, Configuring
Power BI Gateway: Understanding, Installing, ConfiguringPower BI Gateway: Understanding, Installing, Configuring
Power BI Gateway: Understanding, Installing, Configuring
Senturus
 
Cognos Performance Tuning Tips & Tricks
Cognos Performance Tuning Tips & TricksCognos Performance Tuning Tips & Tricks
Cognos Performance Tuning Tips & Tricks
Senturus
 
Power Automate for Power BI: Getting Started
Power Automate for Power BI: Getting StartedPower Automate for Power BI: Getting Started
Power Automate for Power BI: Getting Started
Senturus
 
Collaborative BI: 3 Ways to Use Cognos with Power BI & Tableau
Collaborative BI:  3 Ways to Use Cognos with Power BI & TableauCollaborative BI:  3 Ways to Use Cognos with Power BI & Tableau
Collaborative BI: 3 Ways to Use Cognos with Power BI & Tableau
Senturus
 
Tips for Installing Cognos Analytics 11.2.1x
Tips for Installing Cognos Analytics 11.2.1xTips for Installing Cognos Analytics 11.2.1x
Tips for Installing Cognos Analytics 11.2.1x
Senturus
 
How to Prepare for a BI Migration
How to Prepare for a BI MigrationHow to Prepare for a BI Migration
How to Prepare for a BI Migration
Senturus
 
4 Common Analytics Reporting Errors to Avoid
4 Common Analytics Reporting Errors to Avoid4 Common Analytics Reporting Errors to Avoid
4 Common Analytics Reporting Errors to Avoid
Senturus
 
Take Control of Your Cloud
Take Control of Your CloudTake Control of Your Cloud
Take Control of Your Cloud
Senturus
 
User-Friendly Power BI Report Nav
User-Friendly Power BI Report NavUser-Friendly Power BI Report Nav
User-Friendly Power BI Report Nav
Senturus
 
Streamline Cognos Migrations & Consolidations
Streamline Cognos Migrations & ConsolidationsStreamline Cognos Migrations & Consolidations
Streamline Cognos Migrations & Consolidations
Senturus
 
What’s New in Cognos 11.2.1
What’s New in Cognos 11.2.1What’s New in Cognos 11.2.1
What’s New in Cognos 11.2.1
Senturus
 
Planning for a Power BI Enterprise Deployment
Planning for a Power BI Enterprise DeploymentPlanning for a Power BI Enterprise Deployment
Planning for a Power BI Enterprise Deployment
Senturus
 
Tableau: 6 Ways to Publish & Share Dashboards
Tableau: 6 Ways to Publish & Share DashboardsTableau: 6 Ways to Publish & Share Dashboards
Tableau: 6 Ways to Publish & Share Dashboards
Senturus
 
Cognos Analytics 11.2 New Features
Cognos Analytics 11.2 New FeaturesCognos Analytics 11.2 New Features
Cognos Analytics 11.2 New Features
Senturus
 
Azure Synapse vs. Snowflake: The Data Warehouse Dating Game
Azure Synapse vs. Snowflake: The Data Warehouse Dating GameAzure Synapse vs. Snowflake: The Data Warehouse Dating Game
Azure Synapse vs. Snowflake: The Data Warehouse Dating Game
Senturus
 
Secrets of High Performing Report Development Teams
Secrets of High Performing Report Development TeamsSecrets of High Performing Report Development Teams
Secrets of High Performing Report Development Teams
Senturus
 
Power BI: Data Cleansing & Power Query Editor
Power BI: Data Cleansing & Power Query EditorPower BI: Data Cleansing & Power Query Editor
Power BI: Data Cleansing & Power Query Editor
Senturus
 
Cognos Data Module Architectures & Use Cases
Cognos Data Module Architectures & Use CasesCognos Data Module Architectures & Use Cases
Cognos Data Module Architectures & Use Cases
Senturus
 
Getting Started with (Just Enough) Data Governance
Getting Started with (Just Enough) Data GovernanceGetting Started with (Just Enough) Data Governance
Getting Started with (Just Enough) Data Governance
Senturus
 
Using Cognos Analytics Explorations
Using Cognos Analytics ExplorationsUsing Cognos Analytics Explorations
Using Cognos Analytics Explorations
Senturus
 

More from Senturus (20)

Power BI Gateway: Understanding, Installing, Configuring
Power BI Gateway: Understanding, Installing, ConfiguringPower BI Gateway: Understanding, Installing, Configuring
Power BI Gateway: Understanding, Installing, Configuring
 
Cognos Performance Tuning Tips & Tricks
Cognos Performance Tuning Tips & TricksCognos Performance Tuning Tips & Tricks
Cognos Performance Tuning Tips & Tricks
 
Power Automate for Power BI: Getting Started
Power Automate for Power BI: Getting StartedPower Automate for Power BI: Getting Started
Power Automate for Power BI: Getting Started
 
Collaborative BI: 3 Ways to Use Cognos with Power BI & Tableau
Collaborative BI:  3 Ways to Use Cognos with Power BI & TableauCollaborative BI:  3 Ways to Use Cognos with Power BI & Tableau
Collaborative BI: 3 Ways to Use Cognos with Power BI & Tableau
 
Tips for Installing Cognos Analytics 11.2.1x
Tips for Installing Cognos Analytics 11.2.1xTips for Installing Cognos Analytics 11.2.1x
Tips for Installing Cognos Analytics 11.2.1x
 
How to Prepare for a BI Migration
How to Prepare for a BI MigrationHow to Prepare for a BI Migration
How to Prepare for a BI Migration
 
4 Common Analytics Reporting Errors to Avoid
4 Common Analytics Reporting Errors to Avoid4 Common Analytics Reporting Errors to Avoid
4 Common Analytics Reporting Errors to Avoid
 
Take Control of Your Cloud
Take Control of Your CloudTake Control of Your Cloud
Take Control of Your Cloud
 
User-Friendly Power BI Report Nav
User-Friendly Power BI Report NavUser-Friendly Power BI Report Nav
User-Friendly Power BI Report Nav
 
Streamline Cognos Migrations & Consolidations
Streamline Cognos Migrations & ConsolidationsStreamline Cognos Migrations & Consolidations
Streamline Cognos Migrations & Consolidations
 
What’s New in Cognos 11.2.1
What’s New in Cognos 11.2.1What’s New in Cognos 11.2.1
What’s New in Cognos 11.2.1
 
Planning for a Power BI Enterprise Deployment
Planning for a Power BI Enterprise DeploymentPlanning for a Power BI Enterprise Deployment
Planning for a Power BI Enterprise Deployment
 
Tableau: 6 Ways to Publish & Share Dashboards
Tableau: 6 Ways to Publish & Share DashboardsTableau: 6 Ways to Publish & Share Dashboards
Tableau: 6 Ways to Publish & Share Dashboards
 
Cognos Analytics 11.2 New Features
Cognos Analytics 11.2 New FeaturesCognos Analytics 11.2 New Features
Cognos Analytics 11.2 New Features
 
Azure Synapse vs. Snowflake: The Data Warehouse Dating Game
Azure Synapse vs. Snowflake: The Data Warehouse Dating GameAzure Synapse vs. Snowflake: The Data Warehouse Dating Game
Azure Synapse vs. Snowflake: The Data Warehouse Dating Game
 
Secrets of High Performing Report Development Teams
Secrets of High Performing Report Development TeamsSecrets of High Performing Report Development Teams
Secrets of High Performing Report Development Teams
 
Power BI: Data Cleansing & Power Query Editor
Power BI: Data Cleansing & Power Query EditorPower BI: Data Cleansing & Power Query Editor
Power BI: Data Cleansing & Power Query Editor
 
Cognos Data Module Architectures & Use Cases
Cognos Data Module Architectures & Use CasesCognos Data Module Architectures & Use Cases
Cognos Data Module Architectures & Use Cases
 
Getting Started with (Just Enough) Data Governance
Getting Started with (Just Enough) Data GovernanceGetting Started with (Just Enough) Data Governance
Getting Started with (Just Enough) Data Governance
 
Using Cognos Analytics Explorations
Using Cognos Analytics ExplorationsUsing Cognos Analytics Explorations
Using Cognos Analytics Explorations
 

Recently uploaded

Algorithmic optimizations for Dynamic Levelwise PageRank (from STICD) : SHORT...
Algorithmic optimizations for Dynamic Levelwise PageRank (from STICD) : SHORT...Algorithmic optimizations for Dynamic Levelwise PageRank (from STICD) : SHORT...
Algorithmic optimizations for Dynamic Levelwise PageRank (from STICD) : SHORT...
Subhajit Sahu
 
一比一原版(ArtEZ毕业证)ArtEZ艺术学院毕业证成绩单
一比一原版(ArtEZ毕业证)ArtEZ艺术学院毕业证成绩单一比一原版(ArtEZ毕业证)ArtEZ艺术学院毕业证成绩单
一比一原版(ArtEZ毕业证)ArtEZ艺术学院毕业证成绩单
vcaxypu
 
Empowering Data Analytics Ecosystem.pptx
Empowering Data Analytics Ecosystem.pptxEmpowering Data Analytics Ecosystem.pptx
Empowering Data Analytics Ecosystem.pptx
benishzehra469
 
一比一原版(IIT毕业证)伊利诺伊理工大学毕业证成绩单
一比一原版(IIT毕业证)伊利诺伊理工大学毕业证成绩单一比一原版(IIT毕业证)伊利诺伊理工大学毕业证成绩单
一比一原版(IIT毕业证)伊利诺伊理工大学毕业证成绩单
ewymefz
 
FP Growth Algorithm and its Applications
FP Growth Algorithm and its ApplicationsFP Growth Algorithm and its Applications
FP Growth Algorithm and its Applications
MaleehaSheikh2
 
Malana- Gimlet Market Analysis (Portfolio 2)
Malana- Gimlet Market Analysis (Portfolio 2)Malana- Gimlet Market Analysis (Portfolio 2)
Malana- Gimlet Market Analysis (Portfolio 2)
TravisMalana
 
Levelwise PageRank with Loop-Based Dead End Handling Strategy : SHORT REPORT ...
Levelwise PageRank with Loop-Based Dead End Handling Strategy : SHORT REPORT ...Levelwise PageRank with Loop-Based Dead End Handling Strategy : SHORT REPORT ...
Levelwise PageRank with Loop-Based Dead End Handling Strategy : SHORT REPORT ...
Subhajit Sahu
 
Tabula.io Cheatsheet: automate your data workflows
Tabula.io Cheatsheet: automate your data workflowsTabula.io Cheatsheet: automate your data workflows
Tabula.io Cheatsheet: automate your data workflows
alex933524
 
做(mqu毕业证书)麦考瑞大学毕业证硕士文凭证书学费发票原版一模一样
做(mqu毕业证书)麦考瑞大学毕业证硕士文凭证书学费发票原版一模一样做(mqu毕业证书)麦考瑞大学毕业证硕士文凭证书学费发票原版一模一样
做(mqu毕业证书)麦考瑞大学毕业证硕士文凭证书学费发票原版一模一样
axoqas
 
Ch03-Managing the Object-Oriented Information Systems Project a.pdf
Ch03-Managing the Object-Oriented Information Systems Project a.pdfCh03-Managing the Object-Oriented Information Systems Project a.pdf
Ch03-Managing the Object-Oriented Information Systems Project a.pdf
haila53
 
一比一原版(BU毕业证)波士顿大学毕业证成绩单
一比一原版(BU毕业证)波士顿大学毕业证成绩单一比一原版(BU毕业证)波士顿大学毕业证成绩单
一比一原版(BU毕业证)波士顿大学毕业证成绩单
ewymefz
 
一比一原版(CU毕业证)卡尔顿大学毕业证成绩单
一比一原版(CU毕业证)卡尔顿大学毕业证成绩单一比一原版(CU毕业证)卡尔顿大学毕业证成绩单
一比一原版(CU毕业证)卡尔顿大学毕业证成绩单
yhkoc
 
Investigate & Recover / StarCompliance.io / Crypto_Crimes
Investigate & Recover / StarCompliance.io / Crypto_CrimesInvestigate & Recover / StarCompliance.io / Crypto_Crimes
Investigate & Recover / StarCompliance.io / Crypto_Crimes
StarCompliance.io
 
一比一原版(UofM毕业证)明尼苏达大学毕业证成绩单
一比一原版(UofM毕业证)明尼苏达大学毕业证成绩单一比一原版(UofM毕业证)明尼苏达大学毕业证成绩单
一比一原版(UofM毕业证)明尼苏达大学毕业证成绩单
ewymefz
 
Opendatabay - Open Data Marketplace.pptx
Opendatabay - Open Data Marketplace.pptxOpendatabay - Open Data Marketplace.pptx
Opendatabay - Open Data Marketplace.pptx
Opendatabay
 
Criminal IP - Threat Hunting Webinar.pdf
Criminal IP - Threat Hunting Webinar.pdfCriminal IP - Threat Hunting Webinar.pdf
Criminal IP - Threat Hunting Webinar.pdf
Criminal IP
 
一比一原版(QU毕业证)皇后大学毕业证成绩单
一比一原版(QU毕业证)皇后大学毕业证成绩单一比一原版(QU毕业证)皇后大学毕业证成绩单
一比一原版(QU毕业证)皇后大学毕业证成绩单
enxupq
 
The affect of service quality and online reviews on customer loyalty in the E...
The affect of service quality and online reviews on customer loyalty in the E...The affect of service quality and online reviews on customer loyalty in the E...
The affect of service quality and online reviews on customer loyalty in the E...
jerlynmaetalle
 
Predicting Product Ad Campaign Performance: A Data Analysis Project Presentation
Predicting Product Ad Campaign Performance: A Data Analysis Project PresentationPredicting Product Ad Campaign Performance: A Data Analysis Project Presentation
Predicting Product Ad Campaign Performance: A Data Analysis Project Presentation
Boston Institute of Analytics
 
tapal brand analysis PPT slide for comptetive data
tapal brand analysis PPT slide for comptetive datatapal brand analysis PPT slide for comptetive data
tapal brand analysis PPT slide for comptetive data
theahmadsaood
 

Recently uploaded (20)

Algorithmic optimizations for Dynamic Levelwise PageRank (from STICD) : SHORT...
Algorithmic optimizations for Dynamic Levelwise PageRank (from STICD) : SHORT...Algorithmic optimizations for Dynamic Levelwise PageRank (from STICD) : SHORT...
Algorithmic optimizations for Dynamic Levelwise PageRank (from STICD) : SHORT...
 
一比一原版(ArtEZ毕业证)ArtEZ艺术学院毕业证成绩单
一比一原版(ArtEZ毕业证)ArtEZ艺术学院毕业证成绩单一比一原版(ArtEZ毕业证)ArtEZ艺术学院毕业证成绩单
一比一原版(ArtEZ毕业证)ArtEZ艺术学院毕业证成绩单
 
Empowering Data Analytics Ecosystem.pptx
Empowering Data Analytics Ecosystem.pptxEmpowering Data Analytics Ecosystem.pptx
Empowering Data Analytics Ecosystem.pptx
 
一比一原版(IIT毕业证)伊利诺伊理工大学毕业证成绩单
一比一原版(IIT毕业证)伊利诺伊理工大学毕业证成绩单一比一原版(IIT毕业证)伊利诺伊理工大学毕业证成绩单
一比一原版(IIT毕业证)伊利诺伊理工大学毕业证成绩单
 
FP Growth Algorithm and its Applications
FP Growth Algorithm and its ApplicationsFP Growth Algorithm and its Applications
FP Growth Algorithm and its Applications
 
Malana- Gimlet Market Analysis (Portfolio 2)
Malana- Gimlet Market Analysis (Portfolio 2)Malana- Gimlet Market Analysis (Portfolio 2)
Malana- Gimlet Market Analysis (Portfolio 2)
 
Levelwise PageRank with Loop-Based Dead End Handling Strategy : SHORT REPORT ...
Levelwise PageRank with Loop-Based Dead End Handling Strategy : SHORT REPORT ...Levelwise PageRank with Loop-Based Dead End Handling Strategy : SHORT REPORT ...
Levelwise PageRank with Loop-Based Dead End Handling Strategy : SHORT REPORT ...
 
Tabula.io Cheatsheet: automate your data workflows
Tabula.io Cheatsheet: automate your data workflowsTabula.io Cheatsheet: automate your data workflows
Tabula.io Cheatsheet: automate your data workflows
 
做(mqu毕业证书)麦考瑞大学毕业证硕士文凭证书学费发票原版一模一样
做(mqu毕业证书)麦考瑞大学毕业证硕士文凭证书学费发票原版一模一样做(mqu毕业证书)麦考瑞大学毕业证硕士文凭证书学费发票原版一模一样
做(mqu毕业证书)麦考瑞大学毕业证硕士文凭证书学费发票原版一模一样
 
Ch03-Managing the Object-Oriented Information Systems Project a.pdf
Ch03-Managing the Object-Oriented Information Systems Project a.pdfCh03-Managing the Object-Oriented Information Systems Project a.pdf
Ch03-Managing the Object-Oriented Information Systems Project a.pdf
 
一比一原版(BU毕业证)波士顿大学毕业证成绩单
一比一原版(BU毕业证)波士顿大学毕业证成绩单一比一原版(BU毕业证)波士顿大学毕业证成绩单
一比一原版(BU毕业证)波士顿大学毕业证成绩单
 
一比一原版(CU毕业证)卡尔顿大学毕业证成绩单
一比一原版(CU毕业证)卡尔顿大学毕业证成绩单一比一原版(CU毕业证)卡尔顿大学毕业证成绩单
一比一原版(CU毕业证)卡尔顿大学毕业证成绩单
 
Investigate & Recover / StarCompliance.io / Crypto_Crimes
Investigate & Recover / StarCompliance.io / Crypto_CrimesInvestigate & Recover / StarCompliance.io / Crypto_Crimes
Investigate & Recover / StarCompliance.io / Crypto_Crimes
 
一比一原版(UofM毕业证)明尼苏达大学毕业证成绩单
一比一原版(UofM毕业证)明尼苏达大学毕业证成绩单一比一原版(UofM毕业证)明尼苏达大学毕业证成绩单
一比一原版(UofM毕业证)明尼苏达大学毕业证成绩单
 
Opendatabay - Open Data Marketplace.pptx
Opendatabay - Open Data Marketplace.pptxOpendatabay - Open Data Marketplace.pptx
Opendatabay - Open Data Marketplace.pptx
 
Criminal IP - Threat Hunting Webinar.pdf
Criminal IP - Threat Hunting Webinar.pdfCriminal IP - Threat Hunting Webinar.pdf
Criminal IP - Threat Hunting Webinar.pdf
 
一比一原版(QU毕业证)皇后大学毕业证成绩单
一比一原版(QU毕业证)皇后大学毕业证成绩单一比一原版(QU毕业证)皇后大学毕业证成绩单
一比一原版(QU毕业证)皇后大学毕业证成绩单
 
The affect of service quality and online reviews on customer loyalty in the E...
The affect of service quality and online reviews on customer loyalty in the E...The affect of service quality and online reviews on customer loyalty in the E...
The affect of service quality and online reviews on customer loyalty in the E...
 
Predicting Product Ad Campaign Performance: A Data Analysis Project Presentation
Predicting Product Ad Campaign Performance: A Data Analysis Project PresentationPredicting Product Ad Campaign Performance: A Data Analysis Project Presentation
Predicting Product Ad Campaign Performance: A Data Analysis Project Presentation
 
tapal brand analysis PPT slide for comptetive data
tapal brand analysis PPT slide for comptetive datatapal brand analysis PPT slide for comptetive data
tapal brand analysis PPT slide for comptetive data
 

Extending Power BI Functionality with R

  • 1. 1
  • 2. 2 Hundreds of resources Visit our Knowledge Center to download this presentation and explore other assets: senturus.com/resources 2
  • 3. Patrick Powers 3 •Data Scientist, Consultant and Trainer Senturus, Inc. Michael Weinhauer Director Senturus, Inc. Introductions
  • 4. 4 Agenda • Introductions​ • Discussion of R and Power BI • Demos • Senturus overview​ • Additional resources​ • Q&A 4 • R basics • Configuring Power BI Desktop • Using R for data • R visualizations • Transforming data Topics
  • 5. Enjoy the full webinar presentation This slide deck is from the webinar Extending Power BI Functionality with R. To view the FREE video recording and download this deck, go to https://senturus.com/resources/using-r-with-power-bi/ 5
  • 6. What is R? 6 R is a free, open- source statistical language R allows you to perform sophisticated statistical analysis and predictive analytics This includes: • linear and nonlinear modeling • statistical tests • time-series analysis • classification
  • 7. What is R? 7 R uses a command line interface primarily However, many GUI based applications are available for download With R, users can create variables, formulas, functions and graphs to visualize their analysis and predictions
  • 8. • Before attempting Power BI integration, it is helpful to have a working proficiency with R • Terms such as data frame, working with the command line and understanding the R environment are key success factors • A good starting point is the R Project at www.r-project.org • Additional resources available at the end of this presentation Basic knowledge of R 8
  • 9. • The R data frame function, data.frame, is the foundation for storing data within R • Similar to pandas in Python • Stores Power BI data in a schema for access Basic knowledge of R 9
  • 10. • R provides a powerful way to do statistical analysis on large sets of data • Because it is also free, this is a compelling factor to its growth • As an open-source product, new functions and packages are created all the time • If you can’t find a capability initially, you can search for a package that can do it or even create a package of your own Benefits of using R 10
  • 11. • Using R in conjunction with Power BI can help with creating visualizations, cleansing data and get around limitations in Power BI • A big advantage of using R is to connect to data sources not directly supported in Power BI currently • With R packages, analytics not directly built into Power BI can be leveraged as well Why R with Power BI? 11
  • 12. • Installations available for Windows, Linux and Mac • Many Linux distributions already include R in their package management tools • At a minimum, the command line interface is needed • Additional 3rd party tools are available to add a graphical front end to R • Main download site: http://cran.r-project.org Installing R 12
  • 13. Data creation R scripts can be used to either hard code data frames or a connection script can be created to use existing data sources. 13
  • 14. To create visualizations with R, a placeholder is added to the screen and the script editor window appears. R visualizations 14
  • 15. As you select fields, Power BI automatically adds them to header code which must be included in all scripts. R visualizations 15
  • 16. The R script showcase on the Power BI community is a good starting point. R visualizations 16
  • 17. Data manipulation • Scripts can be used in Power Query Editor • Data can be shaped in multiple ways: • completion of missing data • pivoting data • column and row removal • predictions • clustering 17
  • 18. See the Power BI demos https://senturus.com/resources/using-r-with-power-bi/ 18 Creating an enterprise workbook Configuring Power BI and libraries Creating data Building a visualization Transforming data
  • 19. Power BI & R summary Using R in Power BI allows for: • New and exciting visualizations • Access to more data sources and complex data connections • Cleansing and manipulation of data • Re-use of existing code and leveraging in place technology 19
  • 20. R versus Python Which should you choose?? • A matter of which language is already in use in your organization • R provides more statistical packages as a standard • Python tends to have a lower entry learning curve • Both have excellent communities with tons of examples 20
  • 21. • The R Project for Statistical Computing https://www.r-project.org • R Tutorial: An R Introduction to Statistics http://www.r-tutor.com • R Tutorial W3 Schools http://w3schools.com/r/ • R Documentation http://rdocumentation.org R resources 21
  • 22. Additional resources 22 Insider viewpoints Technical tips Unbiased product reviews Product demos Upcoming events More on this subject
  • 23. Your path to modern BI Accelerating self-service analytics for the enterprise 23
  • 24. Decisions and actions Business needs Bridging the gap 24 Analysis-ready data
  • 25. Full spectrum of BI services • Data preparation and modern data warehousing • Dashboards, reporting and visualizations in Power BI, Cognos and Tableau • Hybrid BI environments (migrations, security, etc.) • Software to accelerate bimodal BI and migrations • BI services and support retainer (expertise on demand) • Training and mentoring 25
  • 26. 26 Instructor-led online courses Self-paced learning Mentoring Tailored group sessions Complete BI training
  • 27. A long, strong history of success •20+ years •1350+ clients •3000+ projects 27
  • 28. 28 Join the Senturus team Send your resume to: jobs@senturus.com We’re hiring talented and experienced professionals • Senior Azure Architect • Modern Analytics Solution Architect • Senior Microsoft BI Architect • ETL Developer • And more See job descriptions: https://senturus.com/company/business-analytics-careers/
  • 29. © 2020 by Senturus, Inc. This presentation may not be reused or distributed without the written consent of Senturus, Inc. www.senturus.com 888 601 6010 info@senturus.com Thank You

Editor's Notes

  1. The first question we usually get is “Can I get a copy of the presentation?” Absolutely! It’s available on Senturus.com. Select the Resources tab and then Resources Library. Or you can click the link that was just posted in the GoToWebinar Control panel. Be sure to bookmark the resource library. It has tons of valuable content addressing a wide variety of business analytics topics.
  2. Joining us today is…..Patrick Powers Patrick has 20 years of experience in business intelligence and data analytics. He’s one of our trainers, delivering classes on Power BI, Tableau and Cognos. His certifications include multiple programming languages, including Java and C++, and database certification (MS SQL).
  3. In 2015, Microsoft Corporation acquired Revolution Analytics[105] and integrated the R programming language into SQL Server, Power BI, Azure SQL Managed Instance, Azure Cortana Intelligence, Microsoft ML Server and Visual Studio 2017.[106] Microsoft R Open (MRO) is a fully compatible R distribution with modifications for multi-threaded computations.[85][86] As of 30 June 2021, Microsoft started to phase out MRO in favor of the CRAN distribution. [87]
  4. Data is everywhere and you can create a quick Tableau Dashboard using just about anything. But the old garbage in garbage out principal often applies…. And end of the day the data behind your dashboards needs to be accurate, informational and up to date. ??? Good data is an absolute requirement to make accurate projections which in turn drives supply chains and helps people make informed decisions. Today we are really seeing how important good data is.
  5. Data is everywhere and you can create a quick Tableau Dashboard using just about anything. But the old garbage in garbage out principal often applies…. And end of the day the data behind your dashboards needs to be accurate, informational and up to date. ??? Good data is an absolute requirement to make accurate projections which in turn drives supply chains and helps people make informed decisions. Today we are really seeing how important good data is.
  6. Data is everywhere and you can create a quick Tableau Dashboard using just about anything. But the old garbage in garbage out principal often applies…. And end of the day the data behind your dashboards needs to be accurate, informational and up to date. ??? Good data is an absolute requirement to make accurate projections which in turn drives supply chains and helps people make informed decisions. Today we are really seeing how important good data is.
  7. Senturus provides 100s of free resources on our website. We have been committed to sharing our BI expertise for over a decade. Go to Senturus.com/resources You can also see recordings of Patrick’s two last webinars: Power BI Builder and Paginated Reports AND Power BI Data Cleansing and Power Query Editor.
  8. At Senturus we concentrate our expertise on business intelligence with a depth of knowledge across the entire BI stack.
  9. At Senturus, our clients know us for providing clarity from the chaos of complex business requirements, disparate data sources and constantly moving targets. We have made a name for ourselves because of our strength at bridging the gap between IT and business users. We deliver solutions that give you access to reliable, analysis-ready data across the organization so you can quickly and easily get answers at the point of impact: the Decisions you Make and Actions you Take.
  10. Our consultants are leading experts in the field of analytics, with years of pragmatic, real-world expertise and experience advancing the state-of-the-art. We’re so confident in our team and our methodology that we back our projects with a 100% money back guarantee that is unique in the industry.
  11. We provide training in the three top BI platforms. We are ideal for organizations running multiple platforms or those moving from one to another. We can provide training in many modes and can mix and match to suit your user community.
  12. We have been focused exclusively on Business Analytics for 20 years. (2001 start) We have worked across the spectrum from Fortune 500 to mid market, we have solved business problems across many industries and function areas including in the office of finance, sales and marketing, manufacturing, operations, HR and IT Our team is large enough to meet all your business analytics needs yet small enough to provide personal attention.