![Considerations [continued]
TT&U, Healthcare Services, Construction, Information Technology
and Manufacturing are private sector industry sectors projecting
workforce needs.
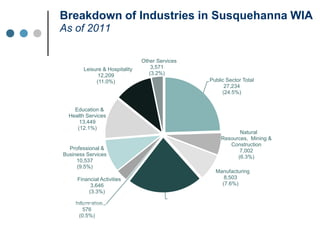
76% of Private Sector establishments in the region are micro-
businesses (1-9 employees) while large businesses (100+)
comprise 1.8 % of establishments
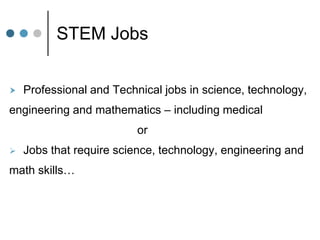
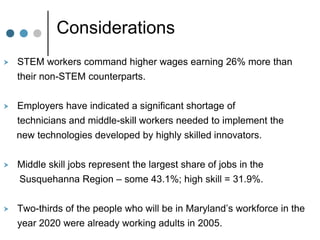
STEM-related jobs will require attention to segments of the
workforce that are often overlooked in STEM discussions:
incumbent workers who need skills upgrading, dislocated workers
and transitional workers who are trying to find new jobs in industries,
and individuals from groups traditionally underrepresented
in STEM fields.](https://image.slidesharecdn.com/ssstemdec2012wedits-130123093434-phpapp01/85/SWN-STEM-Presentation-Dec-2012-13-320.jpg)


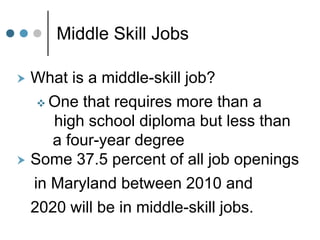
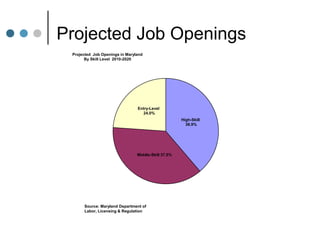
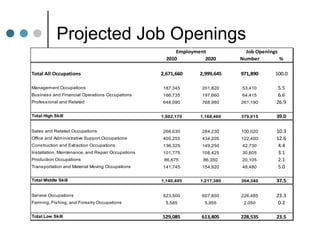
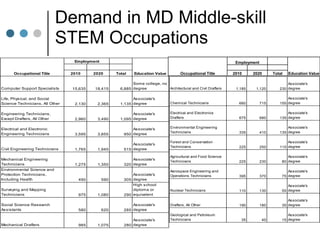
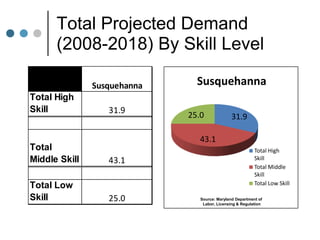
The document discusses a STEM summit and provides data on middle-skill jobs in Maryland and the Susquehanna region. Some key points: - 37.5% of all job openings in Maryland between 2010-2020 will be in middle-skill jobs that require more than high school but less than a 4-year degree. - The largest share of jobs in the Susquehanna region, 43.1%, are middle-skill jobs, while high-skill jobs make up 31.9% and low-skill 25%. - There is a significant shortage of middle-skill technicians needed to implement new technologies, and these STEM-related jobs require training incumbent, dislocated and underrepresented workers.


