Download free for 30 days
Sign in
Upload
Language (EN)
Support
Business
Mobile
Social Media
Marketing
Technology
Art & Photos
Career
Design
Education
Presentations & Public Speaking
Government & Nonprofit
Healthcare
Internet
Law
Leadership & Management
Automotive
Engineering
Software
Recruiting & HR
Retail
Sales
Services
Science
Small Business & Entrepreneurship
Food
Environment
Economy & Finance
Data & Analytics
Investor Relations
Sports
Spiritual
News & Politics
Travel
Self Improvement
Real Estate
Entertainment & Humor
Health & Medicine
Devices & Hardware
Lifestyle
Change Language
Language
English
Español
Português
Français
Deutsche
Cancel
Save
Submit search
EN
Uploaded by
เอกลักษณ์ รีแบรนด์
4,601 views
เครื่องมือกราฟแท่งเทียน
เครื่องมือกราฟแท่งเทียน
Education
◦
Read more
5
Save
Share
Embed
Embed presentation
Download
Downloaded 349 times
1
/ 30
2
/ 30
Most read
3
/ 30
Most read
4
/ 30
5
/ 30
6
/ 30
Most read
7
/ 30
8
/ 30
9
/ 30
10
/ 30
11
/ 30
12
/ 30
13
/ 30
14
/ 30
15
/ 30
16
/ 30
17
/ 30
18
/ 30
19
/ 30
20
/ 30
21
/ 30
22
/ 30
23
/ 30
24
/ 30
25
/ 30
26
/ 30
27
/ 30
28
/ 30
29
/ 30
30
/ 30
More Related Content
PPT
Chart patterns
by
ypendharkar
DOCX
Constitution of USA.docx
by
SajadHussain59
PPTX
Projektowanie części maszyn w systemie Solid Edge
by
gmsystem2001
PPTX
Intraday trading formulae, Strategies and rules
by
Bikramjit Singh
PPTX
A Look Back at 11 Stock Trading Setups
by
InvestingWithOptions
PDF
Section 2 - Chapter 13 Part II- Confirmation - Volume Indicator & Oscillator
by
Professional Training Academy
PPTX
Contract of indemnity
by
vidyavardhaka law college, mysuru
PPT
1.Basics Of Contract Act
by
Fostiima Business School
Chart patterns
by
ypendharkar
Constitution of USA.docx
by
SajadHussain59
Projektowanie części maszyn w systemie Solid Edge
by
gmsystem2001
Intraday trading formulae, Strategies and rules
by
Bikramjit Singh
A Look Back at 11 Stock Trading Setups
by
InvestingWithOptions
Section 2 - Chapter 13 Part II- Confirmation - Volume Indicator & Oscillator
by
Professional Training Academy
Contract of indemnity
by
vidyavardhaka law college, mysuru
1.Basics Of Contract Act
by
Fostiima Business School
What's hot
PDF
ทำไมเทรดโดยใช้ Indicator จึงไม่ประสบความสำเร็จ
by
Akarawat Thanachitnawarat
PPT
Frustration of Contracts and Force Majeure clauses
by
Eversheds Sutherland
PPT
Candlestick patterns
by
ypendharkar
PPT
Indian contract act 1872
by
shoma chatterjee
PPTX
Steroid induced osteoporosis
by
Yogasundaram Sasikumar
PPT
Fibonacci analysis
by
ypendharkar
PPT
Chapter 1 มองแนวโน้มให้ออกก่อน
by
Akarawat Thanachitnawarat
PPTX
Emergency provisions
by
raviranjannlc1
PPTX
Elliot waves
by
Sohil Jain
PPT
Chapter 4 วัฎจักรของกราฟ
by
Akarawat Thanachitnawarat
PDF
Regulatory Public Policies: The Possibility And Impossibility Of Rational Reg...
by
COSKUN CAN AKTAN
PPT
Diabetes
by
Raymond Arhin
PPTX
Derivatives
by
Roy Thomas
PDF
The aging liver
by
Tarek Sheta
ทำไมเทรดโดยใช้ Indicator จึงไม่ประสบความสำเร็จ
by
Akarawat Thanachitnawarat
Frustration of Contracts and Force Majeure clauses
by
Eversheds Sutherland
Candlestick patterns
by
ypendharkar
Indian contract act 1872
by
shoma chatterjee
Steroid induced osteoporosis
by
Yogasundaram Sasikumar
Fibonacci analysis
by
ypendharkar
Chapter 1 มองแนวโน้มให้ออกก่อน
by
Akarawat Thanachitnawarat
Emergency provisions
by
raviranjannlc1
Elliot waves
by
Sohil Jain
Chapter 4 วัฎจักรของกราฟ
by
Akarawat Thanachitnawarat
Regulatory Public Policies: The Possibility And Impossibility Of Rational Reg...
by
COSKUN CAN AKTAN
Diabetes
by
Raymond Arhin
Derivatives
by
Roy Thomas
The aging liver
by
Tarek Sheta
Viewers also liked
PDF
การวิเคราะห์ทางเทคนิค อ.นราธิป
by
Akarawat Thanachitnawarat
PPT
Chapter 2 รู้แนวรับแนวต้าน
by
Akarawat Thanachitnawarat
PPT
Chapter 3 ฝึกลากรูปแบบต่างๆ
by
Akarawat Thanachitnawarat
PPT
Chapter 7 trend line แค่ลากเป็นก็ทำกำไรได้แล้ว
by
Akarawat Thanachitnawarat
PPT
Chapter 5 เครื่องมือช่วยยืนยัน
by
Akarawat Thanachitnawarat
PDF
Ebook เทรด binary option
by
Narudol Pechsook
PDF
Set+technical+update+besic
by
Akarawat Thanachitnawarat
PDF
Parabolic Thai
by
Olymp Trade
PDF
สรุป Master the market
by
Akarawat Thanachitnawarat
PDF
Designing Teams for Emerging Challenges
by
Aaron Irizarry
PDF
What Makes Great Infographics
by
Slideshare
PDF
Masters of SlideShare
by
Kapost
PDF
STOP! VIEW THIS! 10-Step Checklist When Uploading to Slideshare
by
Empowered Presentations
PDF
10 Ways to Win at SlideShare SEO & Presentation Optimization
by
Oneupweb
PDF
How To Get More From SlideShare - Super-Simple Tips For Content Marketing
by
Content Marketing Institute
PDF
A Guide to SlideShare Analytics - Excerpts from Hubspot's Step by Step Guide ...
by
Slideshare
PDF
How to Become a Thought Leader in Your Niche
by
Leslie Samuel
PDF
How to Make Awesome SlideShares: Tips & Tricks
by
Slideshare
การวิเคราะห์ทางเทคนิค อ.นราธิป
by
Akarawat Thanachitnawarat
Chapter 2 รู้แนวรับแนวต้าน
by
Akarawat Thanachitnawarat
Chapter 3 ฝึกลากรูปแบบต่างๆ
by
Akarawat Thanachitnawarat
Chapter 7 trend line แค่ลากเป็นก็ทำกำไรได้แล้ว
by
Akarawat Thanachitnawarat
Chapter 5 เครื่องมือช่วยยืนยัน
by
Akarawat Thanachitnawarat
Ebook เทรด binary option
by
Narudol Pechsook
Set+technical+update+besic
by
Akarawat Thanachitnawarat
Parabolic Thai
by
Olymp Trade
สรุป Master the market
by
Akarawat Thanachitnawarat
Designing Teams for Emerging Challenges
by
Aaron Irizarry
What Makes Great Infographics
by
Slideshare
Masters of SlideShare
by
Kapost
STOP! VIEW THIS! 10-Step Checklist When Uploading to Slideshare
by
Empowered Presentations
10 Ways to Win at SlideShare SEO & Presentation Optimization
by
Oneupweb
How To Get More From SlideShare - Super-Simple Tips For Content Marketing
by
Content Marketing Institute
A Guide to SlideShare Analytics - Excerpts from Hubspot's Step by Step Guide ...
by
Slideshare
How to Become a Thought Leader in Your Niche
by
Leslie Samuel
How to Make Awesome SlideShares: Tips & Tricks
by
Slideshare
Similar to เครื่องมือกราฟแท่งเทียน
PDF
Technical part3
by
Bhundit Vongumpaiprasert
PPTX
พิชิตหุ้นด้วยการวิเคราะห์ปัจจัยพื้นฐาน และเทคนิค
by
Audy Kenaydep
PPTX
พิชิตหุ้นด้วย "ปัจจัยพื้นฐาน" และ "ปัจจัยทางเทคนิค"
by
Audyken Ssy
PPTX
Tradingview on demand for investment in all
by
Phichart Charoensuk
PPT
เรียนอ่านกราฟทางเทคนิคเบื้องต้น
by
Pk Daily Watch
PDF
Technical 20150228
by
Bhundit Vongumpaiprasert
PDF
Fibonacci Trading for DW Traders
by
Pragasit Thitaram
PPT
Technical Analysis Basic with KGI Thailand.
by
Pk Daily Watch
PDF
Ebooksint จัดพอร์ตเชิงรุกด้วยกลยุทธ์แบบ momentum trading
by
Rose Banioki
PDF
จัดพอร์ทหุ้นด้วยเทคนิค Momentum
by
Akarawat Thanachitnawarat
PPT
Technic
by
guest1f9180
PDF
Macd professional_Thailand
by
Olymp Trade
PDF
Alligator Hunter
by
Pragasit Thitaram
PDF
Note CANSLIM By WaveRiders
by
Pragasit Thitaram
PPTX
I am quant by jessada infiniti
by
siamquant
PPTX
SQ Recruitment Camp 2017 : กลยุทธ์การปรับพอร์ตด้วย Value, Quality และ Price T...
by
siamquant
PDF
เริ่มต้นลงทุนหุ้นแนวพื้นฐาน - Mr.LikeStock (Start Invest by Fundamental)
by
Earn LikeStock
PDF
Technical part2
by
Bhundit Vongumpaiprasert
PPTX
Financial forecasting by time series 55660701
by
Pongsiri Nontasak
PPTX
ครั้งแรกก่อนใครในประเทศ! เผยกลยุทธ์การลงทุนครึ่งปีหลัง 2022 - FINNOMENA LIVE
by
Ploy50
Technical part3
by
Bhundit Vongumpaiprasert
พิชิตหุ้นด้วยการวิเคราะห์ปัจจัยพื้นฐาน และเทคนิค
by
Audy Kenaydep
พิชิตหุ้นด้วย "ปัจจัยพื้นฐาน" และ "ปัจจัยทางเทคนิค"
by
Audyken Ssy
Tradingview on demand for investment in all
by
Phichart Charoensuk
เรียนอ่านกราฟทางเทคนิคเบื้องต้น
by
Pk Daily Watch
Technical 20150228
by
Bhundit Vongumpaiprasert
Fibonacci Trading for DW Traders
by
Pragasit Thitaram
Technical Analysis Basic with KGI Thailand.
by
Pk Daily Watch
Ebooksint จัดพอร์ตเชิงรุกด้วยกลยุทธ์แบบ momentum trading
by
Rose Banioki
จัดพอร์ทหุ้นด้วยเทคนิค Momentum
by
Akarawat Thanachitnawarat
Technic
by
guest1f9180
Macd professional_Thailand
by
Olymp Trade
Alligator Hunter
by
Pragasit Thitaram
Note CANSLIM By WaveRiders
by
Pragasit Thitaram
I am quant by jessada infiniti
by
siamquant
SQ Recruitment Camp 2017 : กลยุทธ์การปรับพอร์ตด้วย Value, Quality และ Price T...
by
siamquant
เริ่มต้นลงทุนหุ้นแนวพื้นฐาน - Mr.LikeStock (Start Invest by Fundamental)
by
Earn LikeStock
Technical part2
by
Bhundit Vongumpaiprasert
Financial forecasting by time series 55660701
by
Pongsiri Nontasak
ครั้งแรกก่อนใครในประเทศ! เผยกลยุทธ์การลงทุนครึ่งปีหลัง 2022 - FINNOMENA LIVE
by
Ploy50
เครื่องมือกราฟแท่งเทียน
1.
SOLVER INSTITUTE ©
2008 www.solverenterprise.com njamras@hotmail.com การวิเคราะห์หุ้นทางเทคนิค
2.
การวิเคราะห์หุ้นทางเทคนิคด้วยโปรแกรม GCI Trader
SOLVER INSTUITUTE © 2008 “คู่มือการวิเคราะหุ้นทางเทคนิค ฉบับเพื่อประชาชนนี้ ขออุทิศผลบุญนี้ให้แก่บิดามารดาของข้าพเจ้า ที่ได้เสียสละทั้งกาลังเงิน, กาลังกาย, เวลาและความรัก และการสนับสนุนข้าพเจ้าตลอดมา” อ. นราธิป จารัส
3.
การวิเคราะห์หุ้นทางเทคนิคด้วยโปรแกรม GCI Trader
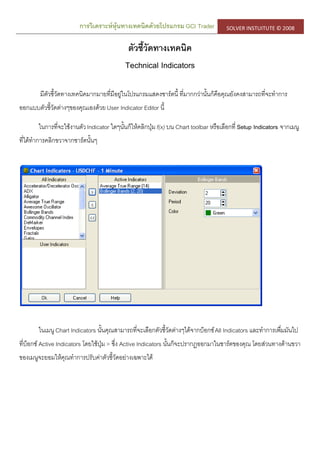
SOLVER INSTUITUTE © 2008 ตัวชี้วัดทางเทคนิค Technical Indicators มีตัวชี้วัดทางเทคนิคมากมายที่มีอยู่ในโปรแกรมแสดงชาร์ตนี้ ที่มากกว่านั้นก็คือคุณยังคงสามารถที่จะทาการ ออกแบบตัวชี้วัดต่างๆของคุณเองด้วย User Indicator Editor นี้ ในการที่จะใช้งานตัวIndicator ใดๆนั้นก็ให้คลิกปุ่มf(x) บน Chart toolbar หรือเลือกที่ Setup Indicators จากเมนู ที่ได้ทาการคลิกขวาจากชาร์ตนั้นๆ ในเมนู Chart Indicators นั้นคุณสามารถที่จะเลือกตัวชี้วัดต่างๆได้จากบ็อกซ์All Indicators และทาการเพื่มมันไป ที่บ็อกซ์ Active Indicators โดยใช้ปุ่ม > ซึ่ง Active Indicators นั้นก็จะปรากฏออกมาในชาร์ตของคุณ โดยส่วนทางด้านขวา ของเมนูจะยอมให้คุณทาการปรับค่าตัวชี้วัดอย่างเฉพาะได้
4.
การวิเคราะห์หุ้นทางเทคนิคด้วยโปรแกรม GCI Trader
SOLVER INSTUITUTE © 2008 ตัวชี้วัดต่างๆที่สามารถใช้ได้ดังต่อไปนี้: Accelerator/Decelerator Average Directional Movement Alligator Average True Range Awesome Oscillator Bollinger Bands Commodity Channel Index DeMaker Envelopes Fractals Gator Linear Regression Moving Average Convergence/Divergence Momentum Moving Average Parabolic SAR Relative Strength Index Standard Deviation Stochastic Williams’ Percent Range
5.
การวิเคราะห์หุ้นทางเทคนิคด้วยโปรแกรม GCI Trader
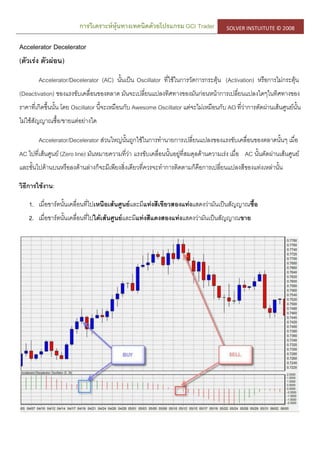
SOLVER INSTUITUTE © 2008 Accelerator Decelerator (ตัวเร่ง ตัวผ่อน) Accelerator/Decelerator (AC) นั้นเป็น Oscillator ที่ใช้ในการวัดการกระตุ้น (Activation) หรือการไม่กระตุ้น (Deactivation) ของแรงขับเคลื่อนของตลาด มันจะเปลี่ยนแปลงทิศทางของมันก่อนหน้าการเปลี่ยนแปลงใดๆในทิศทางของ ราคาที่เกิดขึ้นนั้น โดย Oscillator นี้จะเหมือนกับ Awesome Oscillator แต่จะไม่เหมือนกับ AO ที่ว่าการตัดผ่านเส้นศูนย์นั้น ไม่ใช้สัญญาณซื้อ/ขายแต่อย่างใด Accelerator/Decelerator ส่วนใหญ่นั้นถูกใช้ในการทานายการเปลี่ยนแปลงของแรงขับเคลื่อนของตลาดนั้นๆ เมื่อ AC ไปที่เส้นศูนย์ (Zero line) มันหมายความที่ว่า แรงขับเคลื่อนนั้นอยู่ที่สมดุลด้านความเร่ง เมื่อ AC นั้นตัดผ่านเส้นศูนย์ และขั้นไปด้านบนหรือลงด้านล่างก็จะมีเพียงสิ่งเดียวที่ควรจะทาการติดตามก็คือการเปลี่ยนแปลงสีของแท่งเหล่านั้น วิธีการใช้งาน: 1. เมื่อชาร์ตนั้นเคลื่อนที่ไปเหนือเส้นศูนย์และมีแท่งสีเขียวสองแท่งแสดงว่ามันเป็นสัญญาณซื้อ 2. เมื่อชาร์ตนั้นเคลื่อนที่ไปใต้เส้นศูนย์และมีแท่งสีแดงสองแท่งแสดงว่ามันเป็นสัญญาณขาย
6.
การวิเคราะห์หุ้นทางเทคนิคด้วยโปรแกรม GCI Trader
SOLVER INSTUITUTE © 2008 Average Directional Movement (ค่าเฉลี่ยทิศทางเคลื่อนที่) Average Directional Movement (ADX) เป็นตัวชี้วัดที่ถูกใช้ในการหาค่าความเข้มแข็งของเทรนในปัจจุบัน ซึ่ง ตัวชี้วัดนี้ได้มาจากความแตกต่างของสอง Direction Momentum Indicators (DI) ซึ่งความแตกต่างระหว่าง ADX และ DI โดยที่อย่างหลังนั้นจะถูกใช้ในการตามทิศทางของเทรนนั้นๆ ในขณะที่ ADX จะทาการวัดค่าความเข้มแข็งของเทรนนั้นๆ ADX นั้นหลักๆแล้วจะถูกใช้ในการหาเทรนของตลาดต่างๆและมันจะถูกวัดในเสกลจาก 0 ถึง 100 เมื่อตัวชี้วัดนั้นอยู่ ใต้ 20 มันหมายความที่ว่าแนวโน้มนั้นมีความอ่อนแอและเป็นไปได้ที่จะมีการเปลี่ยนทิศทาง เมื่อมันขึ้นไปเหนือกว่า 40 เทรน นั้นก็จะสามารถถือได้ว่าเป็นแนวโน้มที่มีความเข้มแข็งอย่างหนึ่งด้วยความเป็นไปได้ที่จะมีการเปลี่ยนแปลงในอนาคต ซึ่ง ADX บ่อยครั้งจะถูกใช้ร่วมกับ DI ในการทาการตัดสินใจในการซื้อขายต่างๆ วิธีการใช้งาน: 1. เมื่อ +DI (น้าเงิน) อยู่เหนือ -DI (แดง) นั่นเป็นสัญญาณซื้อ 2. เมื่อ +DI (น้าเงิน) อยู่ใต้ -DI (แดง) นั่นเป็นสัญญาณขาย หมายเหตุ: ADX จะทาการวัดความเข้มแข็งของเทรนนั้นๆแต่ไม่ใช่ทาการวัดทิศทางของมัน ให้รอจนกระทั่งDI ตัดผ่านซึ่ง กันและกันก่อนหน้าที่จะทาการตัดสินใจซื้อขายใดๆ
7.
การวิเคราะห์หุ้นทางเทคนิคด้วยโปรแกรม GCI Trader
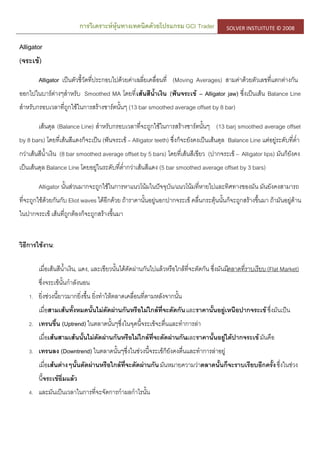
SOLVER INSTUITUTE © 2008 Alligator (จระเข้) Alligator เป็นตัวชี้วัดที่ประกอบไปด้วยค่าเฉลี่ยเคลื่อนที่ (Moving Averages) สามค่าด้วยตัวเลขที่แตกต่างกัน ออกไปในบาร์ต่างๆสาหรับ Smoothed MA โดยที่เส้นสีน้าเงิน (ฟันจระเข้ – Alligator jaw) ซึ่งเป็นเส้น Balance Line สาหรับกรอบเวลาที่ถูกใช้ในการสร้างชาร์ตนั้นๆ (13 bar smoothed average offset by 8 bar) เส้นดุล (Balance Line) สาหรับกรอบเวลาที่จะถูกใช้ในการสร้างชาร์ตนั้นๆ (13 barj smoothed average offset by 8 bars) โดยที่เส้นสีแดงก็จะเป็น (ฟันจระเข้ – Alligator teeth) ซึ่งก็จะยังคงเป็นเส้นดุล Balance Line แต่อยู่ระดับที่ต่า กว่าเส้นสีน้าเงิน (8 bar smoothed average offset by 5 bars) โดยที่เส้นสีเขียว (ปากจระเข้ – Alligator lips) มันก็ยังคง เป็นเส้นดุล Balance Line โดยอยู่ในระดับที่ต่ากว่าเส้นสีแดง (5 bar smoothed average offset by 3 bars) Alligator นั้นส่วนมากจะถูกใช้ในการหาแนวโน้มในปัจจุบัน/แนวโน้มที่หายไปและทิศทางของมัน มันยังคงสามารถ ที่จะถูกใช้ด้วยกันกับ Eliot waves ได้อีกด้วย ถ้าราคานั้นอยู่นอกปากจระเข้ คลื่นกระตุ้นนั้นก็จะถูกสร้างขึ้นมา ถ้ามันอยู่ด้าน ในปากจระเข้ เส้นที่ถูกต้องก็จะถูกสร้างขึ้นมา วิธีการใช้งาน: เมื่อเส้นสีน้าเงิน, แดง, และเขียวนั้นได้ตัดผ่านกันไปแล้วหรือใกล้ที่จะตัดกัน ซึ่งมันมีตลาดที่ราบเรียบ (Flat Market) ซึ่งจระเข้นั้นกาลังนอน 1. ยิ่งช่วงนี้ยาวมากยิ่งขึ้น ยิ่งทาให้ตลาดเคลื่อนที่ตามหลังจากนั้น เมื่อสามเส้นทั้งหมดนั้นไม่ตัดผ่านกันหรือไม่ใกล้ที่จะตัดกันและราคานั้นอยู่เหนือปากจระเข้ซึ่งมันเป็น 2. เทรนขึ้น (Uptrend) ในตลาดนั้นๆซึ่งในจุดนี้จระเข้จะตื่นและทาการล่า เมื่อเส้นสามเส้นนั้นไม่ตัดผ่านกันหรือไม่ไกล้ที่จะตัดผ่านกันและราคานั้นอยู่ใต้ปากจระเข้มันคือ 3. เทรนลง (Downtrend) ในตลาดนั้นๆซึ่งในช่วงนี้จระเข้ก็ยังคงตื่นและทาการล่าอยู่ เมื่อเส้นต่างๆนั้นตัดผ่านหรือใกล้ที่จะตัดผ่านกันมันหมายความว่าตลาดนั้นก็จะราบเรียบอีกครั้งซึ่งในช่วง นี้จระเข้อิ่มแล้ว 4. และมันเป็นเวลาในการที่จะจัดการกาผลกาไรนั้น
8.
การวิเคราะห์หุ้นทางเทคนิคด้วยโปรแกรม GCI Trader
SOLVER INSTUITUTE © 2008
9.
การวิเคราะห์หุ้นทางเทคนิคด้วยโปรแกรม GCI Trader
SOLVER INSTUITUTE © 2008 Average True Range (ค่าเฉลี่ยระยะจริง) Average True Range (ATR) เป็นตัวชี้วัดที่ใช้ในการวัดความผันผวนของตลาดนั้นๆ โดยทั่วไปมันจะเป็นค่าเฉลี่ย เคลื่อนที่ 14 วันของระยะจริง (14-day Moving Average of the True Range) โดยที่ระยะจริง (True Range – TR) จะอยู่ ในรอบของมันที่ได้กาหนดเอาไว้เป็นความแตกต่างที่มากที่สุดของราคาสูงสุดของวันนี้และราคาต่าสุดของวันนี้ ราคาสูงสุด ของวันนี้และราคาปิดเมื่อวานและราคาต่าสุดของวันนี้และราคาปิดเมื่อวาน ซึ่งค่าTR ที่มากก็จะทาให้ความผันผวนของ สินค้าตัวนั้นมีความผันผวนมากขึ้นตามไปด้วย ส่วนค่าTR ที่น้อยค่าความผันผวนก็จะน้อยตาม วิธีการใช้งาน: 1. ค่าของตัวชี้วัดนี้โดยทั่วไปจะสูงเมื่อราคานั้นมีการเปลี่ยนแปลงไปอย่างทันทีทันใด 2. ถ้าค่าของตัวชี้วัดนั้นไม่สูงราคานั้นก็จะยังคงเสถียรอยู่ 3. ก่อนหน้าการเปลี่ยนแปลงขึ้น/ลงที่มีนัยสาคัญ ค่าของตัวชี้วัดนี้โดยทั่วไปมักจะต่า/สูง หมายเหตุ: เมื่อค่า ATR แสดงถึงความผันผวนในระดับที่แท้จริง(Absolute level) โดยเมื่อราคาสินค้าที่ต่าจะมีระดับATR ที่ต่ากว่าราคาสินค้าทีสูง
10.
การวิเคราะห์หุ้นทางเทคนิคด้วยโปรแกรม GCI Trader
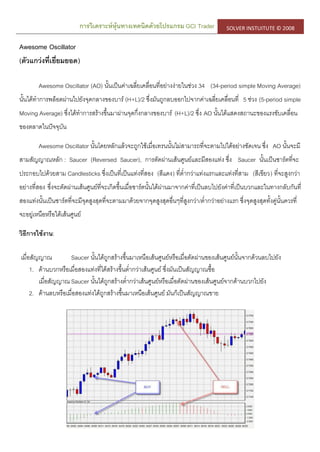
SOLVER INSTUITUTE © 2008 Awesome Oscillator (ตัวแกว่งที่เยี่ยมยอด) Awesome Oscillator (AO) นั้นเป็นค่าเฉลี่ยเคลื่อนที่อย่างง่ายในช่วง 34 (34-period simple Moving Average) นั้นได้ทาการพล็อตผ่านไปยังจุดกลางของบาร์ (H+L)/2 ซึ่งมันถูกลบออกไปจากค่าเฉลี่ยเคลื่อนที่ 5 ช่วง (5-period simple Moving Average) ซึ่งได้ทาการสร้างขึ้นมาผ่านจุดกึ่งกลางของบาร์ (H+L)/2 ซึ่ง AO นั้นได้แสดงสถานะของแรงขับเคลื่อน ของตลาดในปัจจุบัน Awesome Oscillator นั้นโดยหลักแล้วจะถูกใช้เมื่อเทรนนั้นไม่สามารถที่จะตามไปได้อย่างชัดเจน ซึ่ง AO นั้นจะมี สามสัญญาณหลัก : Saucer (Reversed Saucer), การตัดผ่านเส้นศูนย์และมีสองแท่ง ซึ่ง Saucer นั้นเป็นชาร์ตที่จะ ประกอบไปด้วยสาม Candlesticks ซึ่งเป็นที่เป็นแท่งที่สอง (สีแดง) ที่ต่ากว่าแท่งแรกและแท่งที่สาม (สีเขียว) ที่จะสูงกว่า อย่างที่สอง ซึ่งจะตัดผ่านเส้นศูนย์ที่จะเกิดขึ้นเมื่อชาร์ตนั้นได้ผ่านมาจากค่าที่เป็นลบไปยังค่าที่เป็นบวกและในทางกลับกันที่ สองแท่งนั้นเป็นชาร์ตที่จะมีจุดสูงสุดที่จะตามมาด้วยจากจุดสูงสุดอื่นๆที่สูงกว่า/ต่ากว่าอย่างแรก ซึ่งจุดสูงสุดทั้งคู่นั้นควรที่ จะอยู่เหนือหรือใต้เส้นศูนย์ วิธีการใช้งาน: เมื่อสัญญาณ Saucer นั้นได้ถูกสร้างขึ้นมาเหนือเส้นศูนย์หรือเมื่อตัดผ่านของเส้นศูนย์นั้นจากด้วนลบไปยัง 1. ด้านบวกหรือเมื่อสองแท่งที่ได้สร้างขึ้นต่ากว่าเส้นศูนย์ ซึ่งมันเป็นสัญญาณซื้อ เมื่อสัญญาณ Saucer นั้นได้ถูกสร้างต่ากว่าเส้นศูนย์หรือเมื่อตัดผ่านของเส้นศูนย์จากด้านบวกไปยัง 2. ด้านลบหรือเมื่อสองแท่งได้ถูกสร้างขึ้นมาเหนือเส้นศูนย์ มันก็เป็นสัญญาณขาย
11.
การวิเคราะห์หุ้นทางเทคนิคด้วยโปรแกรม GCI Trader
SOLVER INSTUITUTE © 2008 Bollinger Bands (แถบโบลิงเจอร์) Bollinger Bands (BB) นั้นเป็นตัวชี้วัดที่ใช้ในการเปรียบเทียบความผันผวน(Volatility) และระดับราคาสัมพันธ์ (Relative Price Levels) เหนือช่วงของเวลาหนึ่งๆ ซึ่งBollinger Bands นั้นจะทาการปรับเปลี่ยนไปตามเงื่อนไขของตลาด ตามที่ตลาดนั้นกลายมาเป็นตลาดที่มีความผันผวนมากขึ้น ซึ่งแถวนั้นก็จะกว้างขึ้นตาม ซึ่งแถบนี้จะแคบลงเมื่อตลาดนั้นมี ความผันผวนน้อย การใช้ Bollinger Bands นั้นเป็นพื้นฐานมาจากความเป็นจริงที่ว่าราคานั้นโดยทั่วไปจะยังคงอยู่ภายในขอบเขต บนสุดและล่างสุด ซึ่ง BB โดยหลักแล้วจะถูกใช้ในการตัดสินใจถ้าค่าในปัจจุบันของฟิลด์ข้อมูลนั้นอยู่อย่างปรกติหรือโดด ออกไปในทิศทางอื่นๆ โดย BB นั้นยังคงที่จะสามารถถูกใช้สาหรับการระบุเมื่อแนวโน้มนั้นมีการกลับทิศทางซึ่งก็ควรที่จะ คาดเอาไว้ โดยความกว้างของตัวแปร BB นั้นจะเป็นสาเหตุมาจากความผันผวนของราคานั่นเอง วิธีการใช้งาน: 1. การเปลี่ยนแปลงอย่างทันทีทันใดของราคานั้นจะเกิดขึ้นหลังจากแถบที่แคบ 2. ถ้าราคานั้นตัดผ่านขอบเขตไป มันเป็นสัญญาณที่ว่าเทรนในปัจจุบันนั้นจะเกิดขึ้นอย่างต่อเนื่อง 3. การเคลื่อนที่ของราคาที่ได้เกิดขึ้นที่ขอบเขตด้านหนึ่งจะมีแนวโน้มที่จะวิ่งไปยังทางขอบเขตอีกด้านหนึ่ง
12.
การวิเคราะห์หุ้นทางเทคนิคด้วยโปรแกรม GCI Trader
SOLVER INSTUITUTE © 2008 Commodity Channel Index (ดัชนี) Commodity Channel Index (CCI) นั้นเป็นออสซิเลเตอร์ที่ให้การบ่งชี้ของตลาดที่เป็นทั้งที่มีการซื้อมากเกินไป (Overbought Markets) และตลาดที่มีแรงขายมากเกินไป(Oversold Markets) ซึ่งเป็นเครื่องมือที่ถือได้ว่าจะเกิดOversold เมื่อ CCI นั้นไปต่ากว่า -100 และจะเกิด Overbought เมื่อมันเกิน +100 ซึ่ง CCI นั้นจะทาการวัดความสัมพันธ์ระหว่าง ราคาสินทรัพย์ (Asset’s Price), ค่าเฉลี่ยเคลื่อนทื่ (Moving Average) และส่วนเบี่ยงเบนจากค่าเฉลี่ย(Deviations from the average) ซึ่ง CCI ส่วนมากนั้นจะถูกใช้ในการหาแนวโน้ม(Cyclical trends) ของ Commodity, Equity และ Currency Markets ซึ่งมันจะเป็นการกาหนดศักยภาพของค่าสูงสุด(Potential Peaks) และกุบเขาแห่งราคาสินทรัพย์ (Asset’s Price) และแสดงให้เห็ฯถึงการเปลี่ยแปลงโดยประมาณในทิศทางของการเคลื่อนที่ของราคาสินทรัพย์นั้นๆ วิธีการใช้งาน: การเลื่อนที่ของ CCI: เมื่อ CCI เคลื่อนที่กลับหนือ -100 มันสามารถที่จะถือได้ว่าเป็นสัญญาณในการซื้อ(signal to buy) เมื่อ CCI เคลื่อนที่กลับ 1. ต่ากว่า +100 มันสามารถที่จะถือได้ว่าเป็นสัญญาณขาย(Signal to sell) ซึ่ง Divergence (เมื่อ Indicator นั้นมีแนวโน้มไปในทิศทางที่ตรงข้ามของราคานั้นๆ): Positive Divergence จะต่ากว่า -100 ซึ่งจะเป็นการเพิ่มขึ้นของความแข็งแกร่งของสัญญาณที่เป็นฐานในการ เคลื่อนที่กลับมาเหนือ -100 Negative Divergence จะเหนือ +100 ซึ่งอาจะเป็น 2. การเพิ่มความแข็งแกร่งของสัญญาณที่มีฐานในการเคลื่อนที่กลับมาต่าก่า +100 ซึ่ง Indicator ต่างๆ: ก็จะล่วงหน้าเหนือ -100 และเส้นแนวโน้มก็จะแหวกออกมาแสดงให้เห็นที่ว่าสินค้านั้นๆเกิดการ ขายมากเกินไป (Oversold) และเป็นแนวโน้มที่สามารถที่จะถือได้ว่าเป็นตลาดกระทิง(Bullish) โดยที่การลดลงต่า กว่า +100 และเส้นแนวโน้มที่แหวกไปก็จะเป็นการแสดงให้เห็นถึงที่ว่าหุ้นนั้นเกิดการซื้อที่มากเกินไปOverbought) และเป็นแนวโน้มที่สามารถ 3. ที่สามารถถือได้ว่าเป็นตลาดหมี (Bearish)
13.
การวิเคราะห์หุ้นทางเทคนิคด้วยโปรแกรม GCI Trader
SOLVER INSTUITUTE © 2008
14.
การวิเคราะห์หุ้นทางเทคนิคด้วยโปรแกรม GCI Trader
SOLVER INSTUITUTE © 2008 DeMarker (ดีมาร์คเกอร์) DeMarker (Demarker, De Marker, DeM) นั้นเป็น Indicator ที่ใช้ในการบ่งชี้การอ่านแรงของราคา(Price exhaustion) ก็เหมือนกับค่าต่าสุดและค่าสูงสุดของศักยภาพทางด้านราคา(Potential Price) ซึ่งจะผันผวนระหว่าง 0 และ 1 และทาการเปรียบเทียบกับราคาที่ผ่านมาส่วนมากกับช่วงของราคาที่ผ่านมาเพื่อที่จะทาการวัดความต้องการที่มีอยู่ของ สินทรัพย์อ้างอิง (Underlying asset) ซึ่ง DeMarket นั้นถูกใช้ในการระบุระดับความเสี่ยงก่อนที่จะทาการเปิดตาแหน่ง ในกรณีส่วนมากเมื่อราคา สินทรัพย์นั้นไปเหนือที่ 0.6 ระดับความผันผวน(Volatility) และระดับความเสียง (Risk) นั้นจะต่ากว่า ในขณะที่ทาการอ่าน ได้ต่ากว่า 0.4 ที่สามารถถือได้ว่าเป็นสัญญาณในการเพิ่มขึ้นของความเสี่ยง ที่มากกว่านั้นก็คือในการใช้ตัวชี้วัดไปเหนือช่วง ระยะเวลานานๆอย่าง (อาทิตย์, เดือน) ที่จะให้เป็นโอกาสในการที่จะติดตามพฤติกรรมชองตลาดในระยะยาวได้ วิธีการใช้งาน: 1. เมื่อค่าตัวชี้วัดนั้นหล่นไปต่ากว่า 0.3คาดไว้ว่าจะเกิด Bullish Price Reversal 2. เมื่อค่าตัวชี้วัดนั้นขึ้นไปสูงกว่า 0.7 คาดไว้ว่าจะเกิด Bearish Price Reversal
15.
การวิเคราะห์หุ้นทางเทคนิคด้วยโปรแกรม GCI Trader
SOLVER INSTUITUTE © 2008 Envelopes (เอนเวโลพ) Envelopes (Moving Average Envelope, Trading Bands นั้นเป็นตัวชี้วัดทางเทคนิคที่ประกอบไปด้วยค่าเฉลี่ย เคลื่อนที่สองตัว: ตัวหนึ่งเคลื่อนที่ด้านบน และอีกตัวหนึ่งเคลื่อนที่ด้านล่าง ซึ่งตัวชี้วัดนี้จะเป็นการกาหนดขอบเขตด้านบน และด้านล่างของระยะราคา ซึ่งมีความผันผวนสูงกว่า (Higher Volatility) ที่ควรจะนาไปยังเปอร์เซ็นต์การเบี่ยงเบนที่สูงกว่า (Higher Deviation Percentage) สิ่งหนึ่งที่ควรตระหนักไว้ในใจก็คือที่ว่าเมื่อมีเพียงข้อมูลที่ผ่านมานั้นถูกใช้สาหรับการคานวณตัวชี้วัด ซึ่งมันก็ยังคง เป็นเพียงเล็กน้อยเบื้องหนังราคาที่แท้จริง ที่เป็นผลลัพธ์ ซึ่งมันไม่ใช้การทานายการเปลี่ยนเปลงใดๆในแนวโน้มนั้นๆ แต่มัน เป็นเพียงการระบุมันออกมาเท่านั้น วิธีการใช้งาน: 1. เมื่อตัวชี้วัดนั้นไปถึงจุดต่าทีสุดของมันและหันกลับไปยังทิศทางที่ตรงกันข้ามมันสามารถที่จะถือให้เป็นสัญญาณซื้อ 2. เมื่อตัวชี้วัดนั้นไปถึงจุดสูงที่สุดของมันและหันกลับไปยังทิศทางที่ตรงกันข้ามมันสามารถที่จะถือได้ว่าเป็นสัญญาณ ขาย
16.
การวิเคราะห์หุ้นทางเทคนิคด้วยโปรแกรม GCI Trader
SOLVER INSTUITUTE © 2008 Fractals (แฟรกตัล) Fractals นั้นเป็นตัวชี้วัดที่ใช้ในการตรวจหาขอบเขตสูง (Higher Limits) และขอบเขตล่าง (Lower Limits) ของ แนวโน้มในปัจจุบันและสามารถที่จะทาการทานายความเป็นไปได้ของการกลับทิศ (Reversal) ของแนวโน้ม (Trend) ซึ่ง ตัวชี้วัดนี้เป็นอนุกรมของอย่างน้อยห้าบาร์ที่สาเร็จด้วยจุดสูงสุดที่สูงที่สุดในด้านตรงกลางและสองด้านสูงที่ต่ากว่าท้างสอง ด้าน โดยที่อนุกรมตรงข้ามนั้นอย่างน้อยมีห้าบาร์ที่สาเร็จกับที่ต่าที่สุดในด้านที่อยู่ตรงกลางและสองด้านต่าที่สูงกว่าทั้งสอง ด้าน โดยที่ Fractals นั้นจะถูกใช้โดยส่วนมากในการทานายการกลับทิศ (Reversal) ในแนวโน้มในปัจจุบัน ซึ่งจะเลื่อน จากแนวโน้มลง (Downtrend) ไปยังแนวโน้มขึ้น (Uptrend) ที่สามารถจะตามได้เมื่อบาร์ที่ต่าที่สุดนั้นอยู่ครงกลางของ รูปแบบและสองบาร์ด้วยด้านต่าที่สูงกว่าสาเร็จนั้นพบบนด้านไม่ว่าจะเป็นด้านใดด้านหนึ่งของมัน การเลื่อนจากแนวโน้มขึ้น (Uptrend) ไปเป็นแนวโน้มที่เป็นขาลง (Downtrend) นั้นสามารถถูกหาได้เมื่อบาร์ที่สูงที่สุดนั้นอยู่กลางของรูปแบบและสอง บาร์ที่มีด้าน Lower high ที่อยู่ทั้งสองด้านของมัน หมายเหตุที่ว่า Fractals นั้นจะมีประสิทธิภาพเมื่อถูกใช้ในการเชื่อมกับ ตัวชี้วัดอื่นๆอย่าง MA, Fibonacci Retracement และ Alligator วิธีการใช้งาน: 1. ถ้า BUY Fractal นั้นจะสูงกว่าเส้นสีแดง(Alligator teeth) มันเป็นสัญญาณซื้อ 2. ถ้า SELL fractal นั้นจะต่ากว่าเส้นสีแดง(Alligator teeth) มันเป็นสัญญาณขาย
17.
การวิเคราะห์หุ้นทางเทคนิคด้วยโปรแกรม GCI Trader
SOLVER INSTUITUTE © 2008 Gator (เกเตอร์) Gator นั้นเป็น Oscillator ที่เป็นฐานมาจากตัวชี้วัด Alligator ที่ใช้ในการแสดงระดับของ Divergence / Convergence ของ Smoothed Moving Averages โดยที่ Oscillator นี้จะถูกชี้วัดในรูปแบบของสองบาร์ชาร์ท อย่างแรกไม่ว่าจะเป็นด้านเส้นศูนย์ ซึ่งบาร์ชาร์ทด้านบน นั้นแสดงให้เห็นถึงระยะห่างระหว่างเส้นสีแดงและเส้นสีน้าเงิน โดยที่บาร์ชาร์ทด้านล่างนั้นแสดงให้เห็นถึงระยะห่างระหว่าง เส้นสีแดงและเส้นสีเขียว โดยที่บาร์ชาร์ทนั้นมีสีแดงและน้าเงิน: บาร์นั้นจะกลายมาเป็นสีแดงเมื่อค่าของมันต่ากว่าบาร์ก่อน หน้าอันหนึ่งและจะกลายมาเป็นสีเขียวเมื่อค่าของมันนั้นสูงกว่าบาร์ก่อนหน้าอันหนึ่ง GatorOscillatorนั้นจะช่วยในการทาให้สามาถมองเห็นและทาการตัดสินใจไม่ว่าจะเป็นแนวโน้มในปัจุบันหรืออดีต ในช่วงเวลาต่างๆ ซึ่งมันก็ยังช่วยในการทาให้สามารถที่จะมองเห็นการเข้าใกล้ (Rapprochement) และการตัดกันของ Smoothed Moving Averages (Balance Lines)
18.
การวิเคราะห์หุ้นทางเทคนิคด้วยโปรแกรม GCI Trader
SOLVER INSTUITUTE © 2008 Linear Regression (เชิงเส้นถดถอย) Linear Regression นั้นเป็นวิธีการทางสถิติในการติดตามแนวโน้มหนึ่งๆ ซึ่งผลลัพธ์ของมันนั้นโดยทั่วไปแล้วนั้นจะ ใกล้ๆกับ Moving Average และวิธีการใช้งานของมันนั้นก็คล้ายๆกัน แต่ไม่เหมือนกับMA โดยที่ Linear Regression นั้นจะ มีดีเลย์น้อยกว่าและนั่นเป็นการตอบรับที่มากขึ้นต่าการเปลี่ยนแปลงของราคา Linear Regression นั้นถูกใช้ในการบ่งชี้ให้เห็นถึงแนวโน้มที่มีความโดดเด่น(Dominant trend) ในตลาดที่มีการ ดีเลย์เพียงเล็กน้อยจากราคาจริงของสินทรัพย์ ซึ่งมันยังคงที่จะสามารถให้ข้อมูลเกี่ยวกับการเบี่ยงเบนในอนาคตFuture Divergence ของแนวโน้มหลักไม่แค่เพียงเมื่อราคานั้นเริ่มเคลื่อนที่ไปไกล้แนวเส้นโน้มภายในระยะแคบๆหนึ่งๆ วิธีการใช้งาน: 1. ทิศทางของตัวชี้วัดนั้นแสดงให้เห็นถึงไม่ว่าจะเป็นว่ามีแนวโน้มที่เป็นBullish หรือ Bearish ในตลาดขณะนั้นก็ตาม โดยที่การตัดกันของตัวชี้วัดนั้นและชาร์ดราคานั้นจะเป็นการยืนยันให้เห็นถึงการเปลี่ยนแปลงของแนวโน้มนั้นๆ ซึ่ง มันไม่แต่เป็นการยืนยันเพราะว่า 2. การเปลี่ยนแปลงในตัวชี้วัดนี้นั้นจะสายไปสาหรับการเปรียบเทียบกับการเปลี่ยนแปลงของราคาหนึ่งๆ หมายเหตุ: ถ้าราคาเปลี่ยนแปลงไปอย่างมีรูปแบบไปรอบๆเส้นถดถอย(Regression Line) ซึ่งแนวโน้มตลาดนั้นก็ควรที่จะ มีการโอนเอียงที่จะเกิดขึ้นอย่างต่อเนื่อง
19.
การวิเคราะห์หุ้นทางเทคนิคด้วยโปรแกรม GCI Trader
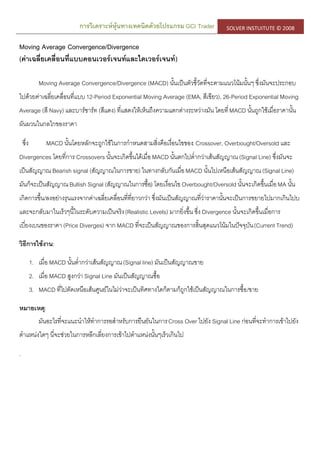
SOLVER INSTUITUTE © 2008 Moving Average Convergence/Divergence (ค่าเฉลี่ยเคลื่อนที่แบบคอนเวอร์เจนท์และไดเวอร์เจนท์) Moving Average Convergence/Divergence (MACD) นั้นเป็นตัวชี้วัดที่จะตามแนวโน้มนั้นๆ ซึ่งมันจะประกอบ ไปด้วยค่าเฉลี่ยเคลื่อนที่แบบ12-Period Exponential Moving Average (EMA, สีเขียว), 26-Period Exponential Moving Average (สี Navy) และบาร์ชาร์ท (สีแดง) ที่แสดงให้เห็นถึงความแตกต่างระหว่างมัน โดยที่MACD นั้นถูกใช้เมื่อราคานั้น ผันผวนในกลไกของราคา ซึ่ง MACD นั้นโดยหลักจะถูกใช้ในการกาหนดสามสิ่งคือเงื่อนไขของ: Crossover, Overbought/Oversold และ Divergences โดยที่การ Crossovers นั้นจะเกิดขึ้นได้เมื่อMACD นั้นตกไปต่ากว่าเส้นสัญญาณ(Signal Line) ซึ่งมันจะ เป็นสัญญาณ Bearish signal (สัญญาณในการขาย) ในทางกลับกันเมื่อMACD นั้นไปเหนือเส้นสัญญาณ(Signal Line) มันก็จะเป็นสัญญาณBullish Signal (สัญญาณในการซื้อ) โดยเงื่อนไข Overbought/Oversold นั้นจะเกิดขึ้นเมื่อMA นั้น เกิดการขึ้น/ลงอย่างรุนแรงจากค่าเฉลี่ยเคลื่อนที่ที่ยาวกว่า ซึ่งมันเป็นสัญญาณที่ว่าราคานั้นจะเป็นการขยายไปมากเกินไปบ และจะกลับมาในเร็วๆนี้ในระดับความเป็นจริง(Realistic Levels) มากยิ่งขึ้น ซึ่ง Divergence นั้นจะเกิดขึ้นเมื่อการ เบี่ยงเบนของราคา (Price Diverges) จาก MACD ที่จะเป็นสัญญาณของการสิ้นสุดแนวโน้มในปัจจุบัน(Current Trend) วิธีการใช้งาน: 1. เมื่อ MACD นั้นต่ากว่าเส้นสัญญาณ(Signal line) มันเป็นสัญญาณขาย 2. เมื่อ MACD สูงกว่า Signal Line มันเป็นสัญญาณซื้อ 3. MACD ที่ไปตัดเหนือเส้นศูนย์ในไม่ว่าจะเป็นทิศทางใดก็ตามก็ถูกใช้เป็นสัญญาณในการซื้อ/ขาย หมายเหตุ: มันอะไรที่จะแนะนาให้ทาการรอสาหรับการยืนยันในการCross Over ไปยัง Signal Line ก่อนที่จะทาการเข้าไปยัง ตาแหน่งใดๆ นี่จะช่วยในการหลีกเลี่ยงการเข้าไปตาแหน่งนั้นๆเร็วเกินไป .
20.
การวิเคราะห์หุ้นทางเทคนิคด้วยโปรแกรม GCI Trader
SOLVER INSTUITUTE © 2008
21.
การวิเคราะห์หุ้นทางเทคนิคด้วยโปรแกรม GCI Trader
SOLVER INSTUITUTE © 2008 Momentum (โมเมนตั้ม) Momentum นั้นเป็น Indicator/Oscillator ที่ใช้ในการวัดอัตราของการเปลี่ยนแปลงต่างๆในกระแสราคา (Currency Prices) ซึ่งมันจะทาการประเมินค่าความแตกต่างระหว่างราคาปิดของวันนี้ (Today’s Closing Price) และราคาปิด n วันที่ ผ่านมา โดยทั่วไปจะเป็นในช่วง 10 วันที่จะถูกใช้สาหรับการคานวณของตัวชี้วัดนี้ ซึ่งในกรณีของโมเมนตั้มนี้จะถูกคานวณ โดยการนาราคาปิดในปัจจุบันมาทาการลบกับราคาปิดสิบวันที่ผ่านมาและทาการพล็อตผลลัพธ์ไปรอบๆเส้นศูนย์ ซึ่งผลลัพธ์ ของการพล็อตนั้นสามารถที่จะเป็นลบได้เมื่อราคาในปัจจุบันนั้นต่ากว่าราคาเก่าสุดที่ผ่านมา หรือเป็นบวกก็ต่อเมื่อราคาใน ปัจจุบันนั้นมากกว่าราคาเก่าสุดที่ผ่านมา ก็จะเหมือนกับ MACD ที่ว่า Momentum นั้นยังคงสามารถที่จะใช้เป็นตัวชี้วัดในการติดตามเทรนใดๆได้ ซึ่ง สัญญาณซื้อจะเกิดขึ้นเมื่อตัวชี้วัดนั้นไปถึงล่างสุดของแนวโค้งลงและจากนั้นก็จะเริ่มปรับตัวขึ้นมา สัญญาณขายจะเกิดขึ้น เมื่อตัวชี้วัดนั้นไปถึงด้านบนสุดของแนวโค้งขึ้นและจากนั้นก็จะเริ่มปรับตัวลงมา ด้งตัวชี้วัดที่ผ่านมาที่มันสามารถที่จะใข้ได้ เมื่อความใกล้ของตลาดที่จะไปยังจุดสูงสุด/ต่าสุดที่จะตามมาด้วยการแกว่งตัวอย่างรุนแรงของตัวชี้วัดนั้นๆซึ่งจะตามมาด้วย การลดลงในค่าของตัวชี้วัดนั้นในขณะที่อัตราต่างๆนั้นก็ได้เริ่มที่จะขึ้น /ลง หรือเคลื่อนที่ในแนวระดับ อย่างในกรณีที่เกิด Divergence ขึ้นมานั่นเอง วิธีการใช้งาน: 1. เมื่อดัชนีชี้วัดนั้นไปถึงด้านล่างของแนวโค้งด้านล่างและเริ่มที่จะขึ้นนั่นเป็นสัญญาณซื้อ(Signal to buy) 2. เมื่อดัชนีชี้วัดนั้นไปถึงด้านบนของแนวโค้งด้านบนนั่นเป็นสัญญาณขาย(Signal to buy)
22.
การวิเคราะห์หุ้นทางเทคนิคด้วยโปรแกรม GCI Trader
SOLVER INSTUITUTE © 2008 Moving Average (ค่าเฉลี่ยเคลื่อนที่) ค่าเฉลี่ยเคลื่อนที่ (Moving Average (MA)) นั้นเป็นตัวบ่งชี้ (Indicator) ที่แสดงให้เห็นถึงราคาเฉลี่ยภายในช่วงเวลา ที่ได้กาหนดเอาไว้ ซึ่งมีอยู่ 4 ประเภทของค่าเฉลี่ยเคลื่อนที่: Simple MA, Exponential MA, Smoothed MA และ Weighted MA ซึ่งมันต่างกันในแต่อย่างเพียงแค่ในเทอมของน้าหนักของสัมประสิทธ์ (Weight Coefficients) ที่ได้กาหนดเอาไว้เป็น ข้อมูลล่าสุด ซึ่งค่าเฉลี่ยเคลื่อนที่นั้นโดยส่วนมากแล้วจะถูกใช้ในการกาหนดพื้นที่ของแนวรับ (Support) และแนวต้าน (Resistance) ในการที่จะให้ความสาคัญในด้านทิศทางของแนวโน้มหนึ่งๆและเพื่อความเรียบของความผันผวนของปริมาณ และราคา ซึ่งทิศทางของตัวชี้วัดนั้นก็จะแสดงออกมาไม่ว่าจะเป็นแนวโน้ม Bullish หรือ Bearish ที่เป็นปัจจุบันในตลาดนั้นๆ ชั่วขณะหนึ่ง ซึ่งการตัดกันของชาร์ทตัวชี้วัดและราคานั้นจะเป็นการยืนยันที่ว่าเป็นการเปลี่ยนแปลงของแนวโน้มหนึ่งๆ ซึ่งมัน ก็จะเป็นเพียงการยืนยันเพราะว่าการเปลี่ยนแปลงนั้นๆของตัวชี้วัดนี้ก็จะสายไปสาหรับการเปรียบเทียบกับการเปลี่ยนแปลง ของราคาหนึ่งๆได้ วิธีการใช้งาน: 1. เมื่อราคาสินค้าขึ้นไปสูงกว่า MA ของมัน นั่นเป็นสัญญาณซื้อ 2. เมื่อราคาหล่นไปอยู่ต่ากว่า MA ของมัน นั่นเป็นสัญญาณขาย 3. ทิศทางของ MA นั้นจะให้แนวความคิดไม่ว่าจะมีแนวโน้มBearish หรือแนวโน้ม Bullish ในตลาดหรือไม่ก็ตาม
23.
การวิเคราะห์หุ้นทางเทคนิคด้วยโปรแกรม GCI Trader
SOLVER INSTUITUTE © 2008 Parabolic SAR (พาราโบลิก เอสเออาร์) Parabolic SAR (stop-and-reversal) นั้นเป็นตัวชี้วัดที่ถูกใช้สาหรับการวิเคราะห์แนวโน้มของตลาด ซึ่งมันมีมากใน MA ทั่วไปแต่ไม่เหมือนกับ MA ที่ว่า Parabolic SAR นั้นจะเคลื่อนที่ด้วยความเร่งที่สูงและอาจที่จะเปลี่ยนตาแหน่งของมัน ในเทอมต่างๆของราคา ซึ่งนี่คือตัวชี้วัดในอุดมคคิสาหรับการให้จุดออกจากตลาด(Exit Points) ซึ่ง Parabolic SAR นั้นส่วนมากจะถูกใช้ในตลาดที่มีแนวโน้มสาหรับการสร้างการปิดออเดอร์(closing orders) และในการทาหยุดการซื้อขาย(Trailing stop order) ซึ่งมันก็ยังคงถูกใช้สาหรับการกาหนดเทรนนั้นๆ: ถ้าพาราโบลานั้นไป อยู่ที่ต่ากว่าเส้นราคา ตลาดก็จะกลายเป็นBullish แต่ถ้าพาราโบลานั้นไปอยู่หนือเส้นราคาตลาดนั้นก็จะเป็นBearish วิธีการใช้งาน: 1. ตาแหน่งที่ยาวควรที่จะถูกปิดไปเมื่อราคานั้นหล่นไปต่ากว่าเส้นSAR 2. ตาแหน่งที่สั้นควรที่จะถูกปิดไปเมื่อราคานั้นพุ่งสูงกว่าเส้นSAR ซึ่งในแต่ละจุดของการกาหนดSAR นั้นจะเป็นระดับของการทาStop-Order สาหรับช่วงการซื้อขายในปัจจุบันและช่วงการ ซื้อขายที่ไม่เป็น (วัน, ชั่วโมง, ฯลฯ) หมายเหตุที่ว่า: ตัวชี้วัดนั้นจะใช้ได้เพียงแค่สาหรับตลาดที่มีแนวโน้มเท่านั้น ซึ่งมันไม่เป็นประโยชน์ในเฟสที่เป็น Sideways Phrases ต่างๆ
24.
การวิเคราะห์หุ้นทางเทคนิคด้วยโปรแกรม GCI Trader
SOLVER INSTUITUTE © 2008 Relative Strength Index (ดัชนีความแข็งแกร่งสัมพัทธ์) Relative Strength Index (RSI) นั้นเป็นราคาหนึ่งๆที่ตามOscillator ที่มีระยะระหว่าง 0 ถึง 100 ซึ่งมีอยู่ 3 โซนที่มี ความโดยสิ้นเชิงในชาร์ทของตัวชี้วัดนี้: ทางโซนด้านบนนั้นจะเป็นระยะ(Overbought) จาก 70 ถึง 100 และโซนด้านล่างจะ เป็นระยะ (Oversold) จาก 0 ถึง 30 ซึ่งจะกลางเป็นระยะ 30 ถึง 70 โดยที่ค่า RSI นั้นส่วนมากจะถูกใช้ในการซื้อขายรายวัน(Day trading) ในการหาสถานะของตลาด ไม่ว่าจะมันจะ เป็น Oversold, Overbought หรือ Stable ถ้ายอดบนของ RSI นั้นอยู่ในโซนด้านบน(Upper zone) (Overbought, >70) และจากนั้นก็กลับไปยังโซนกลาง โดยที่ราคาก็อาจจะเคลื่อนไปในทิศทางเดียวกัน ถ้าด้านล่างของRSI นั้นอยู่ในโซนต่า (Oversold, <30) และจากนั้นก็จะกลับไปที่โซนกลาง โดยที่ราคาก็จะเคลื่อนที่ไปในทิศทางเดียวกัน วิธีการใช้งาน: 1. เมื่อยอดสูงสุดของ RSI นั้นอยู่ในโซน Overbought zone ราคาที่ถูกคาดไว้นั้นก็จะไปตามนั้น ซึ่งเป็นสัญญาณขาย 2. เมื่อยอดสูงสุดของ RSI นั้นอยู่ในโซน Oversold zone ราคาที่ถูกคาดเอาไว้ก็จะไปตามนั้น ซี่งเป็นสัญญาณซื้อ Divergence: เมื่อราคานั้นไปถึงจุดต่าสุด/สูงสุดใหม่แต่ยังไม่ได้รับการยืนยันจากค่าต่าสุด/สูงสุดใหม่แค่อย่างใด 3. บนชาร์ทค่า RSI ที่ Price Correction นั้นจะเกิดขึ้นตามทิศทางของRSI นั้นๆ หมายเหตุ: ในชาร์ท RSI นั้นระดับแนวรับ/แนวต้าน และรูปแบบ Reversal Patterns นั้นบางครั้งเห็นได้อย่างชัดเจนกว่าใน ชาร์ทราคา
25.
การวิเคราะห์หุ้นทางเทคนิคด้วยโปรแกรม GCI Trader
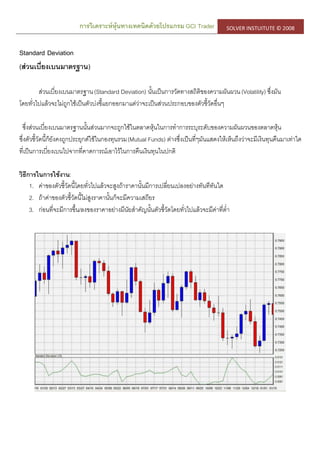
SOLVER INSTUITUTE © 2008 Standard Deviation (ส่วนเบี่ยงเบนมาตรฐาน) ส่วนเบี่ยงเบนมาตรฐาน(Standard Deviation) นั้นเป็นการวัดทางสถิติของความผันผวน(Volatility) ซึ่งมัน โดยทั่วไปแล้วจะไม่ถูกใช้เป็นตัวบ่งชี้แยกออกมาแต่ว่าจะเป็นส่วนประกอบของตัวชี้วัดอื่นๆ ซึ่งส่วนเบี่ยงเบนมาตรฐานนั้นส่วนมากจะถูกใช้ในตลาดหุ้นในการทาการระบุระดับของความผันผวนของตลาดหุ้น ซึ่งตัวชี้วัดนี้ก็ยังคงถูกประยุกต์ใช้ในกองทุนรวม(Mutual Funds) ต่างซึ่งเป็นที่ๆมันแสดงให้เห็นถึงว่าจะมีเงินทุนคืนมาเท่าใด ที่เป็นการเบี่ยงเบนไปจากที่คาดการณ์เอาไว้ในการคืนเงินทุนในปกติ วิธีการในการใช้งาน: 1. ค่าของตัวชี้วัดนี้โดยทั่วไปแล้วจะสูงถ้าราคานั้นมีการเปลี่ยนเปลงอย่างทันทีทันใด 2. ถ้าค่าของตัวชี้วัดนี้ไม่สูงราคานั้นก็จะมีความเสถียร 3. ก่อนที่จะมีการขึ้น/ลงของราคาอย่างมีนัยสาคัญนั้นตัวชี้วัดโดยทั่วไปแล้วจะมีค่าที่ต่า
26.
การวิเคราะห์หุ้นทางเทคนิคด้วยโปรแกรม GCI Trader
SOLVER INSTUITUTE © 2008 Stochastic (สโตเคสติค) ตัวชี้วัด Stochastic นั้นเป็น Oscillator ที่ใช้ในการเปรียบเทียบที่ๆราคาสินทรัพย์ (Asset’s Price) นั้นปิดสัมพันธ์กับ ระยะราคาของมันไปเหนือระยะเวลาที่ให้ ซึ่งมันจะประกอบไปด้วยเส้นสองเส้น: เส้นหลักเรียกว่า %K (สีเขียว) และเส้นรอง เรียกว่า %D (สี Navy) ซึ่งในเส้นหลัก (%K) ความผันผวนต่างๆโดยทั่วไปนั้นจะมีความชัดเจนมากกว่าในเส้นรอง (%D) เพราะว่า %D นั้นเป็นเส้นค่าเฉลี่ยเคลื่อนที่ (Moving Average) ของเส้น %K ซึ่ง Stochastic Indicator นั้นได้ทาการวัดใน สเกลจาก 0% ไปจนถึง 100% โดยที่ Stochastic Oscillator นั้นส่วนมากจะถูกใช้ในตลาดที่มีแนวโน้ม ถ้าทั้งเส้น (%D และ %K) นั้นอยู่ด้านบน ของโซนบน (Upper zone) (เหนือเส้นกากับ 80%) และจากนั้นตัวชี้วัดก็กลับมายังโซนกลาง (Middle zone) ซึ่งอัตรานั้นๆก็ จะเคลื่อนไปในทิศทางเดียวกัน ถ้าทั้งสองเส้นอยู่ที่ด้านล่างอยู่ในโซนต่า (Lower zone) (ต่ากว่า 20%) และจากนั้นตัวชี้วัดก็ จะกลับมายังโซนกลาง (Middle zone) ซึ่งอัตราก็จะเคลื่อนไปในทิศทางเดียวกัน วิธีการใช้งาน: เมื่อเส้นหนึ่งๆของ Stochastic หล่นไปอยู่ต่ากว่า 20% และจากนั้นขึ้นไปอยู่เหนือระดับ (A) หรือเมื่อเส้น %K 1. นั้นขึ้นไปเหนือเส้น %D เส้น (B) มันก็เป็นสัญญาณซื้อ เมื่อเส้นหนึ่งๆของ Stochastic นั้นขึ้นไปเหนือ 80% และจากนั้นก็หลนลงมาใต้ระดับ (C) หรือขายเมื่อเส้น %K 2. นั้นหล่นต่ากว่าเส้น %D ซึ่งมันเป็นสัญญาณขาย Divergence: ถ้าอัตราในการสร้างอนุกรมของค่าต่าสุด/สูงสุดใหม่และ Oscillator นั้นไม่จากนั้นบางอัตรา 3. ถ้าความถูกต้อง (Correction) นั้นเป็นไปได้ในทิศทางของการเคลื่อนที่ของ Oscillator’s Movement
27.
การวิเคราะห์หุ้นทางเทคนิคด้วยโปรแกรม GCI Trader
SOLVER INSTUITUTE © 2008 Williams' Percent Range (วิเลียมเปอร์เซ็นต์เร้น) Williams' Percent Range (Williams %R, หรือ %R) เป็นตัวชี้วัดทางโมเมนตั้ม (Momentum Indicator) ที่ทาการ วัดระดับแรงซื้อมากเกินไป (Overbought) และระดับแรงขายมากเกินไป (Oversold) ที่แกว่งขึ้นๆลงๆระหว่าง 0 และ -100% เมื่อค่าไปถึง 0% มันก็จะหมายความว่าราคาปิดนั้นดูเหมือนว่าจะสูงไป ในทางกลับกันเมื่อค่าไปถึง -100 % มันหมายความ ว่าราคาปิดนั้นถือได้ว่าต่าไป โดยที่ค่า Williams %R นั้นโดยส่วนมากจะถูกใช้เป็นการบอกใบ้ถึงเงื่อนไขของตลาดในตลาดในการซื้อขายใดๆ ซึ่ง มันจะแสดงให้เห็นถึงการหันกลับของราคาสินค้าที่สาคัญแฝงอยู่ บ่อยครั้งที่ตัวชี้วัดนี้จะไปถึงจุดสูงสุดและจะหันกลับลงมา เล็กน้อยก่อนหน้าราคาสินค้านั้นๆ ก็เหมือนกับว่า %R จะไปถึงจุดต่าสุดและจะหันกลับขึ้นไปเล็กน้อยก่อนหน้าราคาสินค้า นั้นๆนั่นเอง วิธีการใช้งาน: 1. ถ้าค่าอ่านได้ใน ระยะ 0 ถึง -20 %: ตลาดนั้นมีแรงซื้อมากเกินไป (Overbought) ซึ่งมันสามารถถือได้ว่าเป็น สัญญาณขาย 2. ถ้าค่าอ่านได้ใน ระยะ -80 ถึง -100%: ตลาดนั้นมีแรงขายมากเกินไป (Oversold) ซึ่งมันสามารถถือได้ว่าเป็น สัญญาณซื้อ
28.
การวิเคราะห์หุ้นทางเทคนิคด้วยโปรแกรม GCI Trader
SOLVER INSTUITUTE © 2008 Note: แนะนาให้รอดูตัวชี้วัดทางราคาในการเปลี่ยนทิศทางก่อนที่จะทาการตัดสินใจทาการซื้อขายใดๆ อ้างอิง http://help.sysfx.com/documents/traders_manual/en_US/ “การลงทุนในความรู้คือการลงทุนที่คุ้มค่า” ท่านผู้สนใจสามารถเข้ารับอบรมกรวิเคราะห์การลงทุนขั้นสูง กับเราได้ที่ www.solverenterprise.com Tel.055341081, 0851188440 (ติดต่อ อ.นราธิป จารัส)
29.
การวิเคราะห์หุ้นทางเทคนิคด้วยโปรแกรม GCI Trader
SOLVER INSTUITUTE © 2008
30.
การวิเคราะห์หุ้นทางเทคนิคด้วยโปรแกรม GCI Trader
SOLVER INSTUITUTE © 2008
Download