Downloaded 35 times
![Setup #3: VVIX
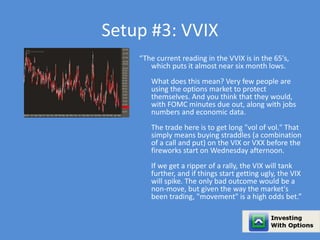
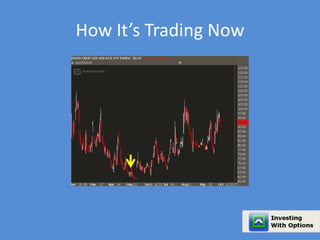
“Is it really that quiet out there?
You would think that the market would be a
little more scared, that investors would be
buying protection as we head into the summer.
But that’s not what we’re seeing.
The traditional "fear" index is the VIX, which
measures the supply and demand for SPX
options. With a reading of 13.71, it puts it in
towards the lower end of its six month trading
range.
But let's go down the rabbit hole just a little
more.
The VVIX measures the supply and demand for
VIX. I feel that this chart is just as important as
the VIX because investors are not just using SPX
puts to get protection-- they're now using VIX
calls. [continued…]”](https://image.slidesharecdn.com/traderplanet-140930200933-phpapp02/85/A-Look-Back-at-11-Stock-Trading-Setups-15-320.jpg)
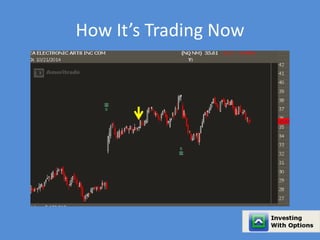
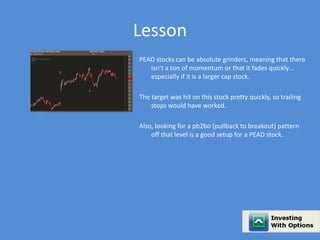
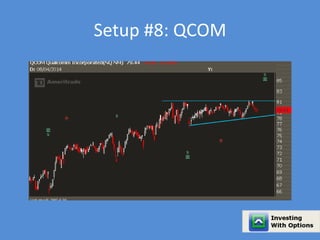
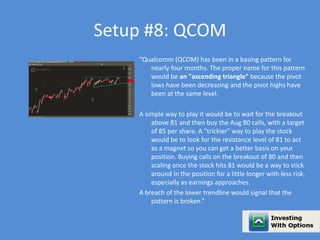


The document discusses 11 stock trading setups shared on TraderPlanet.com, detailing the reasoning and trading strategies behind each setup. Each trade includes discussion of current market conditions, technical patterns, and insights for traders. Key focus points include breakout levels, volatility, and utilizing options strategies in response to earnings and market movements.


