More Related Content

PDF
13.โครงสร้างตลาด เพจ กัปตัน เทรดดิ้ง.pdf 
PPT

DOCX
15.บันทึกการเทรดกัปตัน เทรดดิ้ง.docx 
PDF
ตำราวิเคราะห์แท่งเทียนที่ดีที่สุด Candle stick pattern 
PDF
8.Price Structure เพจ กัปตัน เทรดดิ้ง.pdf 
PDF
หุ้นซิ่ง (รวบรวมเนื้อหาเกี่ยวกับหุ้นซิ่งจากอินเตอร์เน็ท) 
PDF

PDF
10.Price_Action เพจ กัปตัน เทรดดิ้ง.pdf What's hot

PDF
Ebooksint ทฤษฎีผลประโยชน์ และกลยุทธ์การเก็งกำไรตามแนวโน้ม -_แมงเม่าคลับ 
PDF
1.Demand Supply 2023 เพจ กัปตัน เทรดดิ้ง.pdf 
PDF
14.Read The Market เพจ กัปตัน เทรดดิ้ง.pdf 
PDF
01 Market Structure_watermark.pdf 
PDF
4.Demand Supply 2021 เพจ กัปตัน เทรดดิ้ง.pdf 
PPT
Chapter 7 trend line แค่ลากเป็นก็ทำกำไรได้แล้ว 
PDF
9.Dow Theory เพจ กัปตัน เทรดดิ้ง.pdf 
PPT
Chapter 1 มองแนวโน้มให้ออกก่อน 
PDF
3.รวม Chart pattern เพจ กัปตัน เทรดดิ้ง.pdf 
PDF
7.Harmonic เพจ กัปตัน เทรดดิ้ง.pdf 
PDF
11.วิธีสร้างระบบเทรด เพจ กัปตัน เทรดดิ้ง.pdf 
PDF
การวิเคราะห์ทางเทคนิค อ.นราธิป 
PDF
12.Multi Factors เพจ กัปตัน เทรดดิ้ง.pdf 
PDF
ทำไมเทรดโดยใช้ Indicator จึงไม่ประสบความสำเร็จ 
PDF
5.Support _ Resistance เพจ กัปตัน เทรดดิ้ง.pdf 
PPT
Chapter 2 รู้แนวรับแนวต้าน 
PDF
จัดพอร์ทหุ้นด้วยเทคนิค Momentum ![SMC DnS QM - Free Knowledge [Forex Library].pdf](https://cdn.slidesharecdn.com/ss_thumbnails/smcdnsqm-freeknowledgeforexlibrary-231207025705-39a3cbb2-thumbnail.jpg?width=640&height=640&fit=bounds)
PDF
SMC DnS QM - Free Knowledge [Forex Library].pdf 
PPT
Chapter 6 โจมตีด้วยกลยุทธ์ 1 2-3-4 
PPS
Similar to Chapter 5 เครื่องมือช่วยยืนยัน

PDF
Fibonacci Trading for DW Traders 
PDF

PDF
Technical วุฒิชัย อินทร์สว่าง 
PPTX
Tradingview on demand for investment in all 
PDF
Set+technical+update+besic 
PDF
10 รูปแบบกราฟที่เทรดเดอร์ทุกคนควรรู้ Deriv.com 
PDF
Macd professional_Thailand 
PDF

PPTX
พิชิตหุ้นด้วยการวิเคราะห์ปัจจัยพื้นฐาน และเทคนิค 
PPTX
Financial forecasting by time series 55660701 
PPT
เรียนอ่านกราฟทางเทคนิคเบื้องต้น 
PDF
Ebooksint จัดพอร์ตเชิงรุกด้วยกลยุทธ์แบบ momentum trading 
PPT

PDF

PDF
Intersection_Bollinger+SMA 
PDF

PDF

PPT
Technical Analysis Basic with KGI Thailand. 
PDF

PPTX
พิชิตหุ้นด้วย "ปัจจัยพื้นฐาน" และ "ปัจจัยทางเทคนิค" More from Akarawat Thanachitnawarat

PDF

PDF
กูรูหุ้นพันล้าน วิชัย วชิรพงศ์ 
PDF
The 3 duck's trading system. 
PDF
Elliot wave thai by Kitty version 
PDF

PDF

PPT
Chapter 3 ฝึกลากรูปแบบต่างๆ Chapter 5 เครื่องมือช่วยยืนยัน
- 1.
- 2.
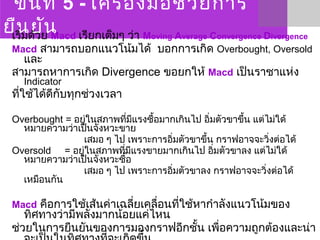
ขั้นที่ 5 -เครื่องมือช่วยการ
ยืนยันเริ่มด้วย Macd เรียกเต็มๆ ว่า Moving Average Convergence Divergence
Macd สามารถบอกแนวโน้มได้ บอกการเกิด Overbought, Oversold
และ
สามารถหาการเกิด Divergence ขอยกให้ Macd เป็นราชาแห่ง
Indicator
ที่ใช้ได้ดีกับทุกช่วงเวลา
Overbought = อยู่ในสภาพที่มีแรงซื้อมากเกินไป อิ่มตัวขาขึ้น แต่ไม่ใด้
หมายความว่าเป็นจังหวะขาย
เสมอ ๆ ไป เพราะการอิ่มตัวขาขึ้น กราฟอาจจะวิ่งต่อได้
Oversold = อยู่ในสภาพที่มีแรงขายมากเกินไป อิ่มตัวขาลง แต่ไม่ใด้
หมายความว่าเป็นจังหวะซื้อ
เสมอ ๆ ไป เพราะการอิ่มตัวขาลง กราฟอาจจะวิ่งต่อได้
เหมือนกัน
Macd คือการใช้เส้นค่าเฉลี่ยเคลื่อนที่ใช้หากำาลังแนวโน้มของ
ทิศทางว่ามีพลังมากน้อยแค่ไหน
ช่วยในการยืนยันของการมองกราฟอีกชั้น เพื่อความถูกต้องและน่า
- 3.
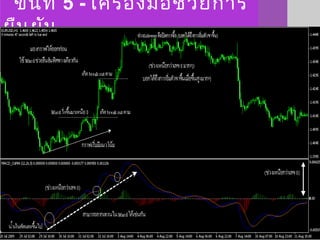
ขั้นที่ 5 -เครื่องมือช่วยการ
ยืนยันการบอกสัญญาณของ Macd (ต่อ)
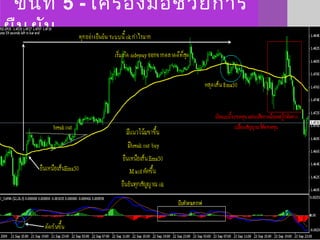
• สัญญาณที่บอก ซื้อ ที่ชัดเจนขึ้น เมื่อเส้น Macd (นำ้าเงินตัดแดงขึ้น) อยู่
ตำ่ากว่า 0 แล้ววิ่งขึ้นเหนือ 0 ขึ้นไปได้ เป็นสัญญาณที่บอกการซื้อชัดเจน
ขึ้น
• สัญญาณที่บอก ขาย ที่ชัดเจนขึ้น เมื่อเส้น Macd (นำ้าเงินตัดแดงลง) อยู่
เหนือ 0 แล้ววิ่งลงตำ่ากว่า 0 ลงมาไปได้ เป็นสัญญาณที่บอกการขาย
ชัดเจนขึ้น
ข้อเสียของ Macd
• บางครั้งจะให้สัญญาณช้าไป
• ไม่เหมาะกับช่วงเกิด Sideway
• บางครั้งจะเกิดสัญญาณหลอกเกิดขึ้น ดังนั้นอย่าใช้ Indicator นำาการ
เข้าเทรด ซื้อขาย เด็ดขาด (สัญญาณหลอกมีเยอะ)
วิธีใช้ Macd
• ให้มองกราฟเป็นตัวนำาเสมอ ๆ
• Macd (เป็นตัวรองเสมอ ๆ) เป็นตัวช่วยตรวจสอบและยืนยันทิศทางที่ถูก
- 4.
- 5.
- 6.
- 7.
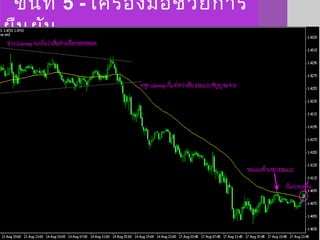
ขั้นที่ 5 -เครื่องมือช่วยการ
ยืนยันDivergence เกิดจากการขัดแย้งกันระหว่างราคาในกราฟและ
Indicator เครื่องมือที่
เหมาะกับการดู Divergence มักนิยมใช้ Macd , RSI ส่วน stochastic
ดูได้
เช่นกันแต่มักจะให้สัญญาณหลอกเยอะเกินไป
Bullish Divergence และ Bearish Divergence
Bullish Divergence เกิดจากราคาใน
กราฟยังลงต่อ แต่ Macd มีทิศทางขึ้น
เริ่มเกิด
ขัดแย้งกัน ซึ่งเป็นสัญญาณบอกได้ถึง
ราคาในกราฟ
จบขาลง และเตรียมกลับทิศเป็นแนวโน้ม
ขาขึ้น
(เรียกง่ายๆ ว่าเริ่มมีสัญญาณแนวโน้ม
ขาขึ้นรอบใหม่)
Bullish Divergence เกิดจากราคาใน
กราฟยังลงต่อ แต่ Macd มีทิศทางขึ้น
เริ่มเกิด
ขัดแย้งกัน ซึ่งเป็นสัญญาณบอกได้ถึง
ราคาในกราฟ
จบขาลง และเตรียมกลับทิศเป็นแนวโน้ม
ขาขึ้น
(เรียกง่ายๆ ว่าเริ่มมีสัญญาณแนวโน้ม
ขาขึ้นรอบใหม่)
Bearish Divergence เกิดจากราคาใน
กราฟยังขึ้นต่อ แต่ Macd มีทิศทางลง
เริ่มเกิดขัด
แย้งกันซึ่งเป็นสัญญาณบอกได้ถึงราคา
ในกราฟจบขาขึ้น
และเตรียมกลับทิศเป็นแนวโน้มขาลง
(เรียกง่ายๆ ว่าเริ่ม
มีสัญญาณแนวโน้มขาลงรอบใหม่)
Bearish Divergence เกิดจากราคาใน
กราฟยังขึ้นต่อ แต่ Macd มีทิศทางลง
เริ่มเกิดขัด
แย้งกันซึ่งเป็นสัญญาณบอกได้ถึงราคา
ในกราฟจบขาขึ้น
และเตรียมกลับทิศเป็นแนวโน้มขาลง
(เรียกง่ายๆ ว่าเริ่ม
มีสัญญาณแนวโน้มขาลงรอบใหม่)
- 8.
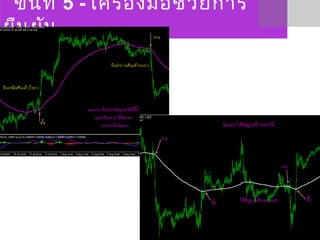
Hidden Bullish Divergence
เกิดจากราคาในกราฟเริ่มมีแนวโน้ม
จากตำ่าไปสูงใหม่
(higherlow) แต่ Macd มีทิศทางลง
แล้ว
ลงต่อ (lower low) เริ่มขัดแย้งกัน ซึ่ง
เป็น
สัญญาณบอกแนวโน้มของกราฟขึ้น
ต่อ (เรียกง่ายๆ ว่า
เริ่มมีสัญญาณแนวโน้มขาขึ้นรอบ
ใหม่)
Hidden Bullish Divergence
เกิดจากราคาในกราฟเริ่มมีแนวโน้ม
จากตำ่าไปสูงใหม่
(higher low) แต่ Macd มีทิศทางลง
แล้ว
ลงต่อ (lower low) เริ่มขัดแย้งกัน ซึ่ง
เป็น
สัญญาณบอกแนวโน้มของกราฟขึ้น
ต่อ (เรียกง่ายๆ ว่า
เริ่มมีสัญญาณแนวโน้มขาขึ้นรอบ
ใหม่)
ขั้นที่ 5 - เครื่องมือช่วยการ
ยืนยัน Hidden Bearish Divergence
เกิดจากราคาในกราฟเริ่มมีแนวโน้ม
จากสูงไปตำ่าใหม่
(lower high) แต่ Macd มีทิศทางขึ้น
แล้ว
ขึ้นต่อ (higher high) เริ่มขัดแย้งกัน
ซึ่งเป็น
สัญญาณบอกแนวโน้มของกราฟลงต่อ
(เรียกง่ายๆ ว่า
เริ่มมีสัญญาณแนวโน้มขาลงรอบใหม่)
Hidden Bearish Divergence
เกิดจากราคาในกราฟเริ่มมีแนวโน้ม
จากสูงไปตำ่าใหม่
(lower high) แต่ Macd มีทิศทางขึ้น
แล้ว
ขึ้นต่อ (higher high) เริ่มขัดแย้งกัน
ซึ่งเป็น
สัญญาณบอกแนวโน้มของกราฟลงต่อ
(เรียกง่ายๆ ว่า
เริ่มมีสัญญาณแนวโน้มขาลงรอบใหม่)
Hidden Bullish Divergence และ Hidden Bearish Divergence
สองแบบนี้ บอกถึงการวิ่งไปต่อของแนวโน้ม price follow
- 9.
ขั้นที่ 5 -เครื่องมือช่วยการ
ยืนยันข้อเสียของ Divergence
บางครั้งจะเกิดการหลอก (false) บ่อยเช่นกัน ไม่ควรใช้เป็นสัญญาณเข้า
เทรดซื้อขาย (ควรดู
แนวโน้ม ยืนยันความถูกต้องก่อน)
หลักการใช้
• ควรดูแนวโน้มของกราฟให้ออกก่อนว่าเป็นทิศทางเดียวกันกับการเกิด
Divergence เพื่อยืนยันความถูกต้อง (ไม่โดนหลอก)
• การเกิด double top or double bottom ในกราฟหรือใน Indicators
ถือว่าเป็นการเกิดสัญญาณ Divergence เช่นกัน ดูสัญญาณตามรูปใน
ภาพน่าจะมองง่าย
การเกิด Bullish Divergence และ Bearish Divergence มักจะเกิดให้
เห็นเสมอ ๆ ในทุก ๆ ช่วงเวลา บอกได้ถึงการกลับตัวมามีแนวโน้มครั้ง
ใหม่อีกครั้งแต่เพื่อความมั่นใจ
ในความถูกต้องควรใช้เครื่องมืออย่างอื่นช่วยยืนยันด้วย จะได้ไม่โดน
- 10.
- 11.
- 12.
- 13.
- 14.
- 15.
- 16.
ขั้นที่ 5 -เครื่องมือช่วยการ
ยืนยัน
RSI เรียกเต็มๆว่า Relative Strength Index เป็นเครื่องมือบอก
ถึงความแข็งแกร่งและบอกการเกิดแนวโน้ม บอกการเกิด Overbought
(อิ่มตัวขาขึ้น), Oversold (อิ่มตัวขาลง) บอกการเกิด Divergence
ได้เช่นกัน RSI เป็นอีกหนึ่งเครื่องมือที่นิยมใช้กันมากเช่นกัน โดยจะ
แนะนำาให้ใช้ค่าเดิม RSI (14)
การดูเส้น RSI ดูที่ระดับ 30 กับ 70
ตำ่ากว่าเส้น 30 คืออยู่ในเขต Oversold ช่วงอิ่มตัวขาลงเป็นช่วง
แรงขายมาก แต่บางครั้งถ้าเทรนแนวโน้มยังคงเป็นขาลงก็ยังไม่
สามารถซื้อได้ถ้าเทรนยังลงอยู่
เหนือกว่าเส้น 70 คืออยู่ในเขต Overbought ช่วงอิ่มตัวขาขึ้น
เป็นช่วงแรงซื้อมาก แต่บางครั้งถ้าเทรนแนวโน้มยังคงเป็นขาขึ้นก็ยัง
ไม่สามารถขายได้ถ้าเทรนยังขึ้นอยู่
วิธีใช้ RSI
ให้มอง กราฟเป็นตัวนำาเสมอๆ คือมองแนวโน้มให้ออกก่อน (ไม่ควรใช้
ตอน Sideway)
RSI (เป็นตัวรองเสมอๆ) แค่เป็นตัวช่วยตรวจสอบและยืนยันทิศทางที่ถูก
ต้อง ควรมองกราฟให้ออกก่อนว่าแนวโน้มไปทิศทางเดียวกับ RSI ถึงจะ
- 17.
ขั้นที่ 5 -เครื่องมือช่วยการ
ยืนยันข้อเสียของ RSI
ไม่เหมาะกับช่วงเกิด Sideway
บางครั้งจะเกิดสัญญาณหลอกเกิดขึ้น อย่าใช้ Indicator นำาการเข้า
เทรดซื้อขายเด็ดขาด (สัญญาณหลอกมีเยอะ)
ดูตัวอย่างของการใช้ RSI และการเกิด divergence
- 18.
- 19.
ขั้นที่ 5 -เครื่องมือช่วยการ
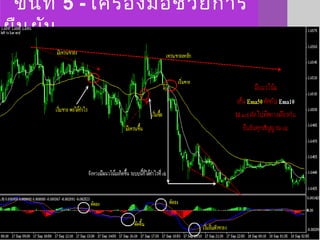
ยืนยันMoving Averages เส้นค่าเฉลี่ยเคลื่อนที่
โดยจะแนะนำา EMA เรียกว่า Exponential Moving Average
โดยเส้น EMA50 ผู้ใช้ได้ทดลองใช้แล้วคิดว่าลงตัวและใช้ได้ดี (ส่วน
ใครอยากทดลองใช้เส้นค่าเฉลี่ยอื่นๆ ก็ได้เช่นกัน โดยมองด้วยตาแล้ว
คิดว่าลงตัวและเหมาะกับนิสัยที่เราเทรด)
เส้นค่าเฉลี่ยสามารถบอกได้ถึง จุดซื้อ จุดขายของการยืนเหนือเส้นและ
ใต้เส้น และการตัดกันของ เส้นค่าเฉลี่ยสองเส้นบอกการซื้อและขาย
สามารถบอกได้ถึงแนวรับ แนวต้าน เมื่อวิ่งมาชนเส้นค่า เฉลี่ยเคลื่อนที่
วิธีใช้ กราฟราคายืนเหนือเส้น EMA50 Buy
กราฟราคายืนใต้เส้น EMA50 Sell
ช่วงเกิด Sideway เส้น Ema50 จะเกิดการหลอก (งดดูช่วงนี้) ควร
มองแนวโน้มให้ออกก่อนแล้วจึงใช้ Ema50 ยืนยัน
ข้อเสีย
ยังคงมีสัญญาณหลอกเยอะเช่นกันไม่ควรใช้เป็นตัวนำา ควรใช้เป็นตัว
รองช่วยการยืนยันความถูกต้อง จะดีกว่า
- 20.
- 21.
- 22.
- 23.
ขั้นที่ 5 -เครื่องมือช่วยการ
ยืนยันจากการใช้เส้น EMA 50 เส้นเดียว
เพื่อการซื้อ การขายที่ถูกต้องมากขึ้น จะเพิ่มเส้น EMA 10 (ให้
สัญญาณเร็วขึ้น)
โดยเส้น EMA 10 ตัด EMA 50 ขึ้นได้คือสัญญาณ ซื้อ
EMA 10 ตัด EMA 50 ลงได้คือสัญญาณ ขาย
ข้อเสีย
มีสัญญาณหลอกช่วง Sideway เยอะเช่นกัน
ควรมองแนวโน้มให้ออกก่อนแล้วจึงใช้เส้นค่าเฉลี่ยยืนยันความถูกต้อง
(สามารถใช้เส้นค่าเฉลี่ยอื่นๆ ได้เช่นกัน ต้องทดสอบดูว่าเหมาะกับนิสัย
เราแบบไหนในการเข้าเทรด)
- 24.
- 25.
- 26.
ขั้นที่ 5 -เครื่องมือช่วยการ
ยืนยัน
ดูระดับเส้นค่าเฉลี่ย EMA
เริ่มจากระดับ EMA 5 10 15 20 เป็นเส้นระยะสั้น
ไม่เหมาะกับการใช้โดดเดี่ยวเพราะสัญญาณหลอกจะเยอะครับ
เหมาะกับไว้ใช้เส้นตัดการขึ้นลง ของเส้นระยะกลางและระยะยาว
มากกว่า เพื่อหาการจังหวะเข้าซื้อขาย
ระดับ 50 75 100 เส้นระดับกลาง
ใช้ได้ดีจุดหลอกจะน้อยลง ดูแนวรับแนวต้านได้เช่นกัน ใช้เส้นเดียว
ก็ได้ยืนเหนือเส้น ซื้อ ตำ่ากว่าเส้น ขาย และเหมาะกับการใช้เส้นระยะสั้น
ผสม เพื่อยืนยันการซื้อขาย
ระดับ 150 200 เส้นระยะยาว
เหมาะกับการดูเป็นแนวรับ แนวต้านที่แข็งแรงมากกว่าและเหมาะกับ
เส้นเดียวเพื่อเล่นระยะยาว ยืนเหนือเส้น ซื้อ ตำ่ากว่าเส้น ขาย และไว้ตัด
กับเส้นระยะสั้นเพื่อช่วยยืนยันได้
เมื่อรู้แล้วว่า เส้นค่าเฉลี่ยจากน้อยไปมาก แบบไหนเหมาะกับเราก็
สามารถเอามาต่อยอดกับระบบเราได้ โดยใช้เส้นค่าเฉลี่ยเป็นตัวช่วย
- 27.
ขั้นที่ 5 -เครื่องมือช่วยการ
ยืนยันข้อเสียของเส้นค่าเฉลี่ยคือหากเทรดในช่วง sideway อาจจะเสียหาย
ข้อดีคือเมื่อเราเลือกเส้นได้เหมาะสมกับค่าเงินสกุลนั้นๆ เมื่อถูกทางจะ
กำาไรสูง
(ได้เป็นรอบๆ ของการจบการขึ้น การลง)
ดูตามตัวอย่างในรูปครับ
- 28.
- 29.
- 30.
- 31.
- 32.
ขั้นที่ 5 -เครื่องมือช่วยการ
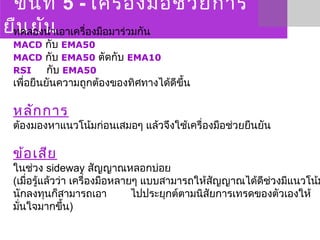
ยืนยันทดลองนำาเอาเครื่องมือมาร่วมกัน
MACD กับ EMA50
MACD กับ EMA50 ตัดกับ EMA10
RSI กับ EMA50
เพื่อยืนยันความถูกต้องของทิศทางได้ดีขึ้น
หลักการ
ต้องมองหาแนวโน้มก่อนเสมอๆ แล้วจึงใช้เครื่องมือช่วยยืนยัน
ข้อเสีย
ในช่วง sideway สัญญาณหลอกบ่อย
(เมื่อรู้แล้วว่า เครื่องมือหลายๆ แบบสามารถให้สัญญาณได้ดีช่วงมีแนวโน้ม
นักลงทุนก็สามารถเอา ไปประยุกต์ตามนิสัยการเทรดของตัวเองให้
มั่นใจมากขึ้น)
- 33.
- 34.
- 35.
- 36.
ขั้นที่ 5 -เครื่องมือช่วยการ
ยืนยันเริ่มต่อยอดโดย RSI เส้นเดียว เราจะเพิ่มลูกเล่นโดยการใส่เส้น EMA
เข้าไปเพิ่มเพื่อช่วยยืนยันการขึ้น การลง
โดย เส้น RSI ตัดเส้น EMA ขึ้นไปคือสัญญาณ ซื้อ
เส้น RSI ตัดเส้น EMA ลงมาคือสัญญาณ ขาย
โดยก็ต้องมองพื้นฐานด้วยเช่นกัน
ว่าแนวโน้มเป็นยังไง เดินทิศทาง
เดียวกับ เครื่องมือนี้รึเปล่าเพื่อ
ยืนยันการถูกต้อง
จุดอ่อน ของเครื่องมือนี้คือ
การ sideway
- 37.
- 38.
- 39.
ขั้นที่ 5 -เครื่องมือช่วยการ
ยืนยัน
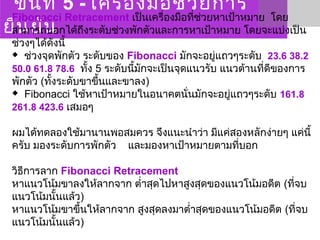
Fibonacci Retracement เป็นเครื่องมือที่ช่วยหาเป้าหมาย โดย
สามารถบอกได้ถึงระดับช่วงพักตัวและการหาเป้าหมาย โดยจะแบ่งเป็น
ช่วงๆได้ดังนี้
ช่วงจุดพักตัว ระดับของ Fibonacci มักจะอยู่แถวๆระดับ 23.6 38.2
50.0 61.8 78.6 ทั้ง 5 ระดับนี้มักจะเป็นจุดแนวรับ แนวต้านที่ดีของการ
พักตัว (ทั้งระดับขาขึ้นและขาลง)
Fibonacci ใช้หาเป้าหมายในอนาคตนั่นมักจะอยู่แถวๆระดับ 161.8
261.8 423.6 เสมอๆ
ผมได้ทดลองใช้มานานพอสมควร จึงแนะนำาว่า มีแค่สองหลักง่ายๆ แค่นี้
ครับ มองระดับการพักตัว และมองหาเป้าหมายตามที่บอก
วิธีการลาก Fibonacci Retracement
หาแนวโน้มขาลงให้ลากจาก ตำ่าสุดไปหาสูงสุดของแนวโน้มอดีต (ที่จบ
แนวโน้มนั้นแล้ว)
หาแนวโน้มขาขึ้นให้ลากจาก สูงสุดลงมาตำ่าสุดของแนวโน้มอดีต (ที่จบ
แนวโน้มนั้นแล้ว)
- 40.
- 41.
- 42.
- 43.
- 44.
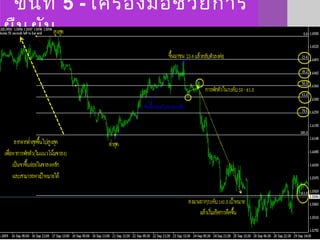
ขั้นที่ 5 -เครื่องมือช่วยการ
ยืนยันการลากเมื่อพักตัวในระดับ 23.6 38.2 50.0 61.8 78.6 เป็นระดับ
ทดสอบ เมื่อผ่านไปได้ก็จะสามารถเห็นเป้าหมายที่ระดับ 161.8
การพักตัวของแนวโน้มนั้นๆ บอกได้ถึงการพักตัว (สะสมแรง) แล้ว
ดีดไปต่อ
ดูตัวอย่างจาก 3 รูปนี้ครับ
- 45.
- 46.
- 47.
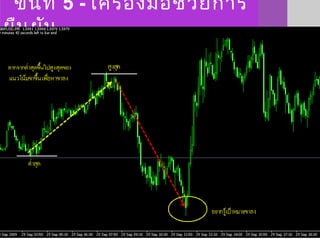
ขั้นที่ 5 -เครื่องมือช่วยการ
ยืนยันรพักตัวและเป้าหมายขาขึ้น
คือ ต้องรอให้กราฟราคาหลุดแนวโน้มรอบนั้นๆ ก่อนถึงจะเริ่มลากเพื่อหาเป้าห
ครับ เป็นรูปเดียวกันหมด
- 48.
- 49.
- 50.
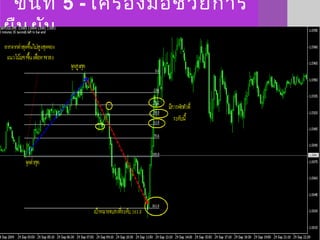
ขั้นที่ 5 -เครื่องมือช่วยการ
ยืนยันารพักตัวและเป้าหมายขาลง
คือ ต้องรอให้กราฟราคาหลุดแนวโน้มรอบนั้นๆ ก่อนถึงจะเริ่มลากเพื่อหาเป้าห
ครับ เป็นรูปเดียวกันหมด
- 51.
- 52.