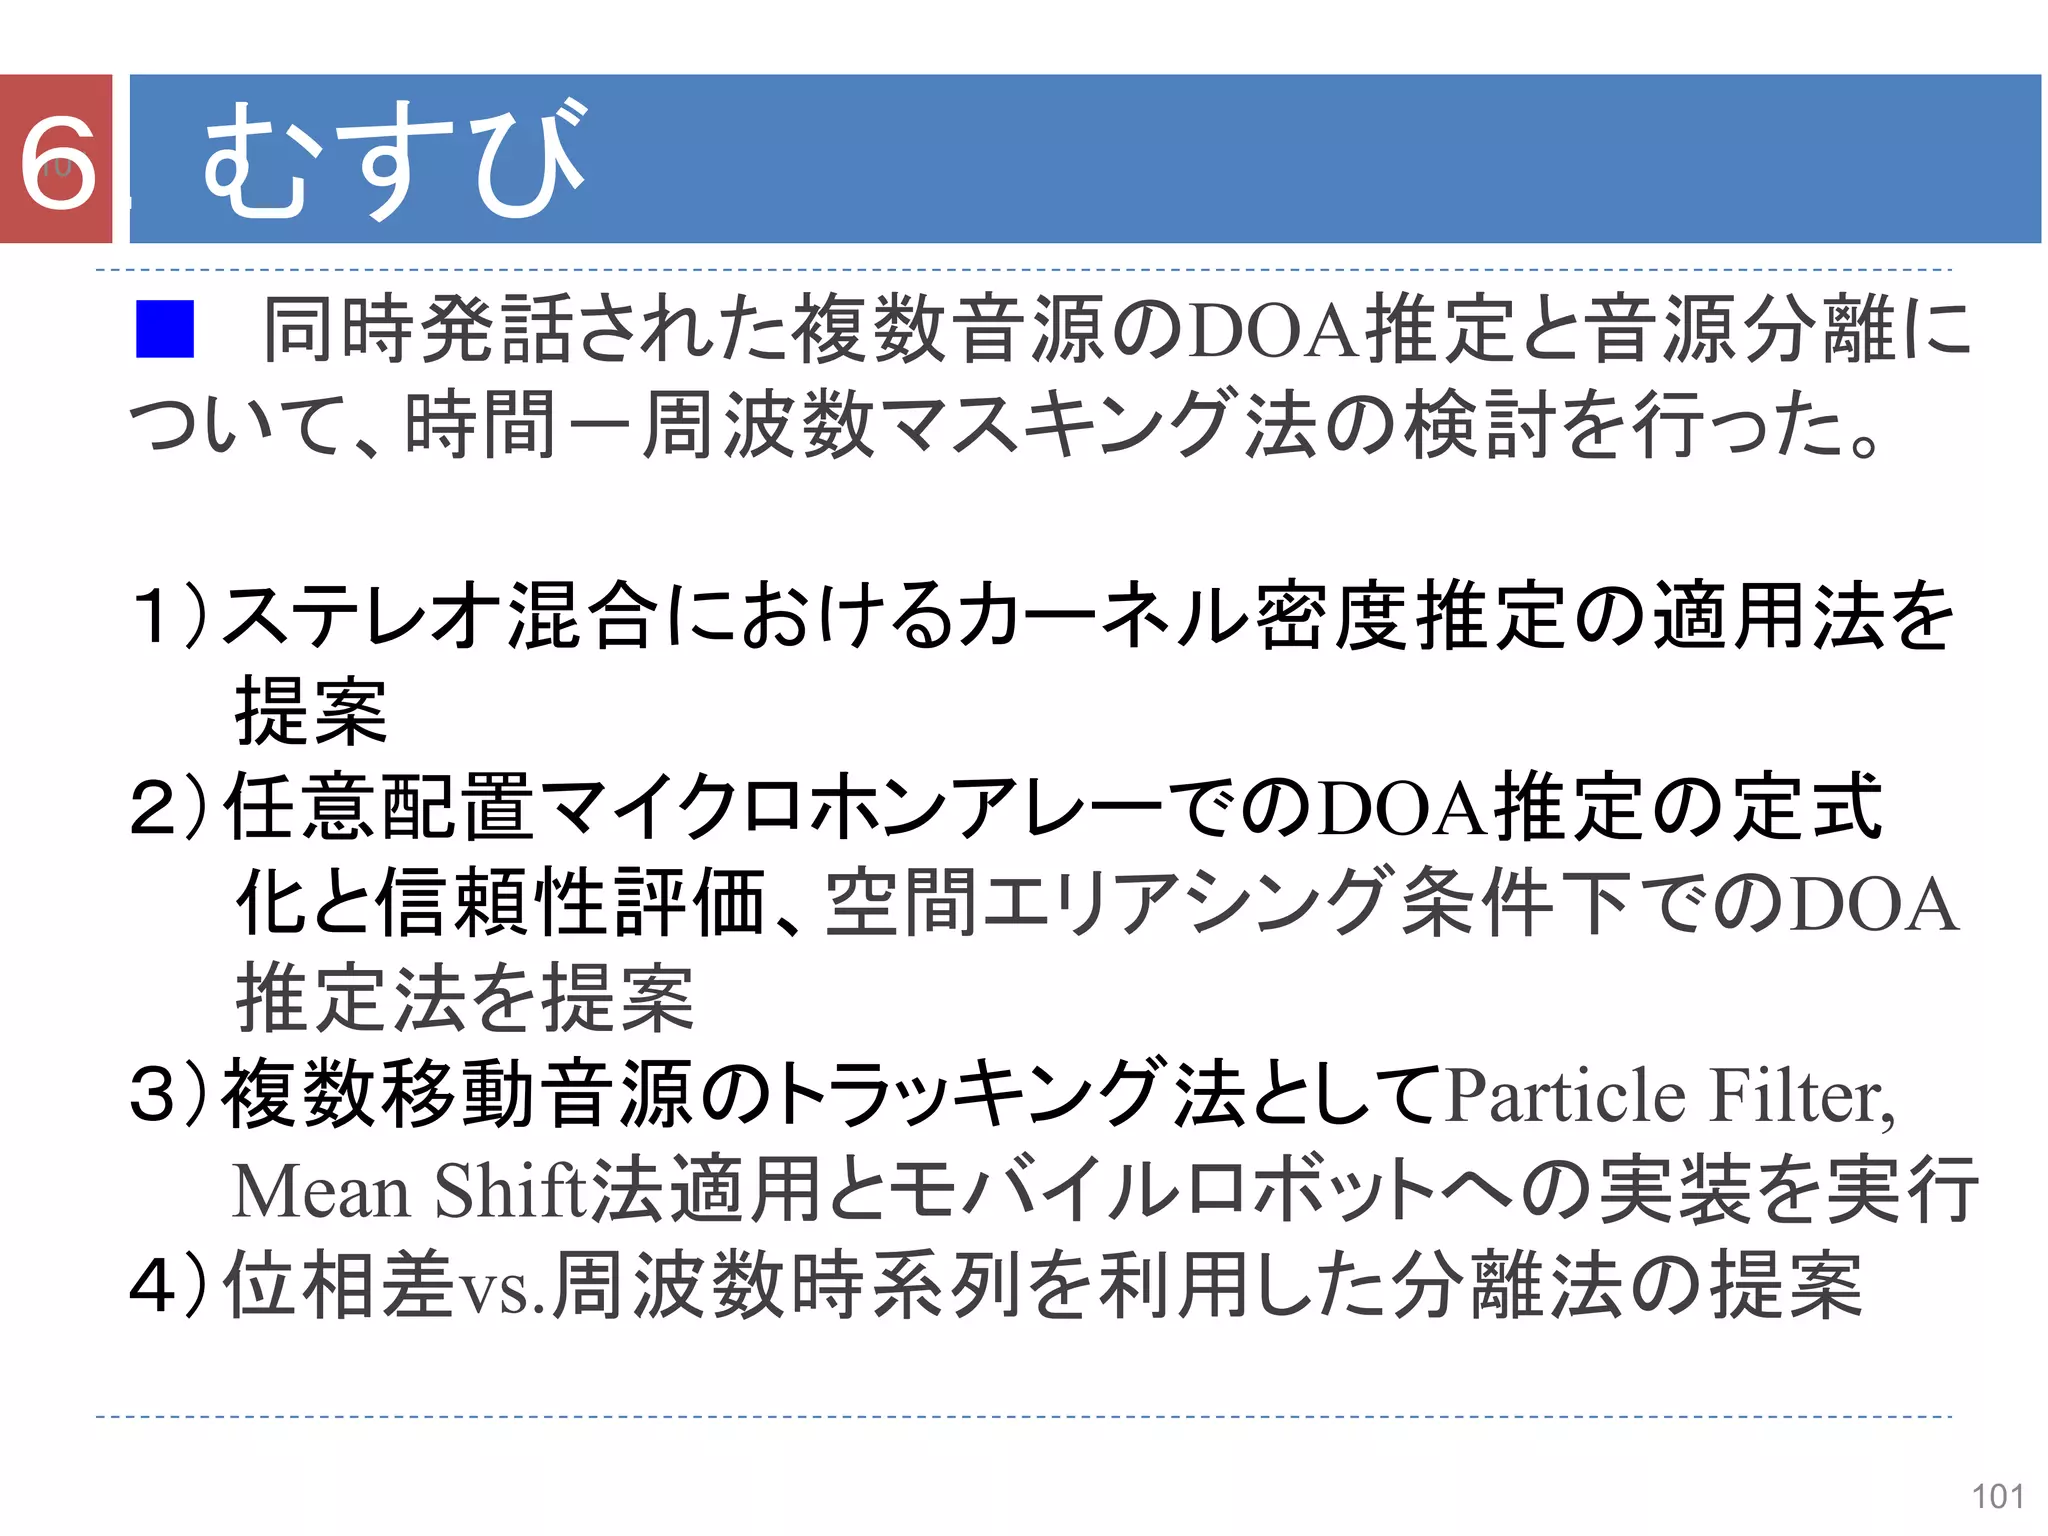
4. Exp, FieldTest & Result (cont.)
Filed Test: Robot master tracking & Identification
Robot Audition System field test for tracking a speaking person using
mean-shift algorithm and speaker identification
Video on youtube HamadaLab channel :
http://youtu.be/6vazpZbYlgI and http://youtu.be/TZqiHtjTOFM
7
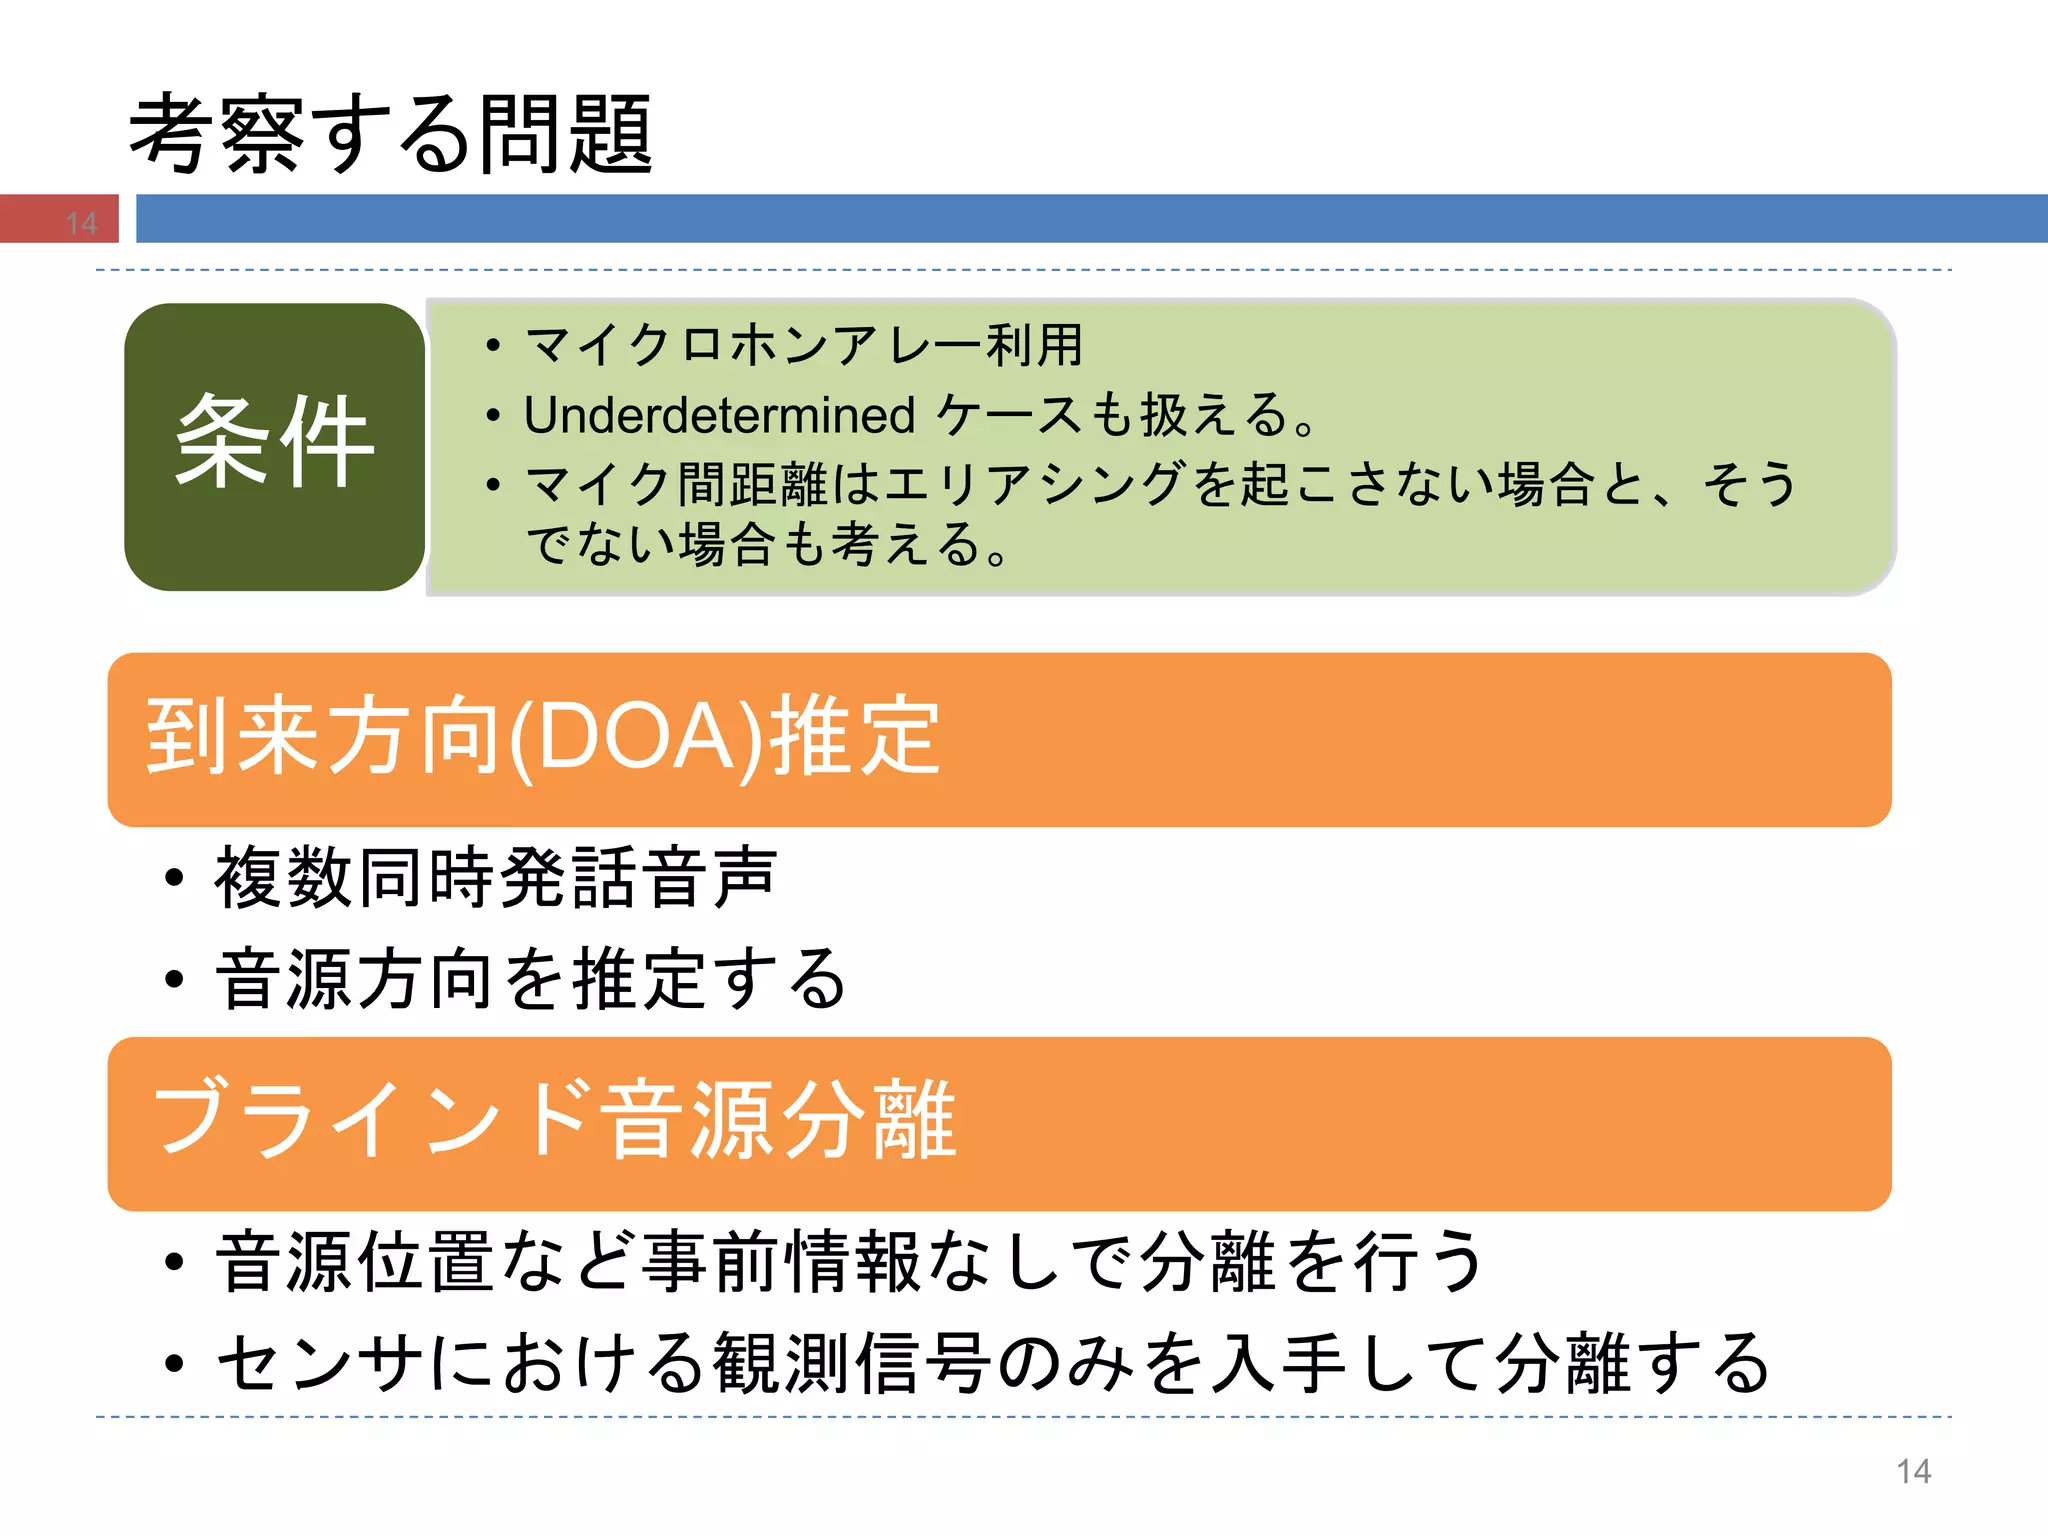
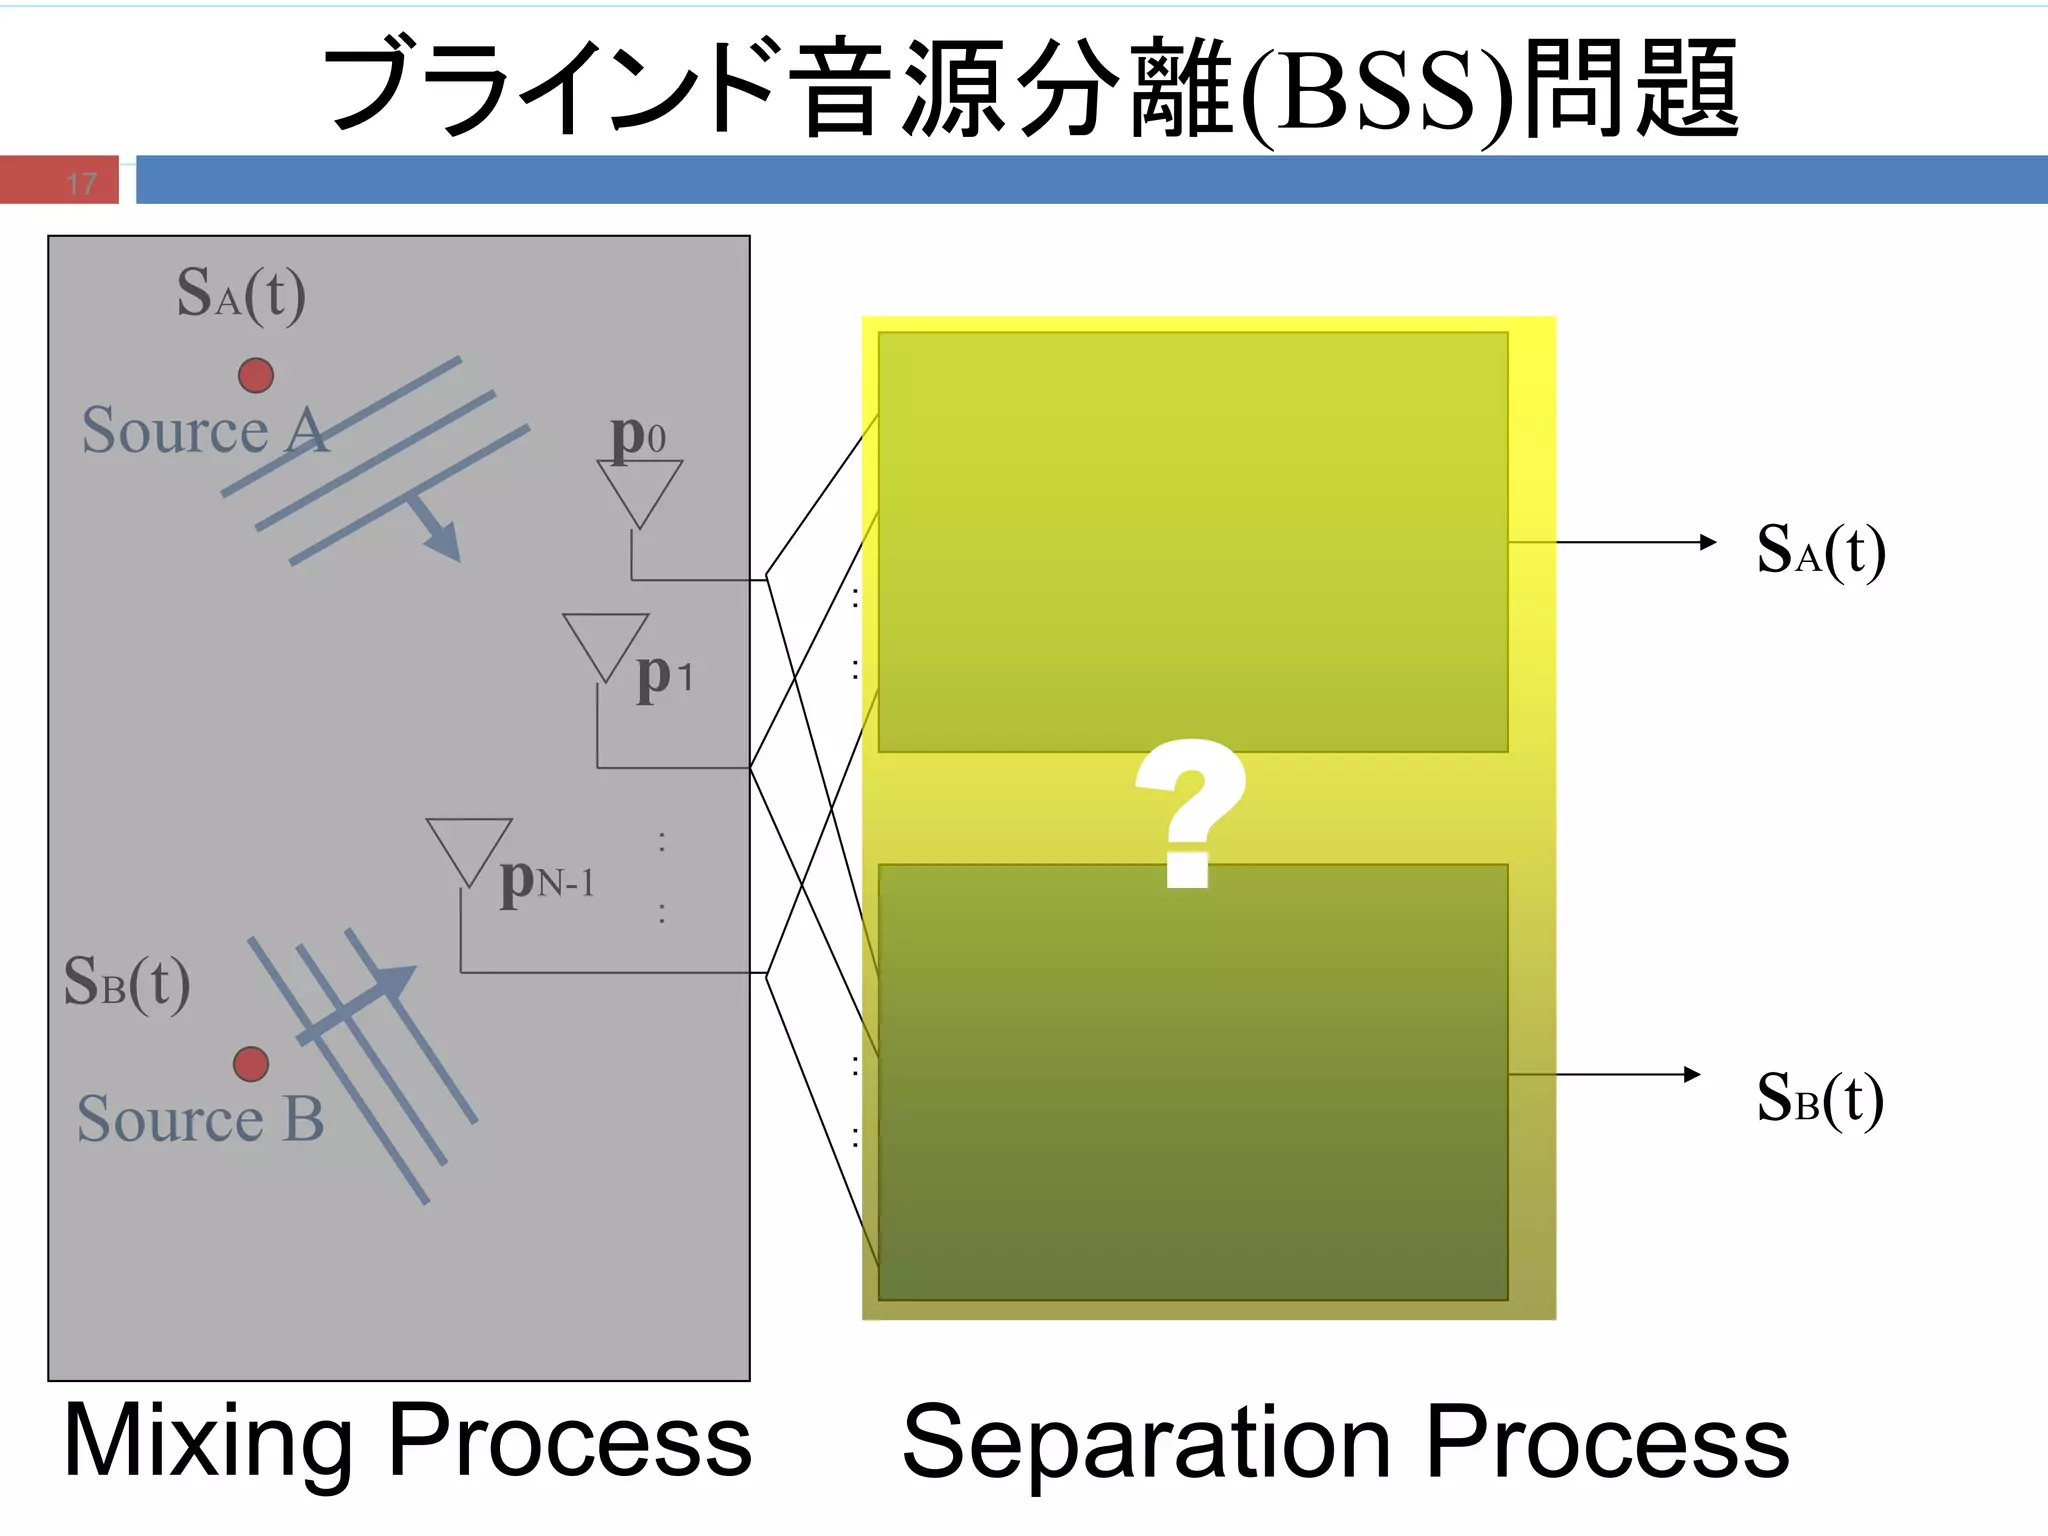
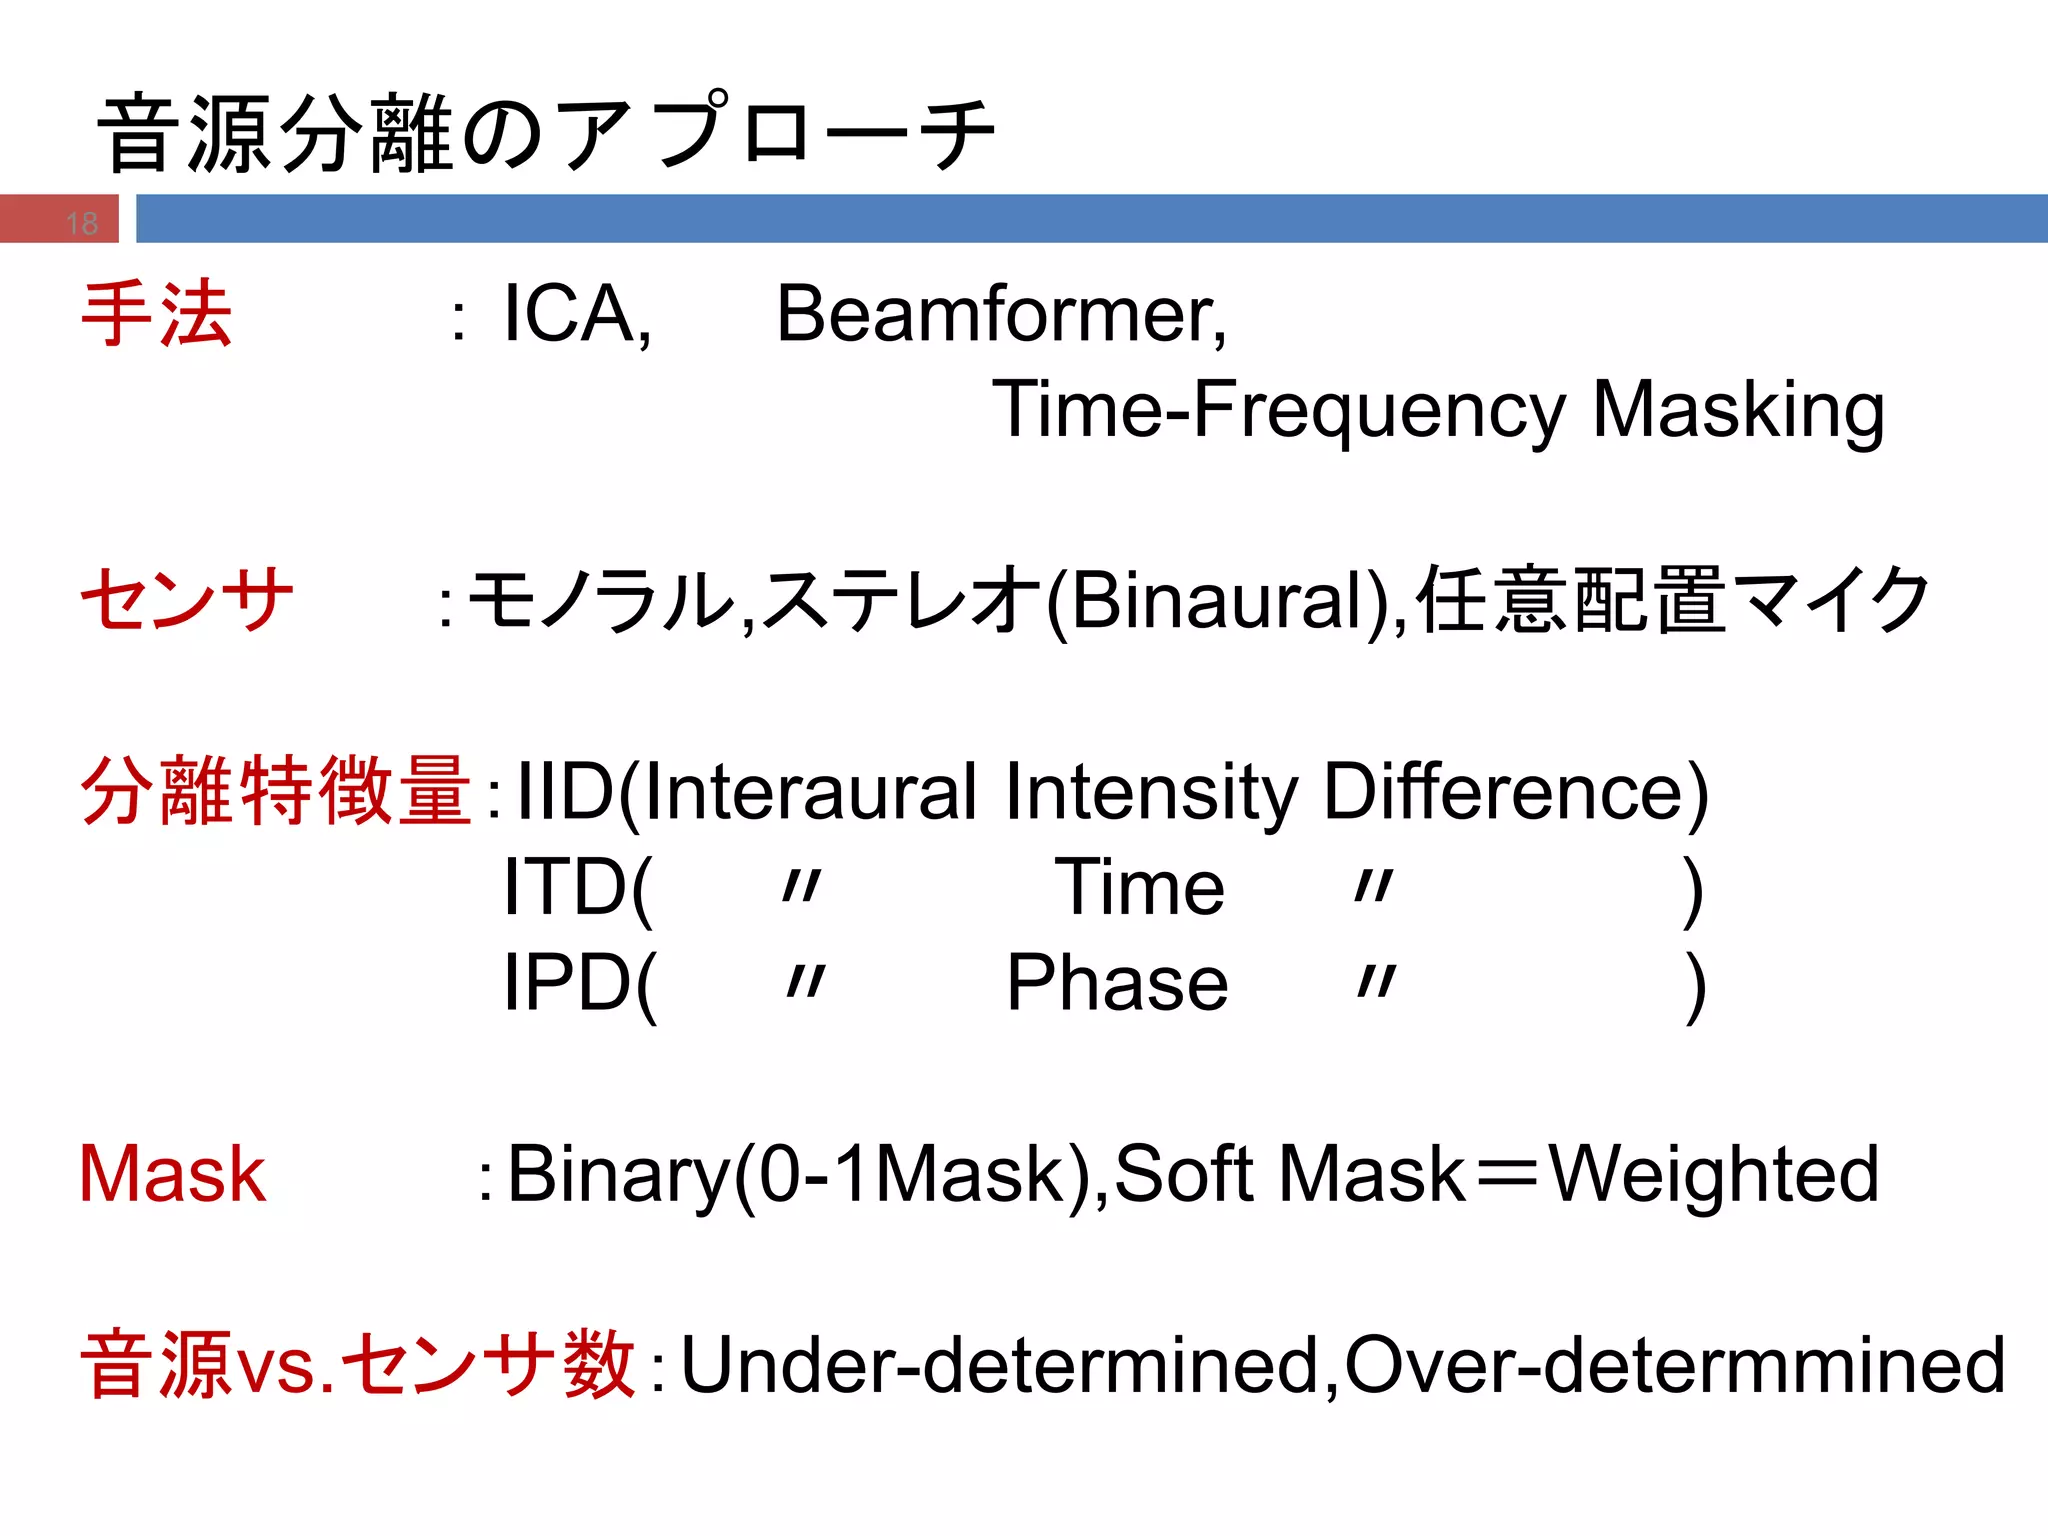
課題: 同時発話された複数音源の
到来方向推定 と音源分離
基本問題:
ASA(Auditory Scene Analysis)
CASA(Computational Auditory Scene Analysis)
背景:アレー信号処理、ロボット聴覚に関する研究・開発
7
1.はじめに
8.
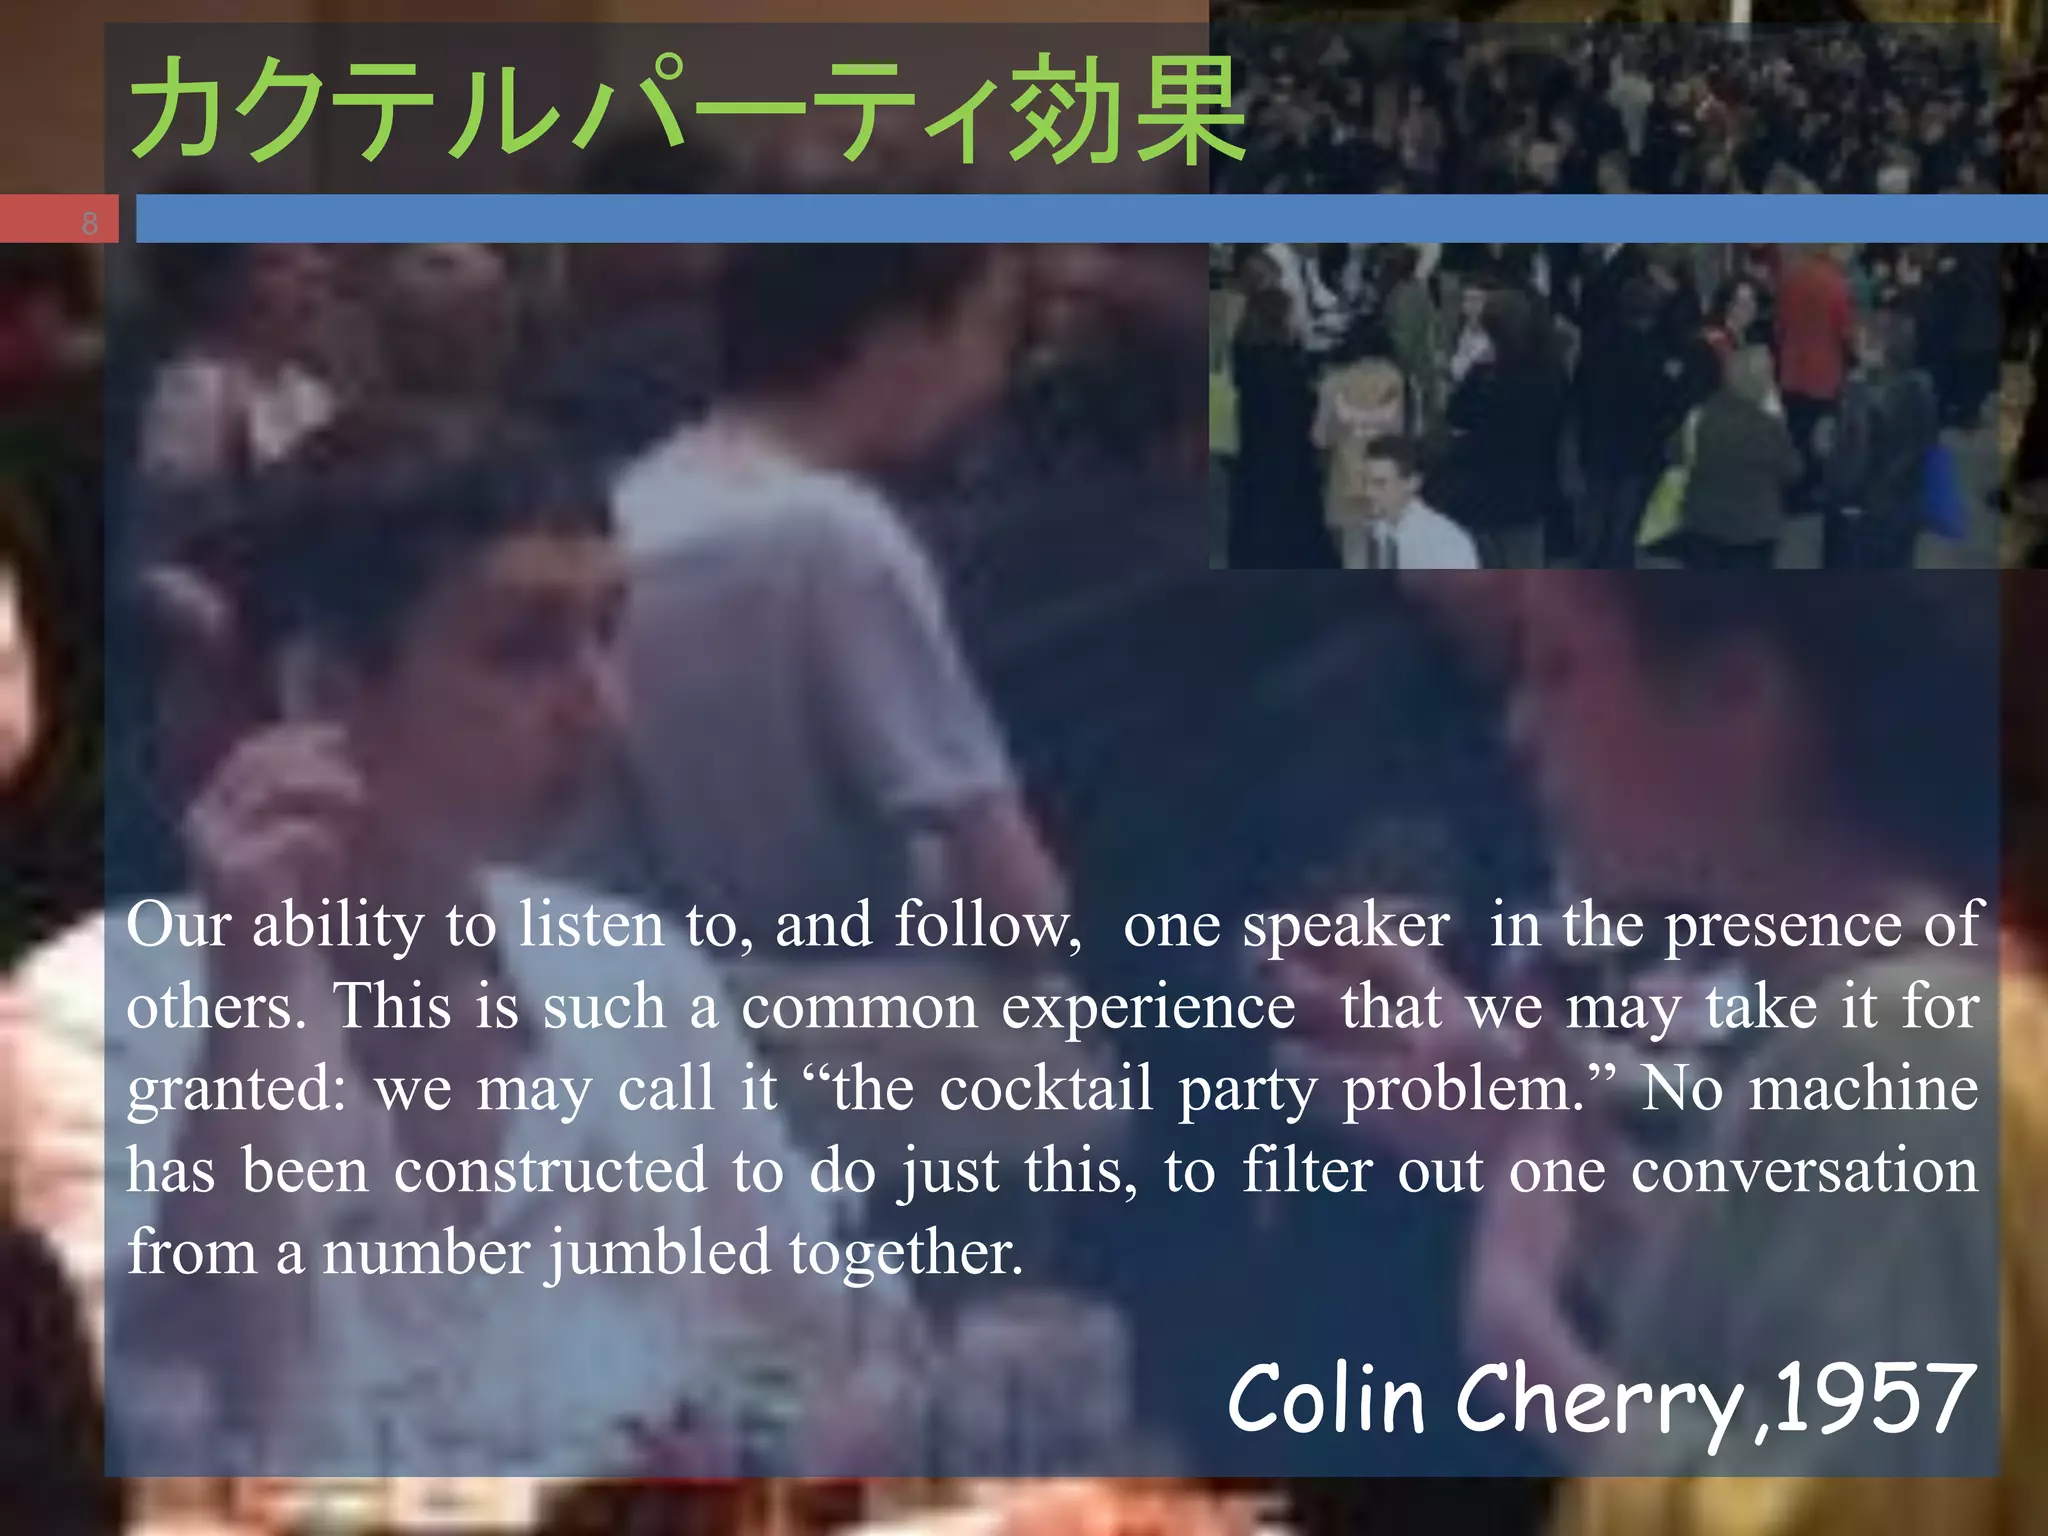
カクテルパーティ効果
Our ability tolisten to, and follow, one speaker in the presence of
others. This is such a common experience that we may take it for
granted: we may call it “the cocktail party problem.” No machine
has been constructed to do just this, to filter out one conversation
from a number jumbled together.
Colin Cherry,1957
8
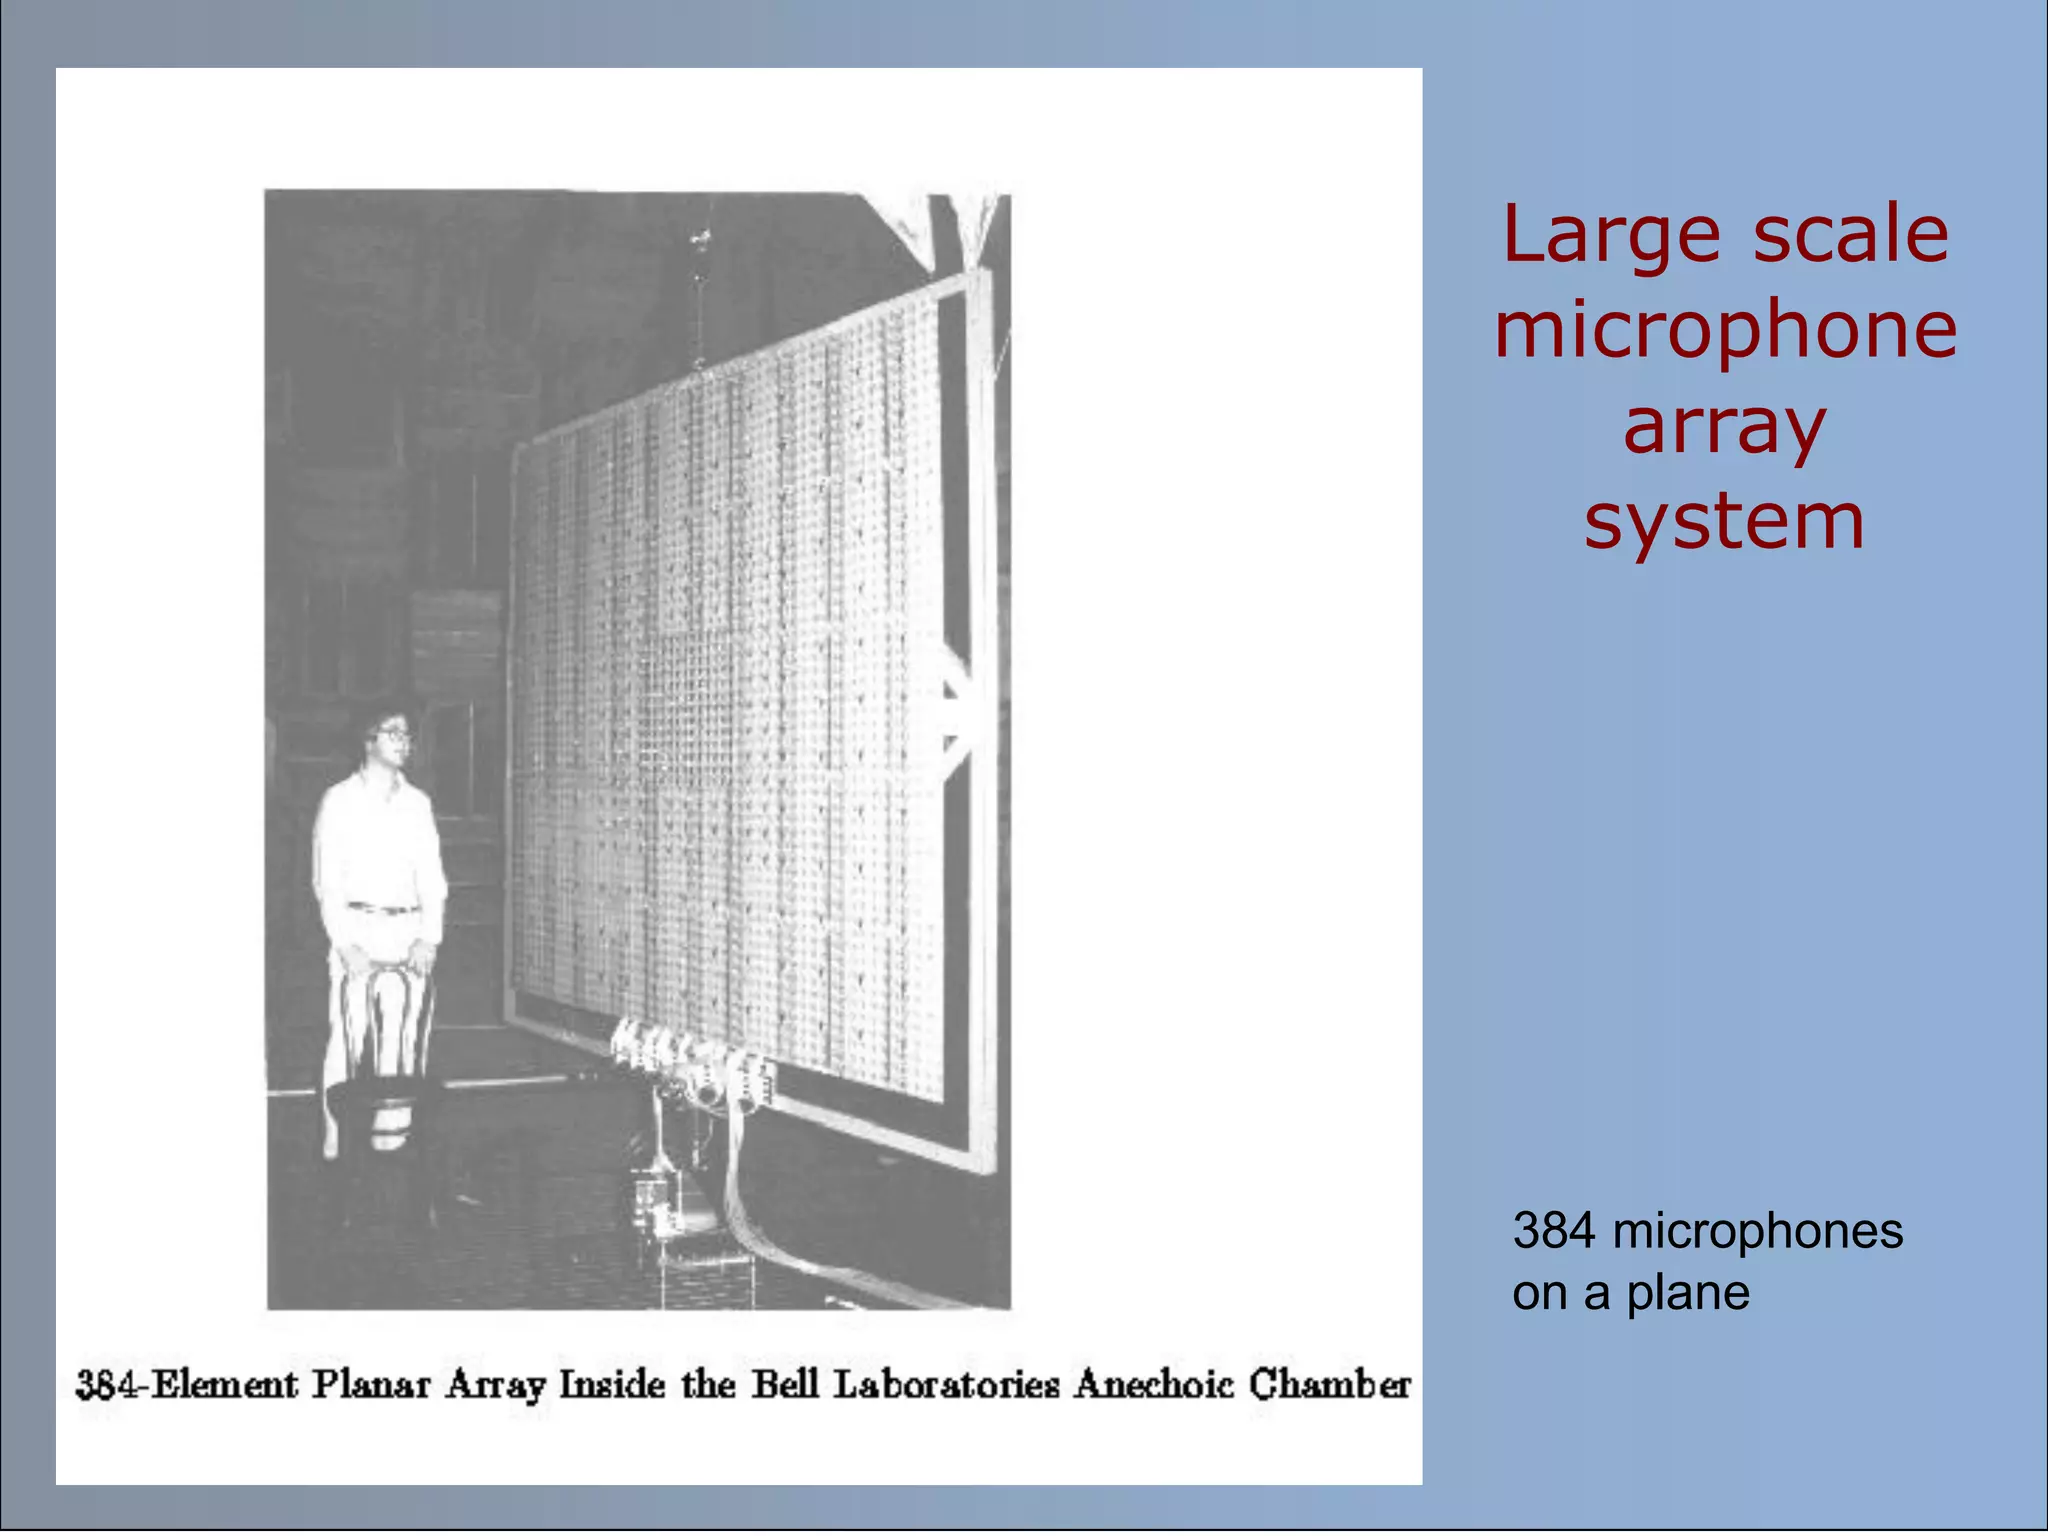
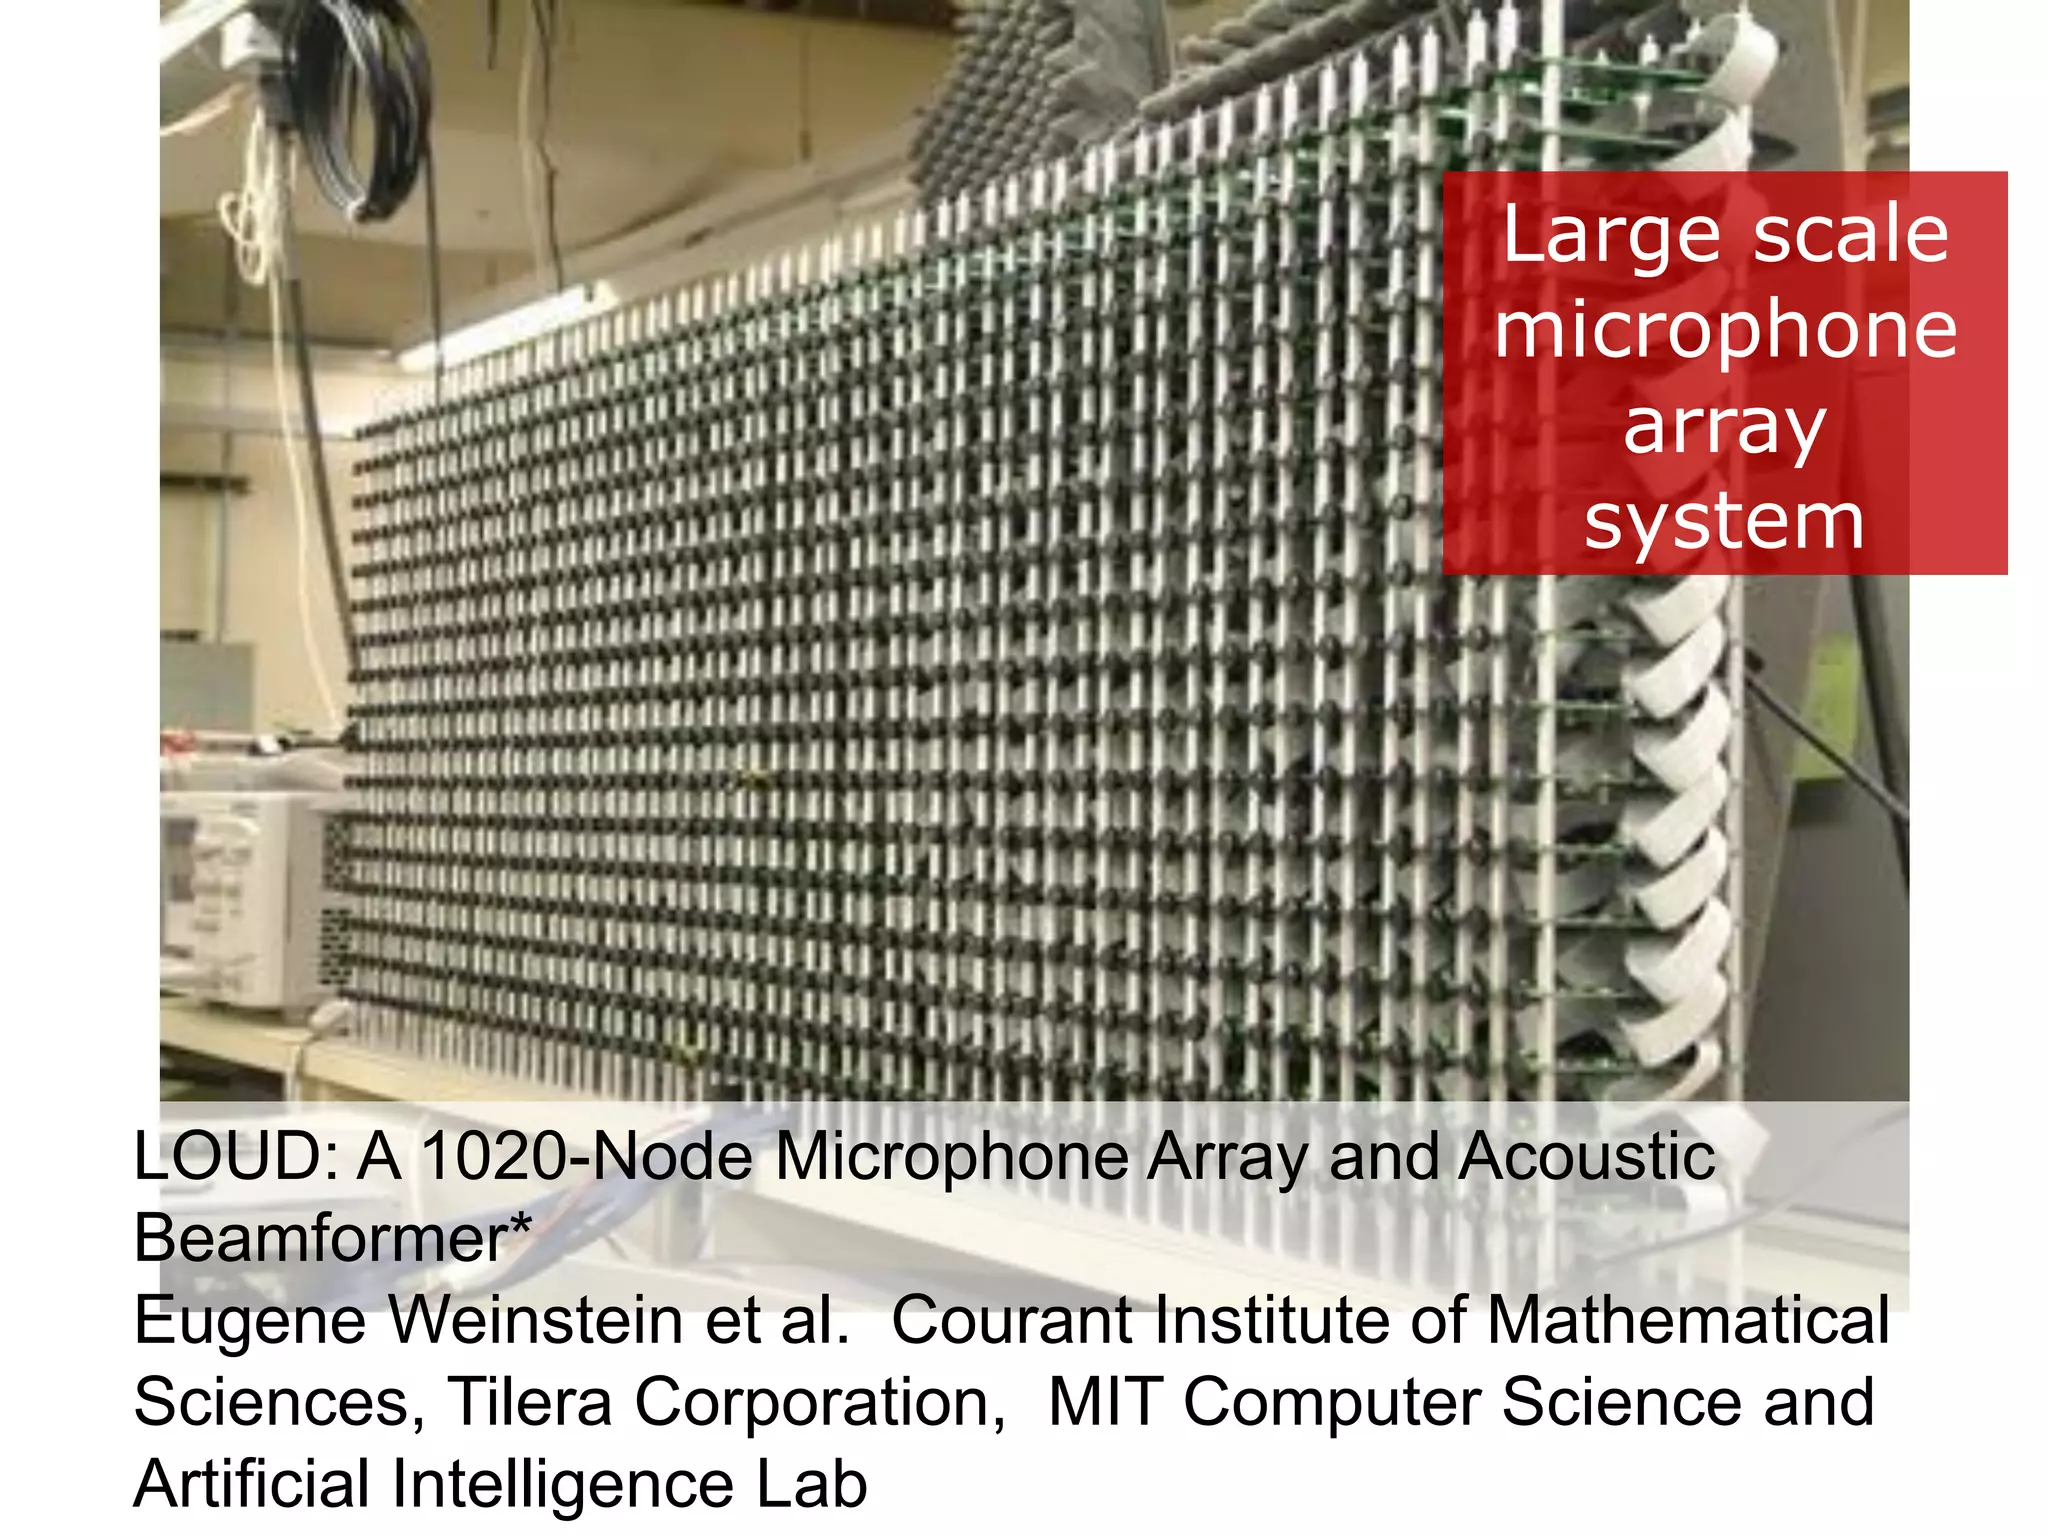
LOUD: A 1020-NodeMicrophone Array and Acoustic
Beamformer*
Eugene Weinstein et al. Courant Institute of Mathematical
Sciences, Tilera Corporation, MIT Computer Science and
Artificial Intelligence Lab
Large scale
microphone
array
system
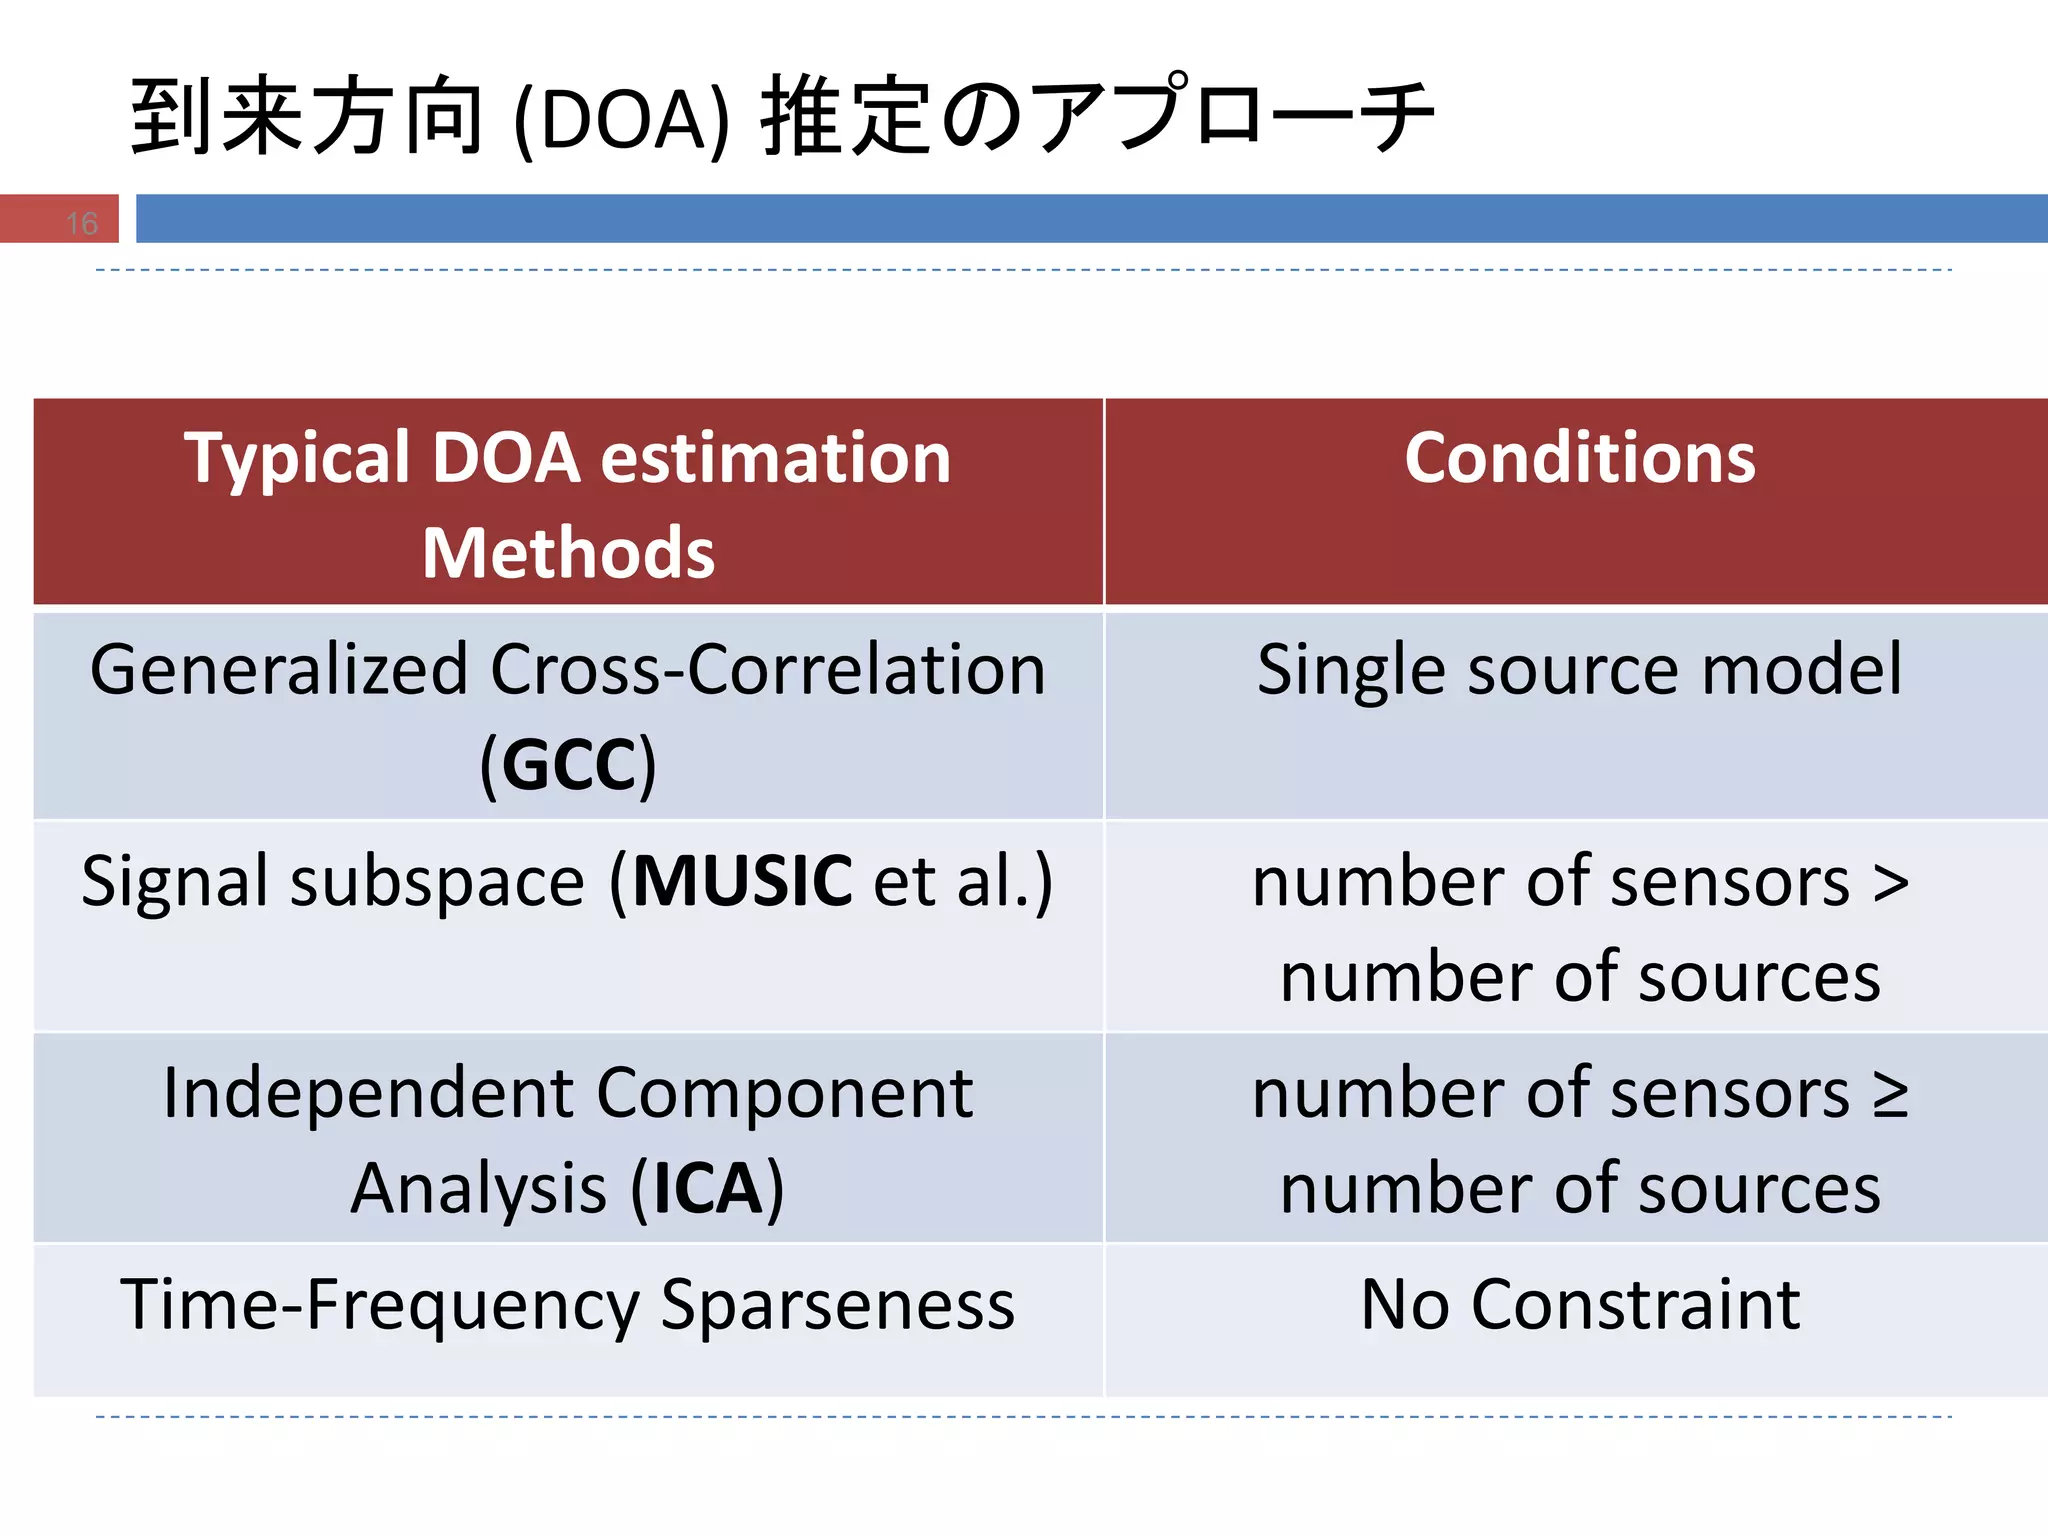
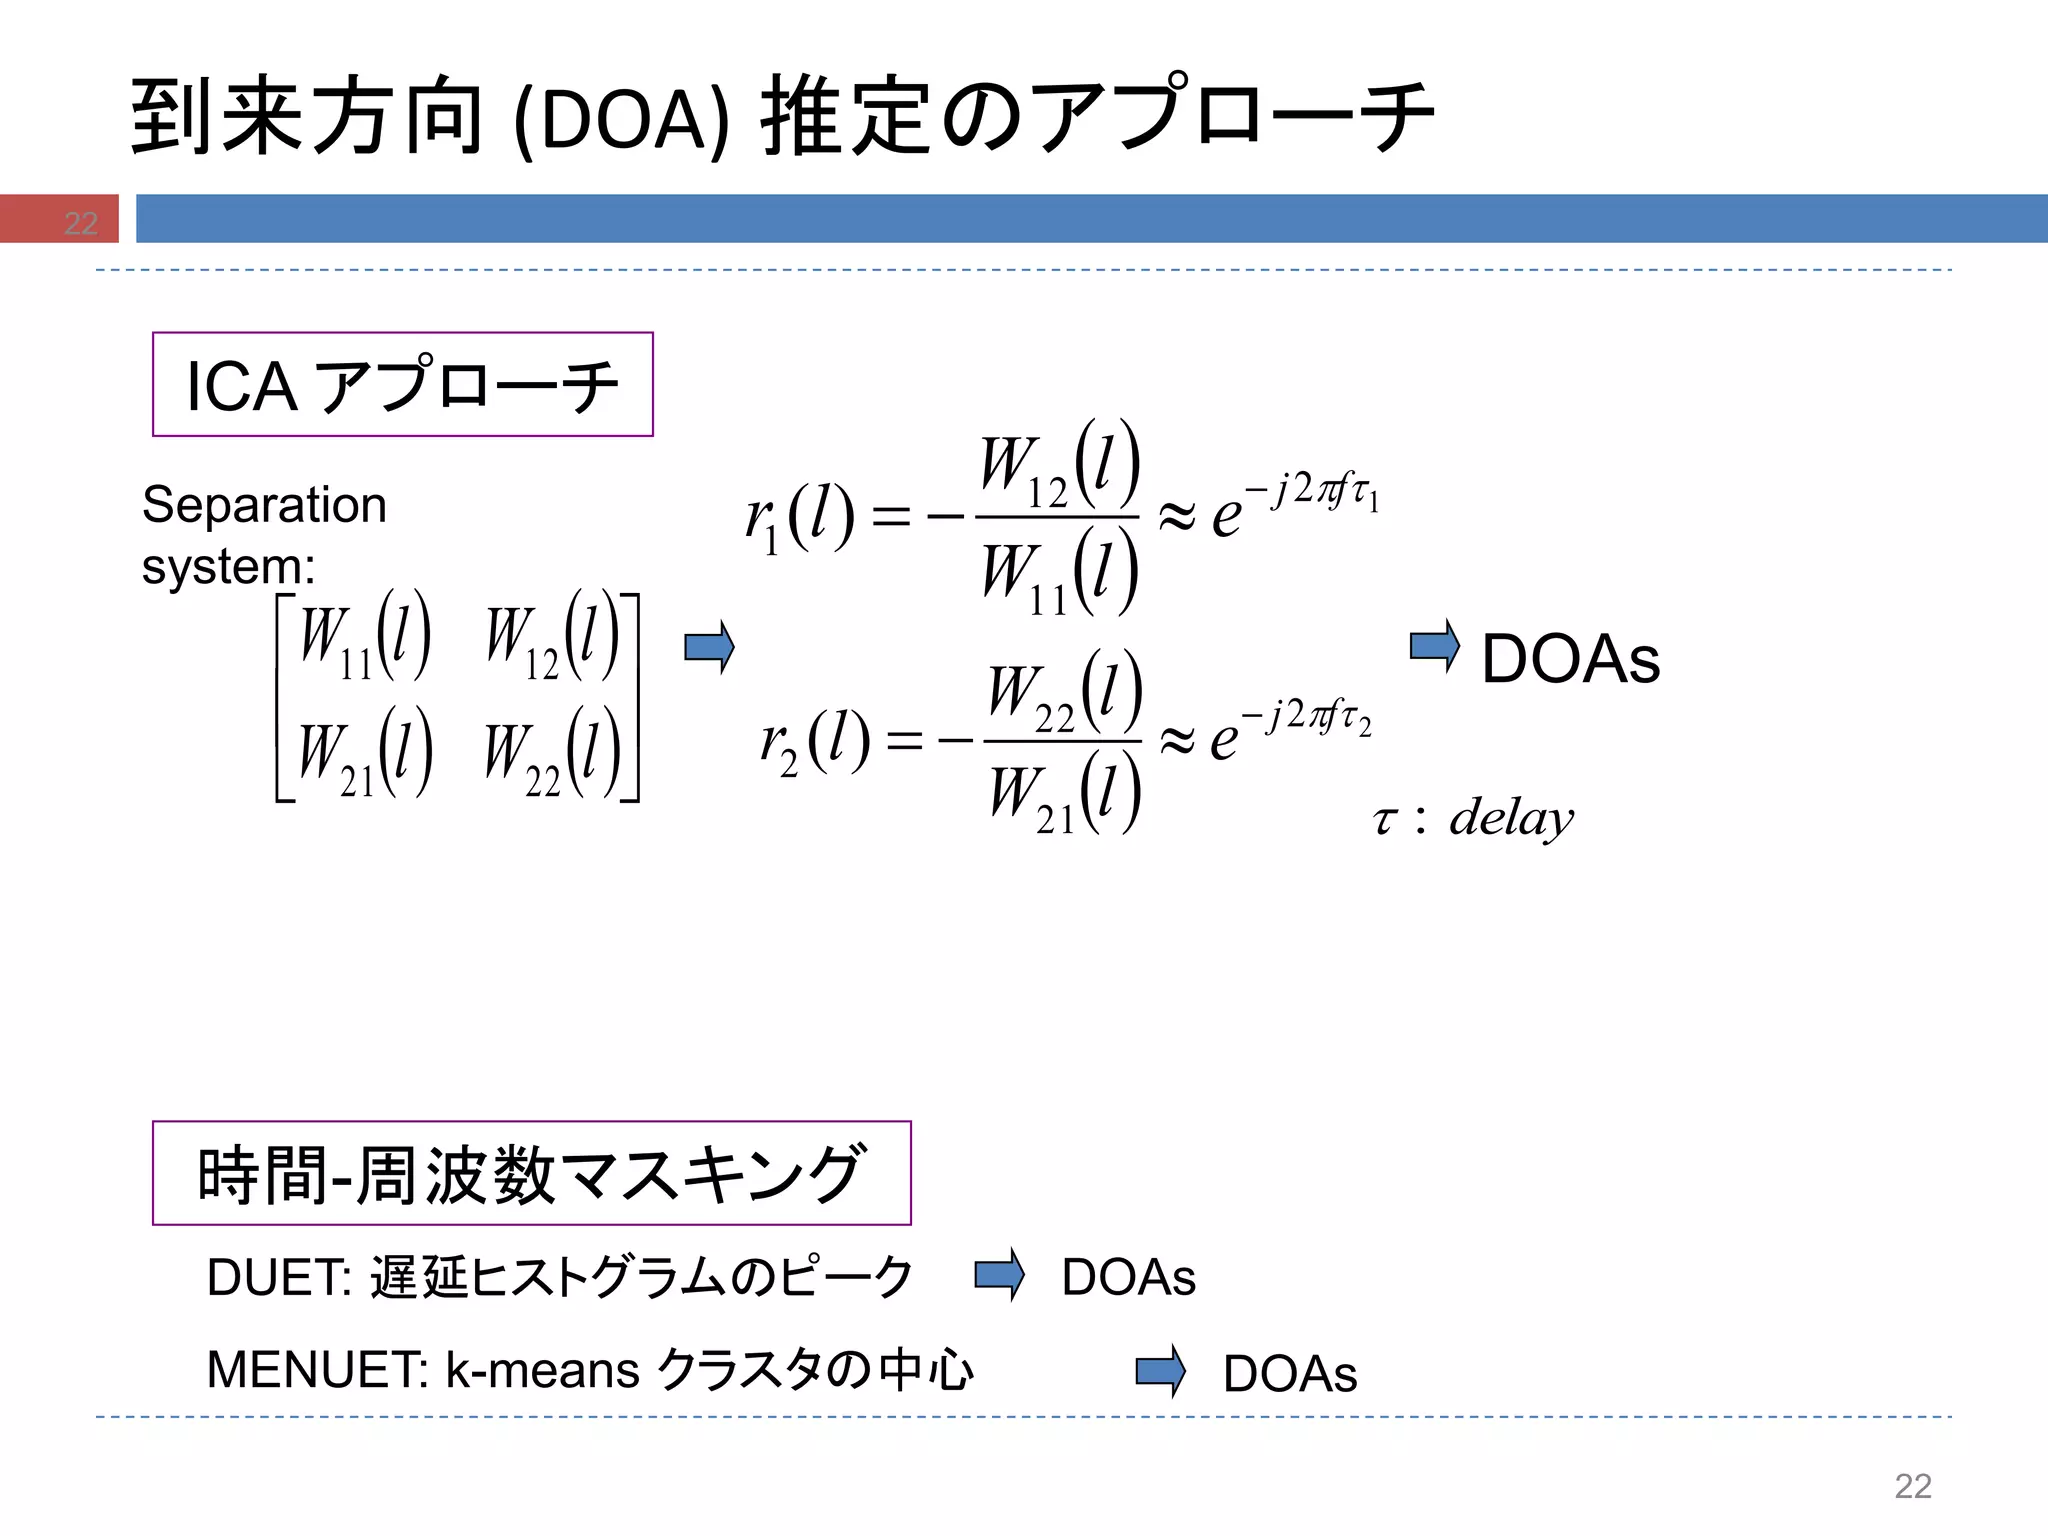
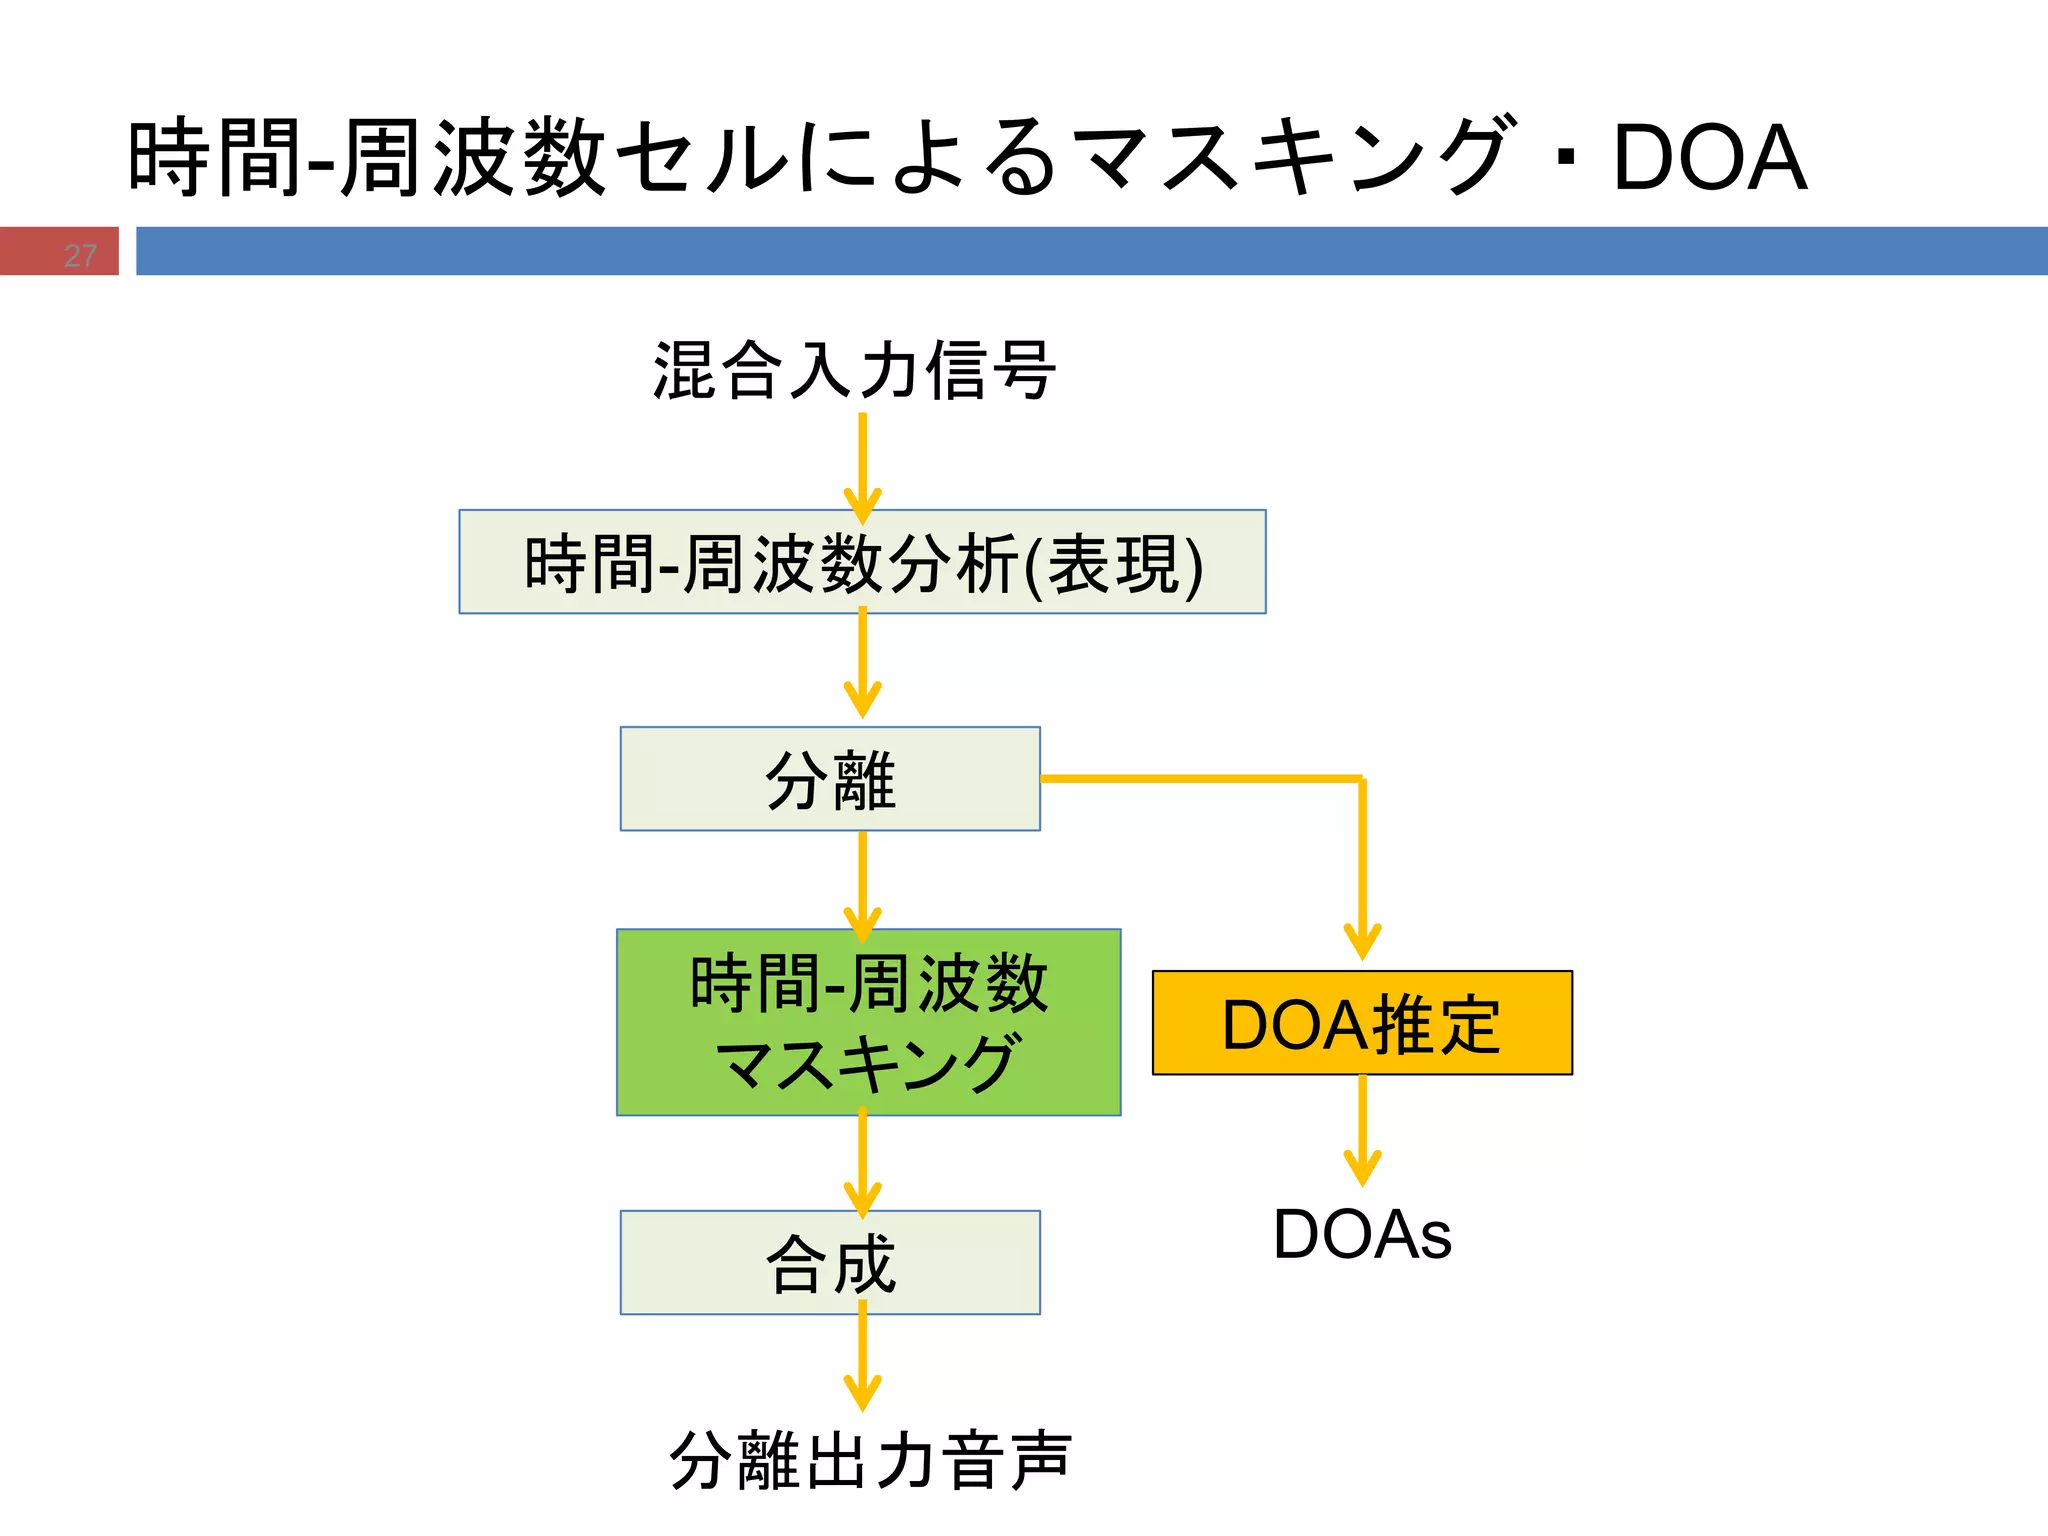
到来方向 (DOA) 推定のアプローチ
TypicalDOA estimation
Methods
Conditions
Generalized Cross-Correlation
(GCC)
Single source model
Signal subspace (MUSIC et al.) number of sensors >
number of sources
Independent Component
Analysis (ICA)
number of sensors ≥
number of sources
Time-Frequency Sparseness No Constraint
16
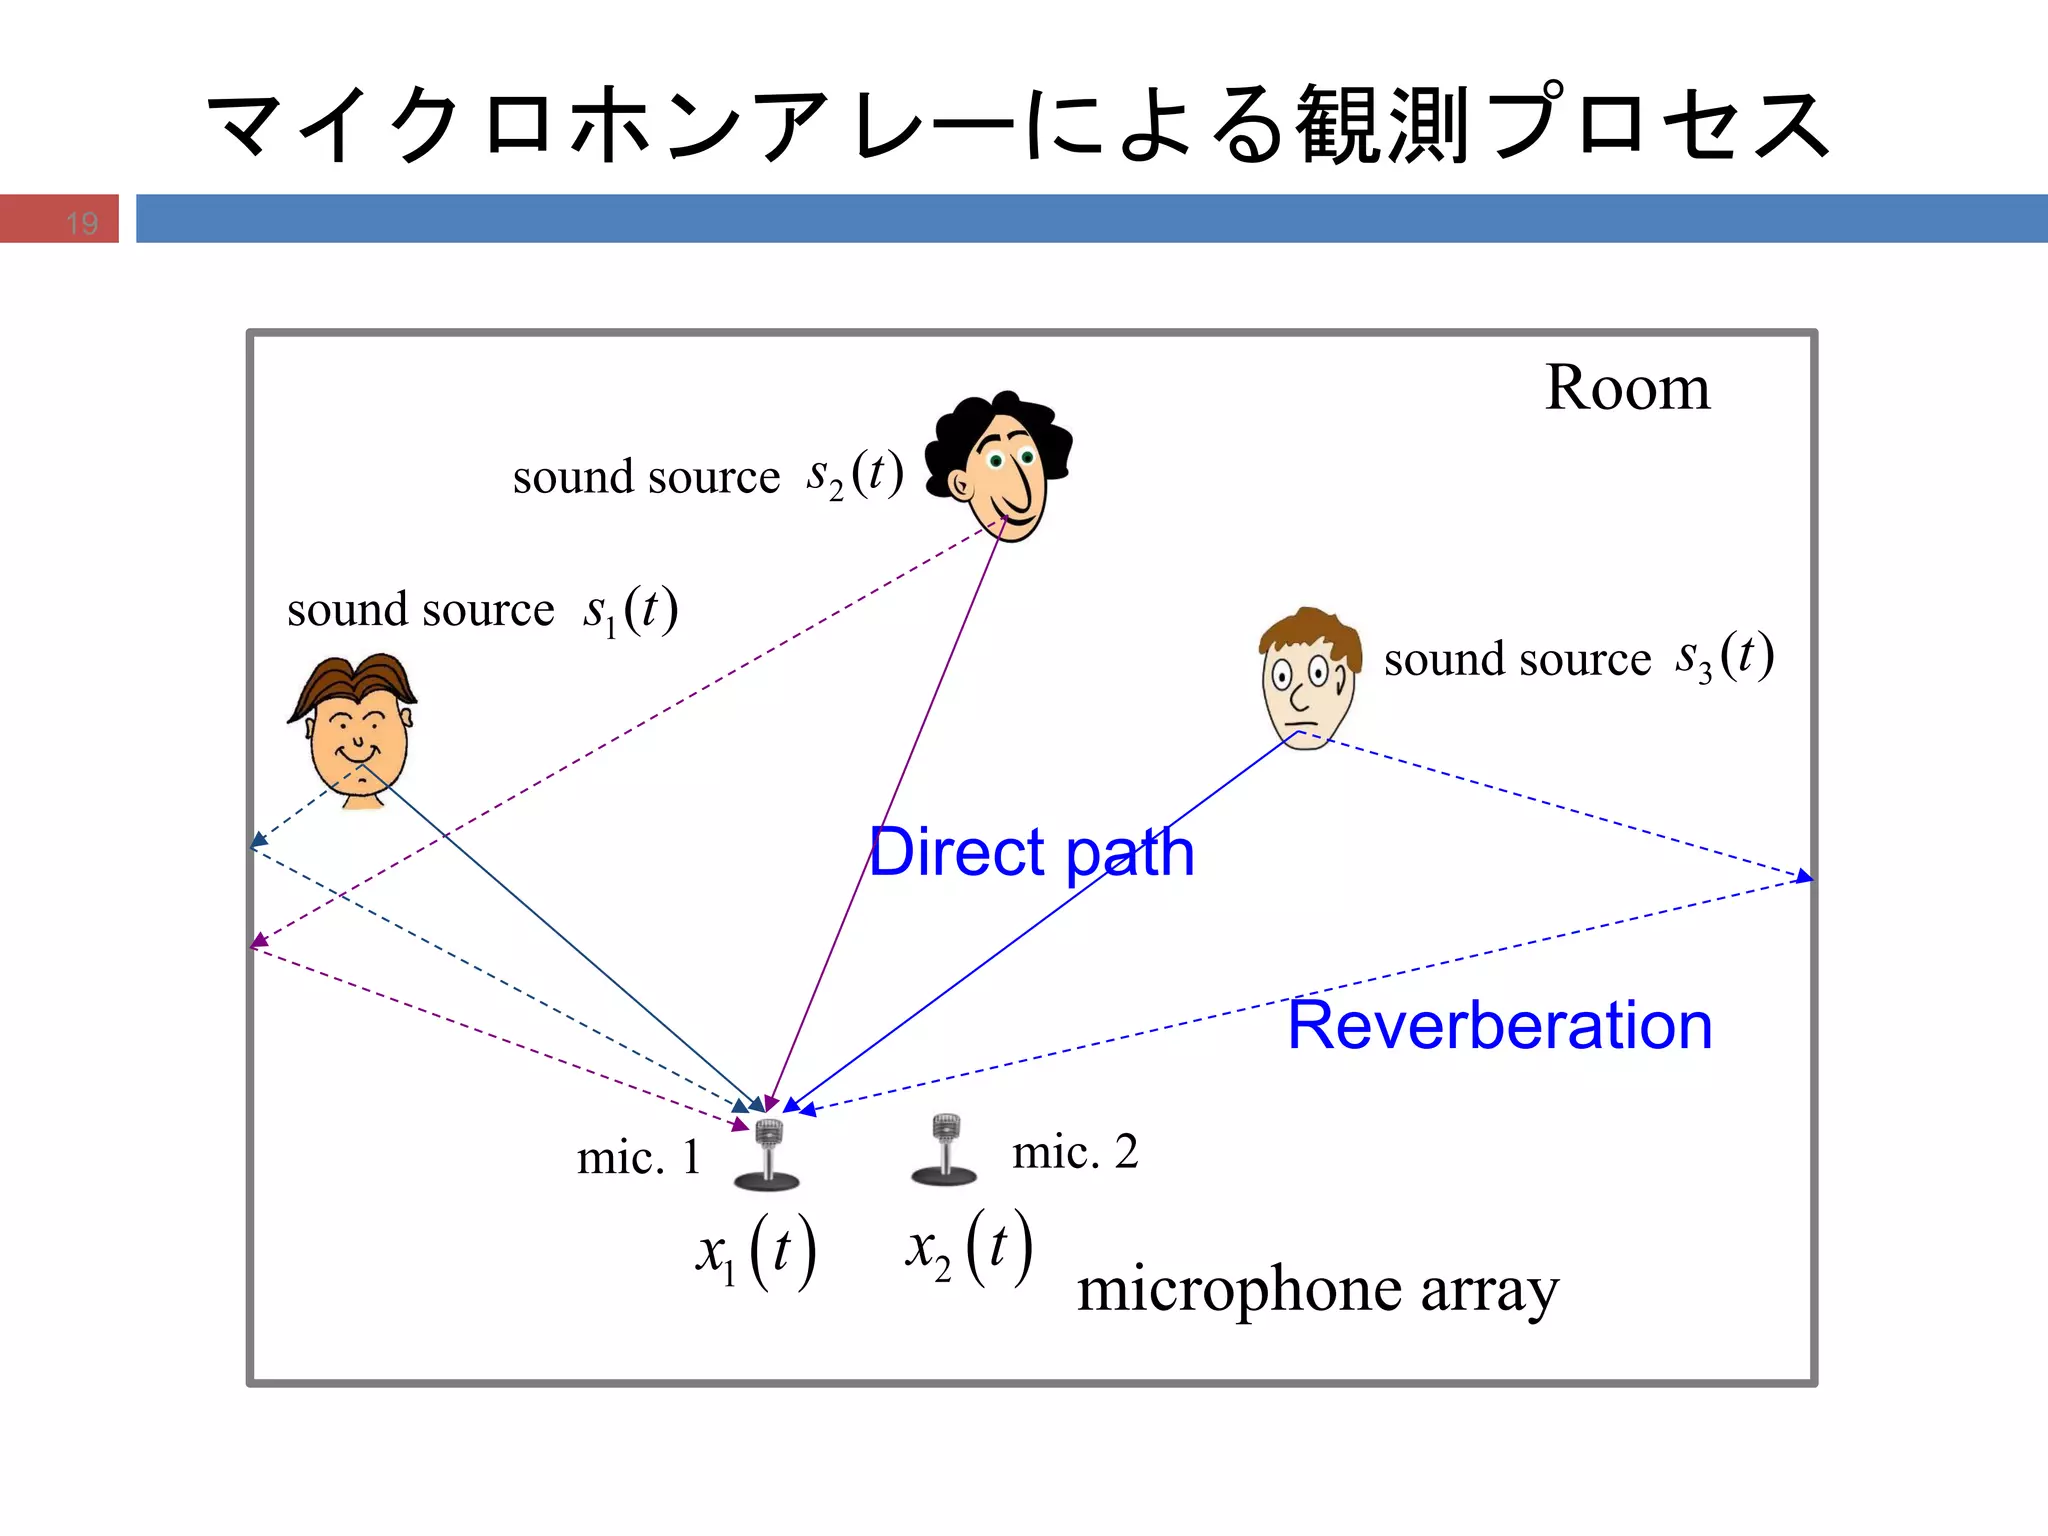
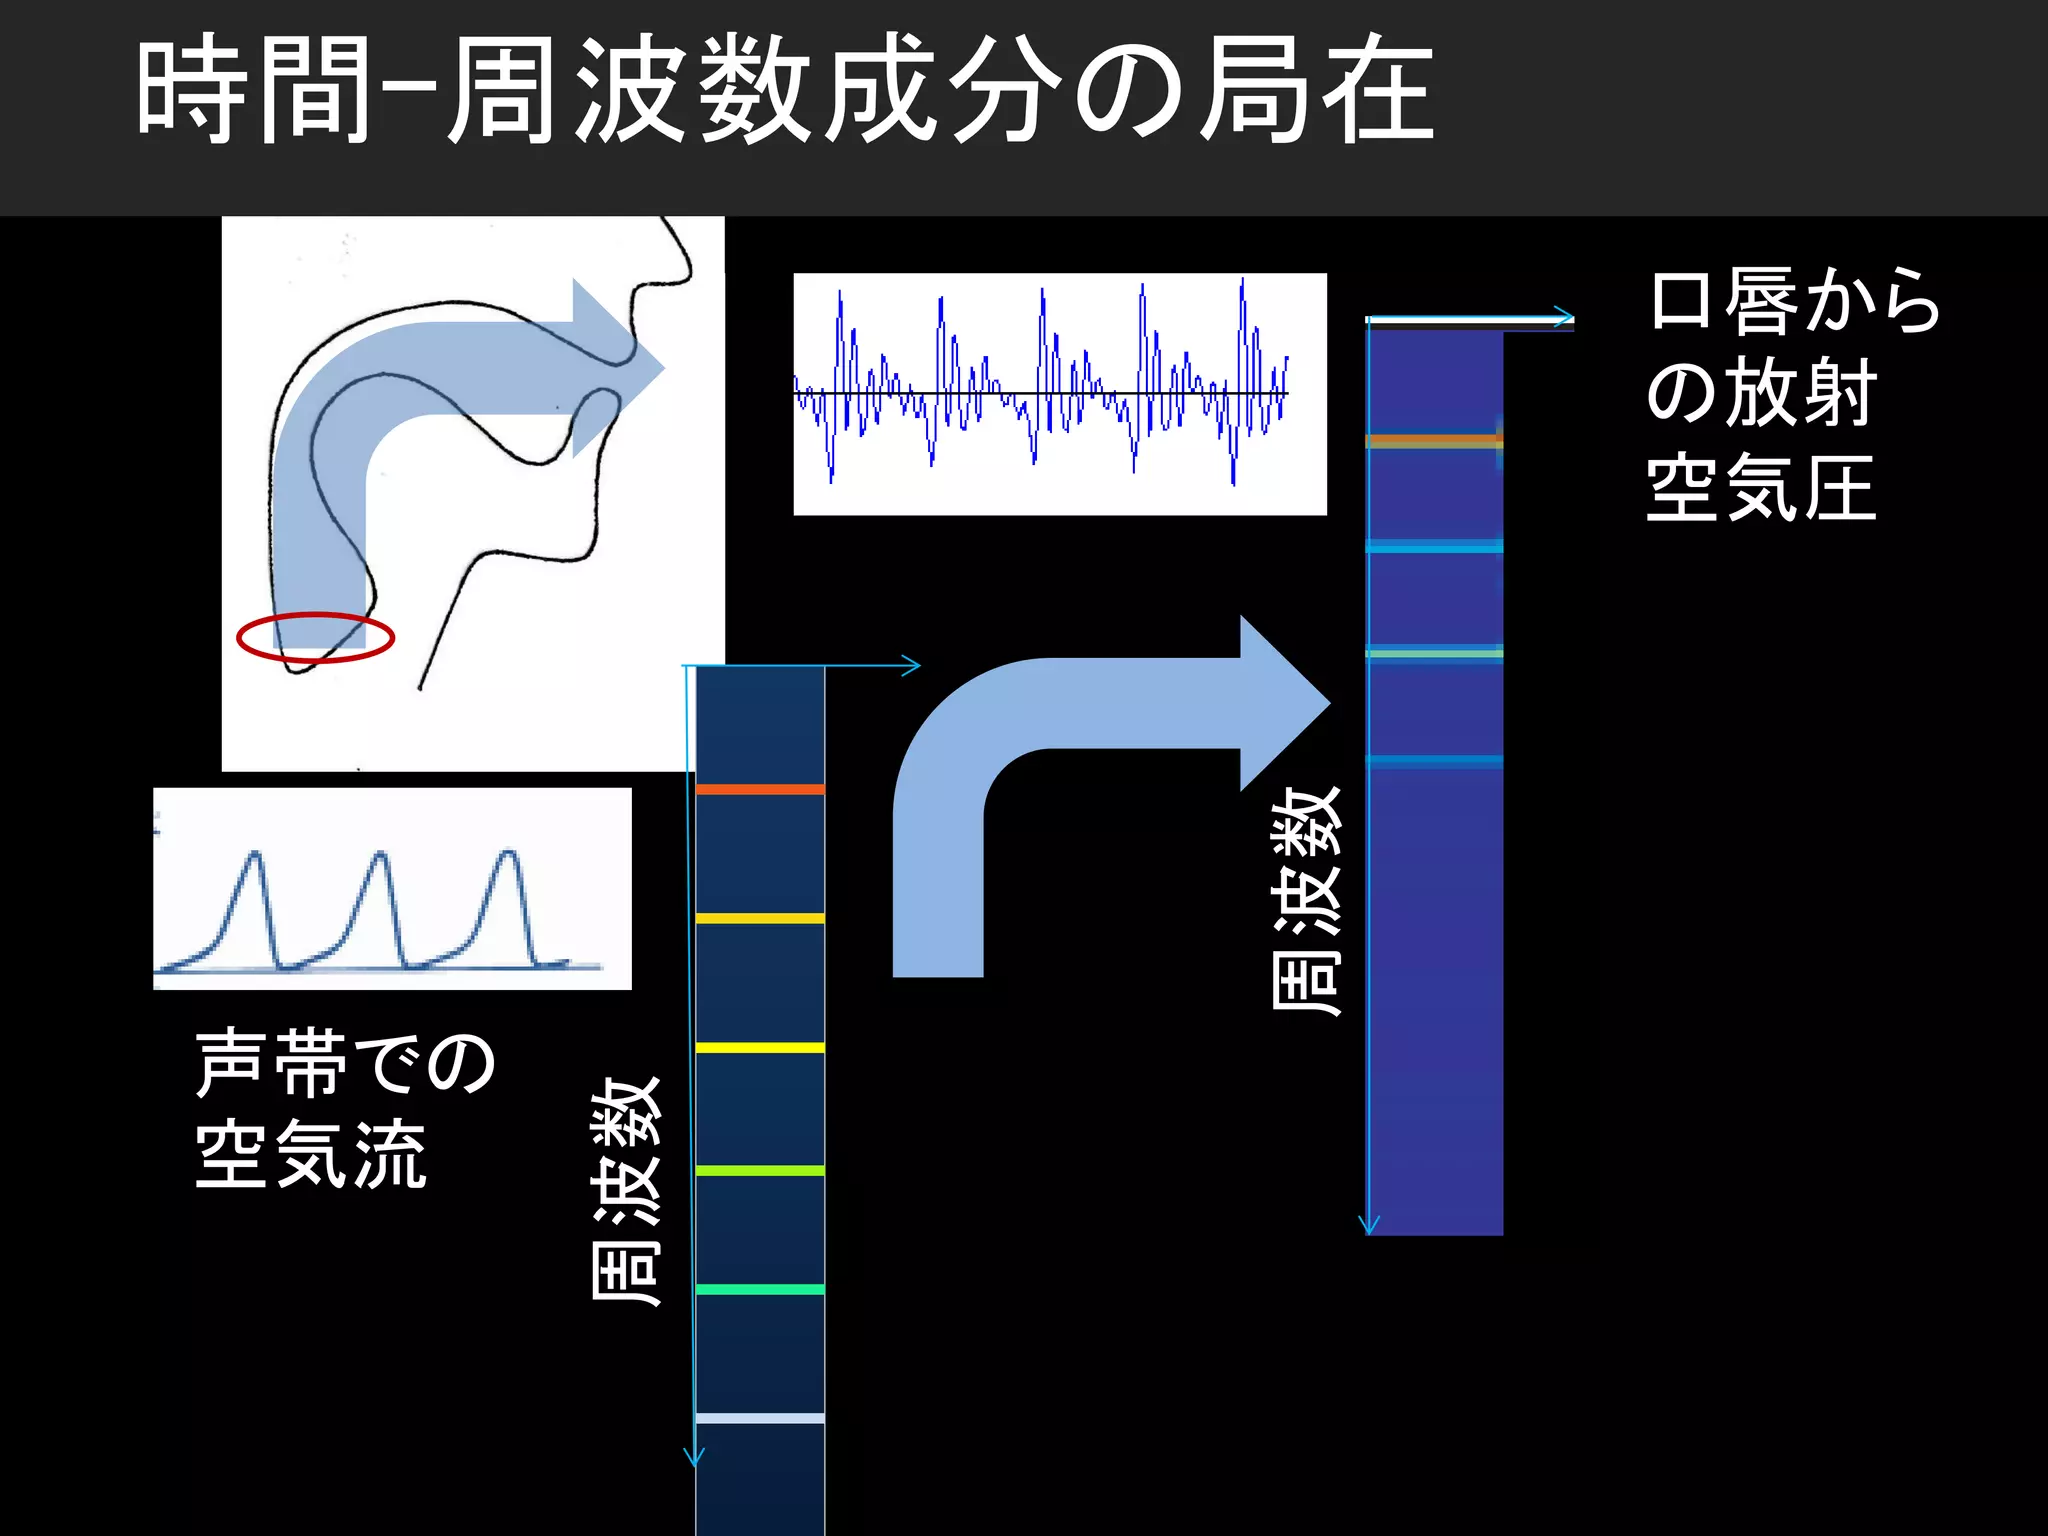
音源混合モデル
20
( ) () ( )mi mi i
j
x h j s j
たたみ込み混合
: インパルス応答
音源 i からマイク m へ
( )mih j
0.02 0.04 0.06 0.08 0.1 0.12 0.14 0.16
0
5
10
x 10
-3
time (s)
TFcoeffs
Direct wave
Reflected waves
Example of a room impulse response
lj
mm ekSwinxlkX 2
)()(],[
時間-周波数領域表現
周波数域における瞬時混合モデル
N
i
imi
N
i
mim lkSlHlkXlkX
11
],[][],[],[
)(1 s
)(2 s
)(1 x
)(2 x
22h
12h
21h
11h
)(mih
20
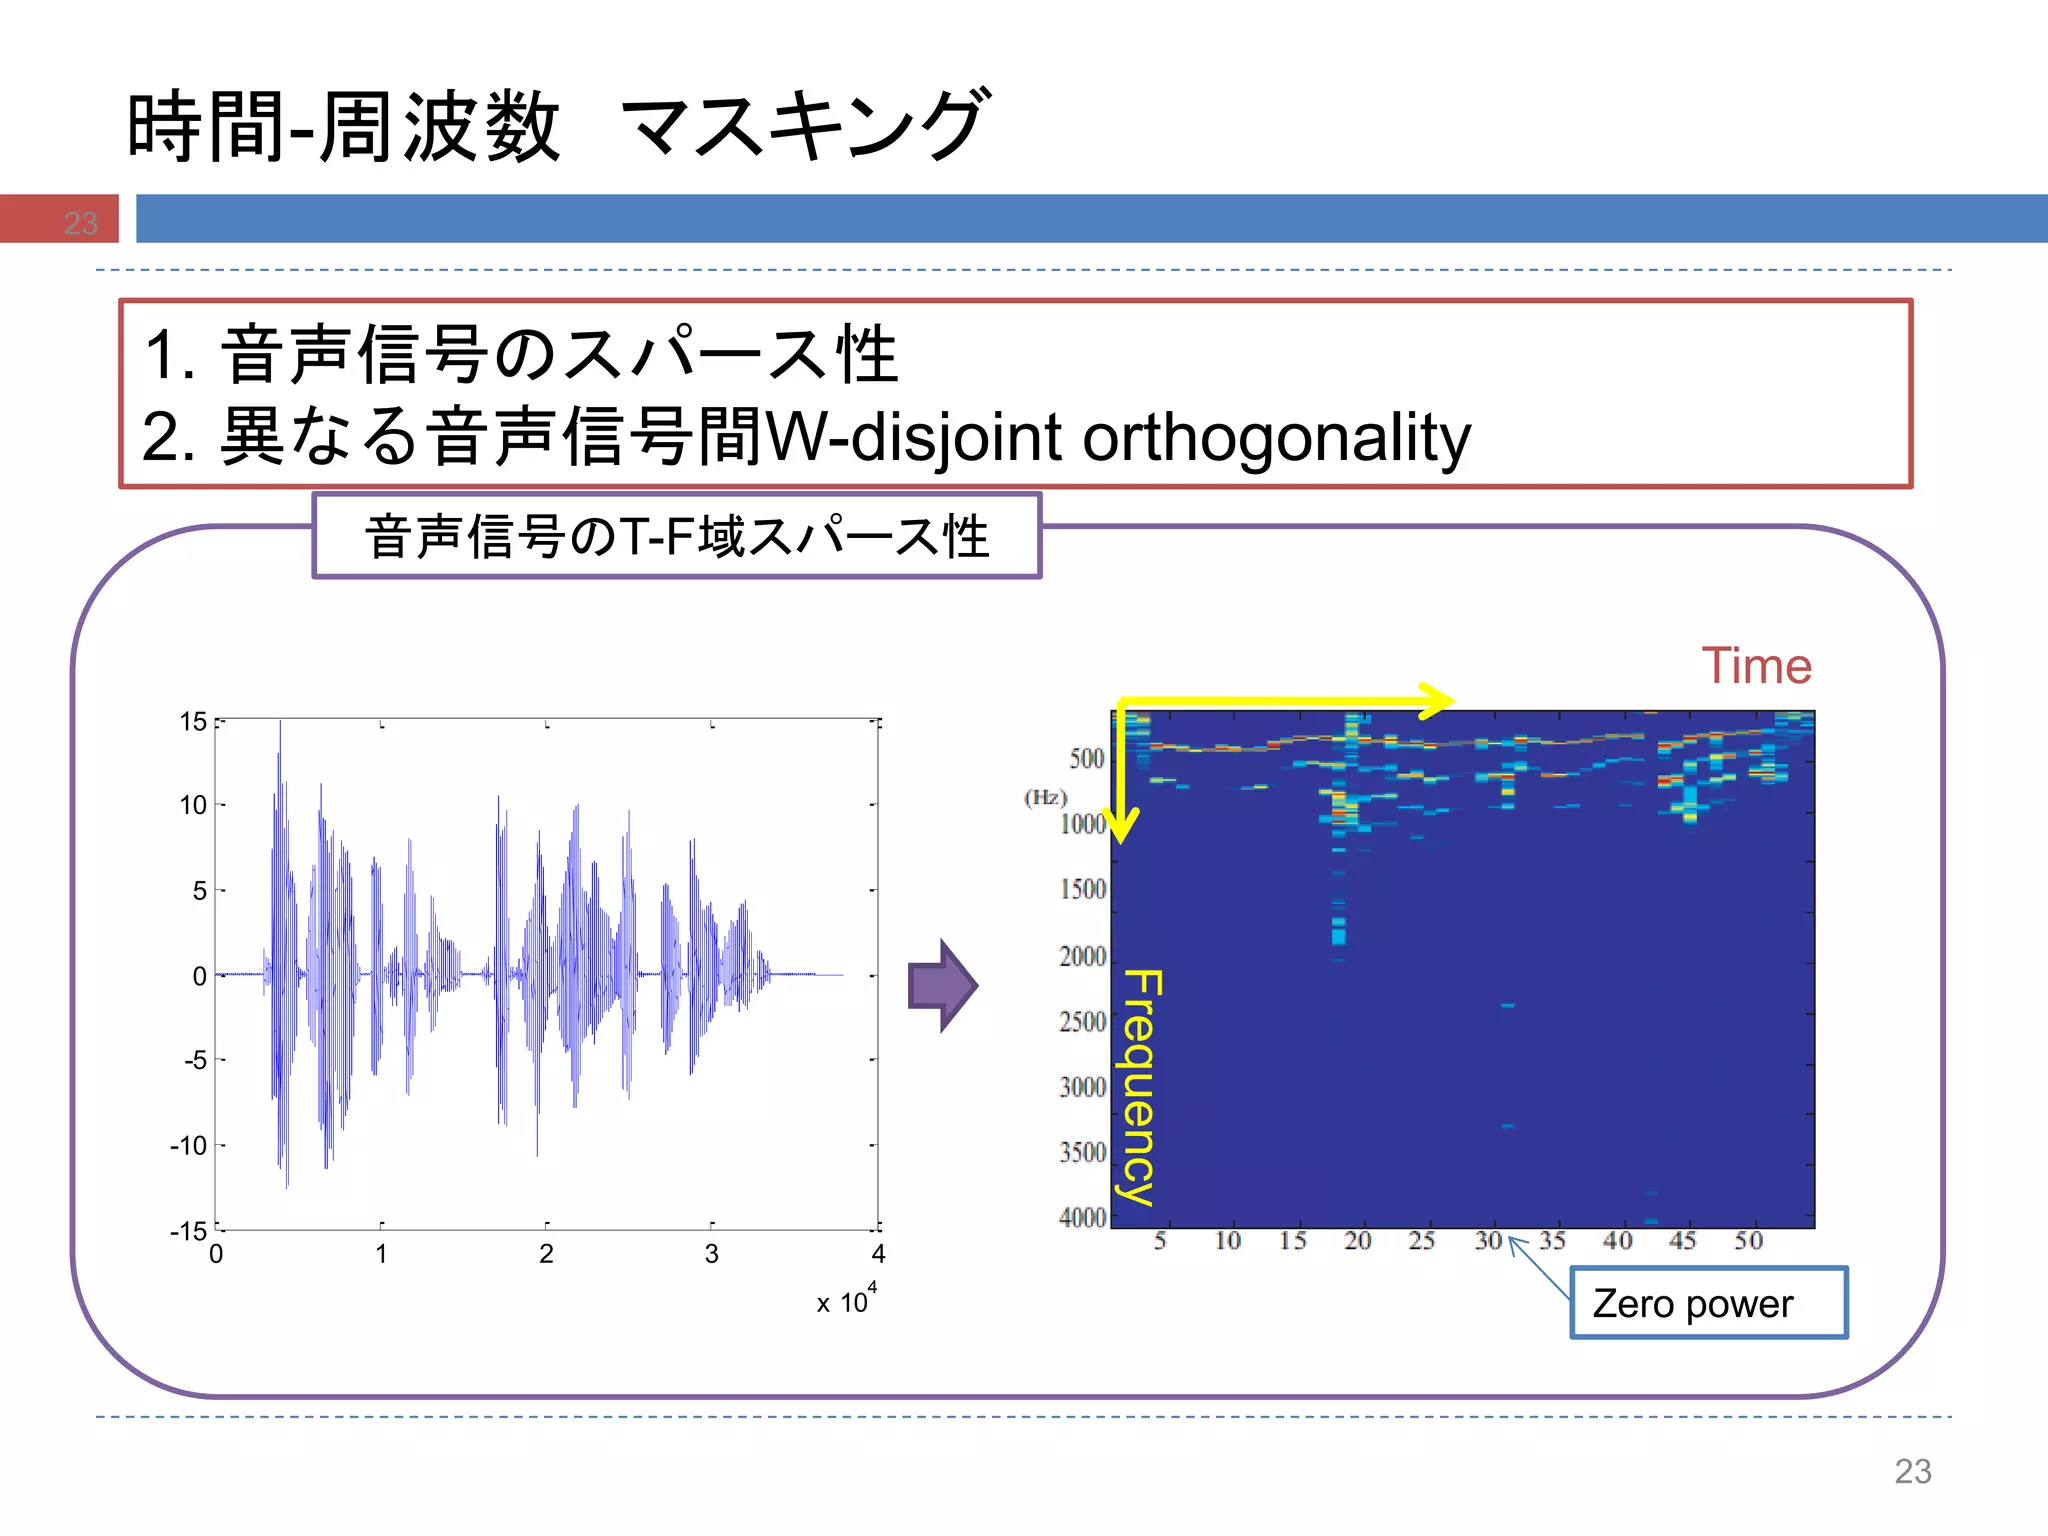
W-Disjoint orthogonality (WDO性)
25
Eventhe received signals are mixture signals, each cell in time-frequency
domain is at most dominant by one source.
スペクトログラムの積はほぼゼロとなる.
Time
index
Frequency index
],[1 lkS ],[2 lkS
0],[],[ 21 lkSlkS
25
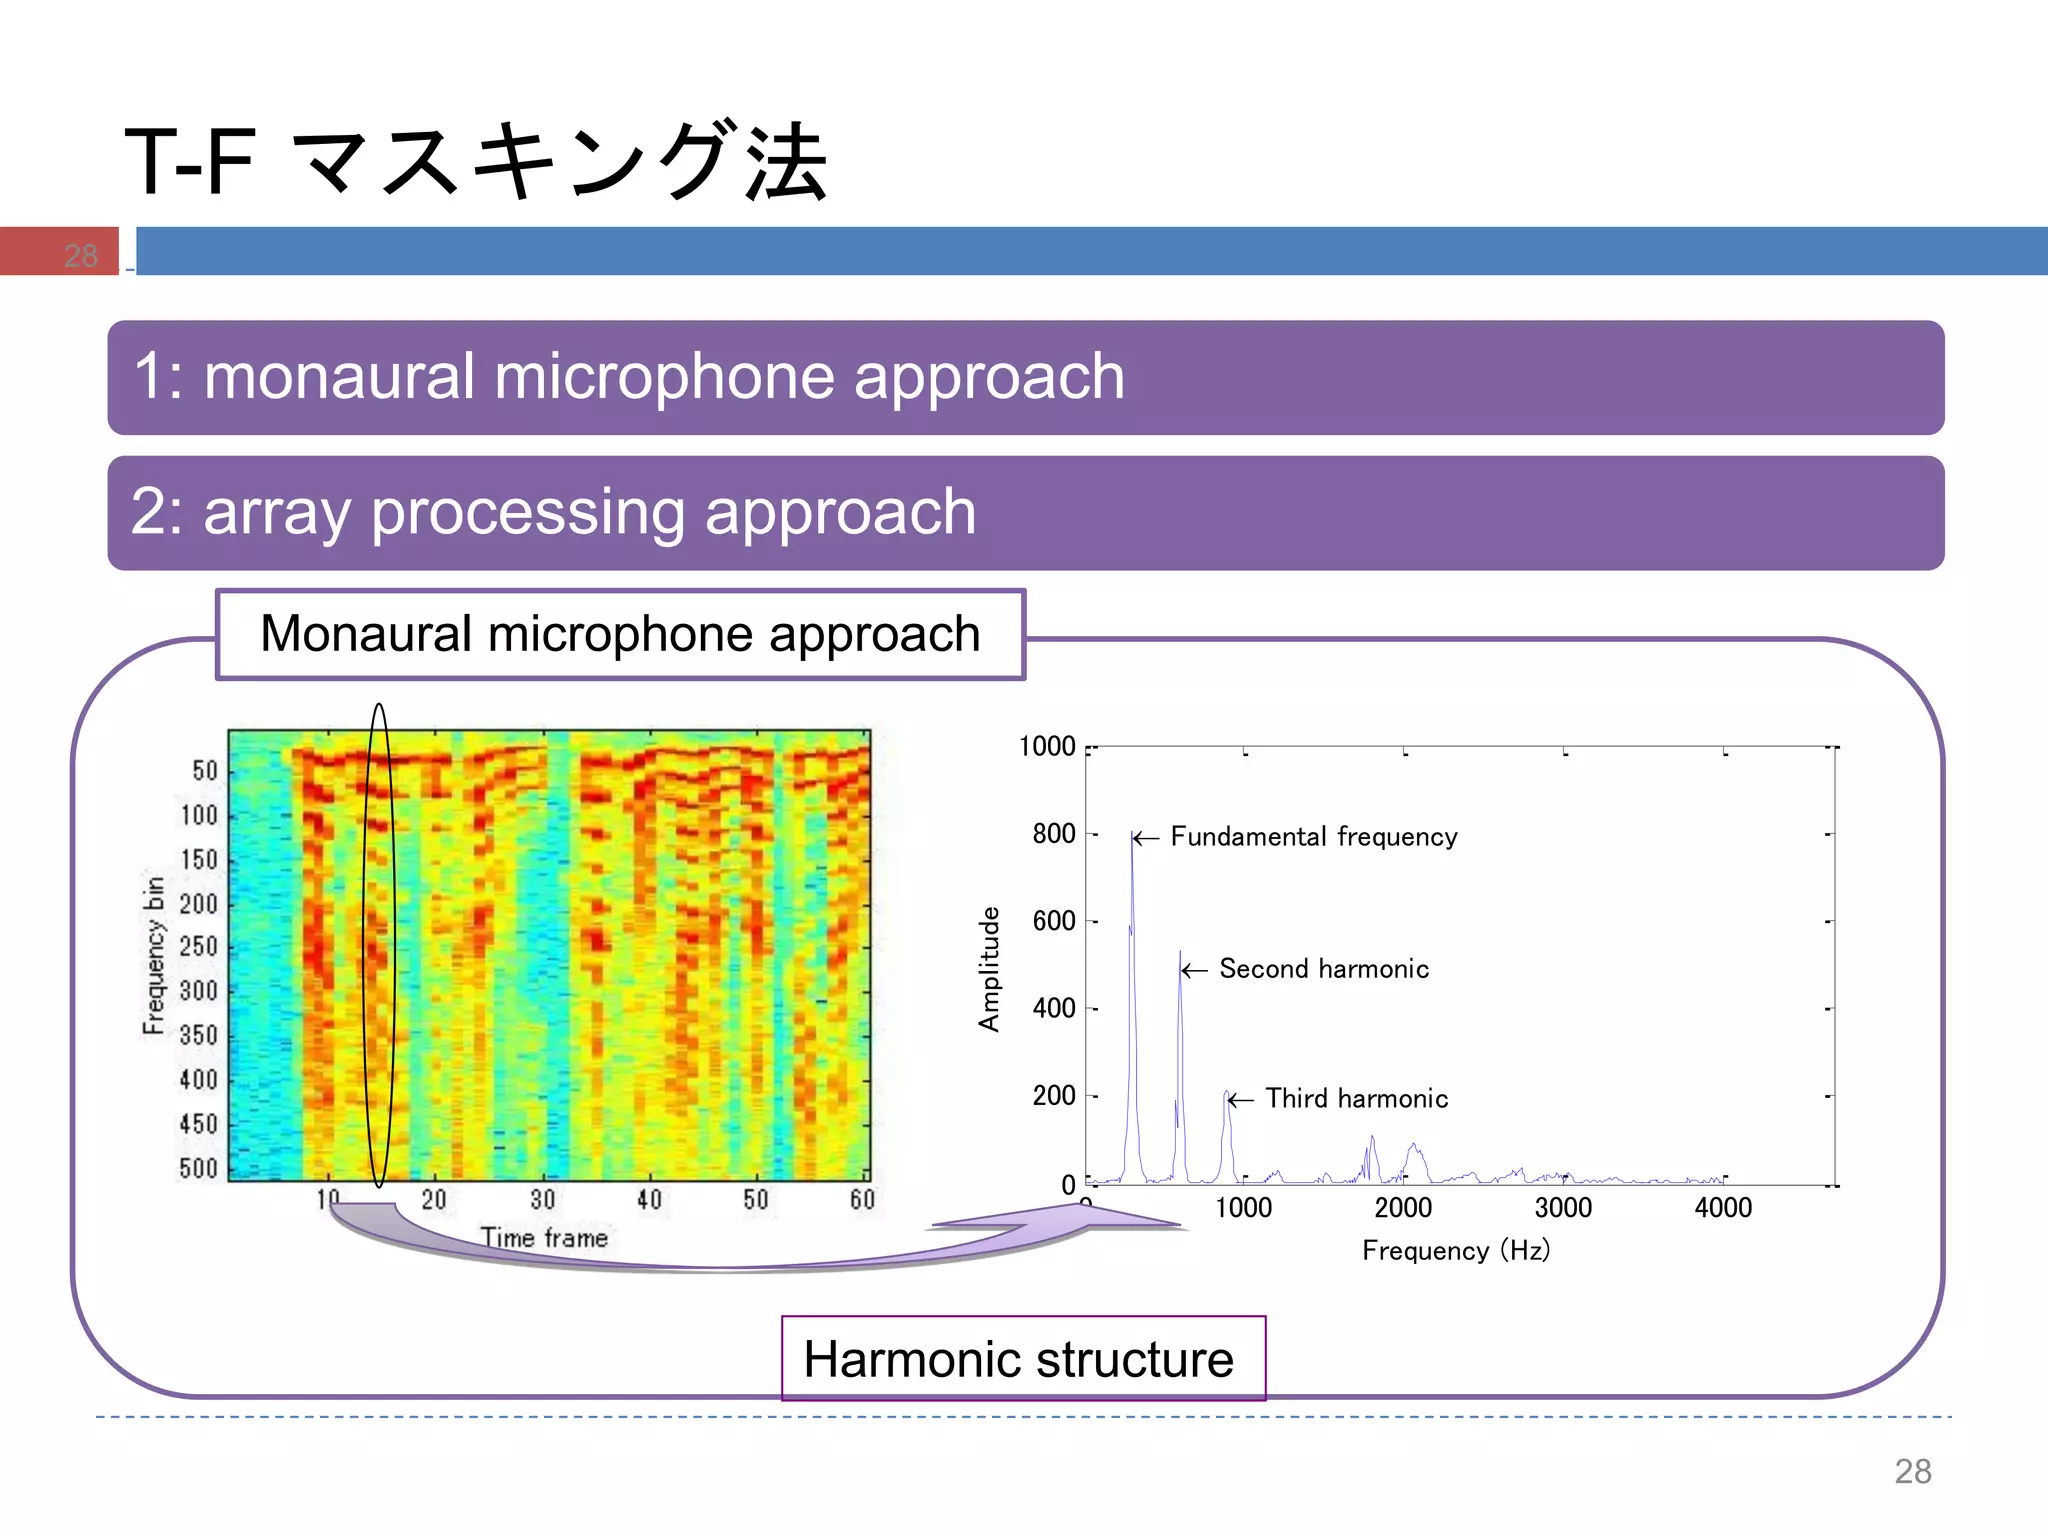
T-F マスキング法
1: monauralmicrophone approach
2: array processing approach
28
Monaural microphone approach
0 1000 2000 3000 4000
0
200
400
600
800
1000
Fundamental frequency
Second harmonic
Third harmonic
Frequency (Hz)
Amplitude
Harmonic structure
28
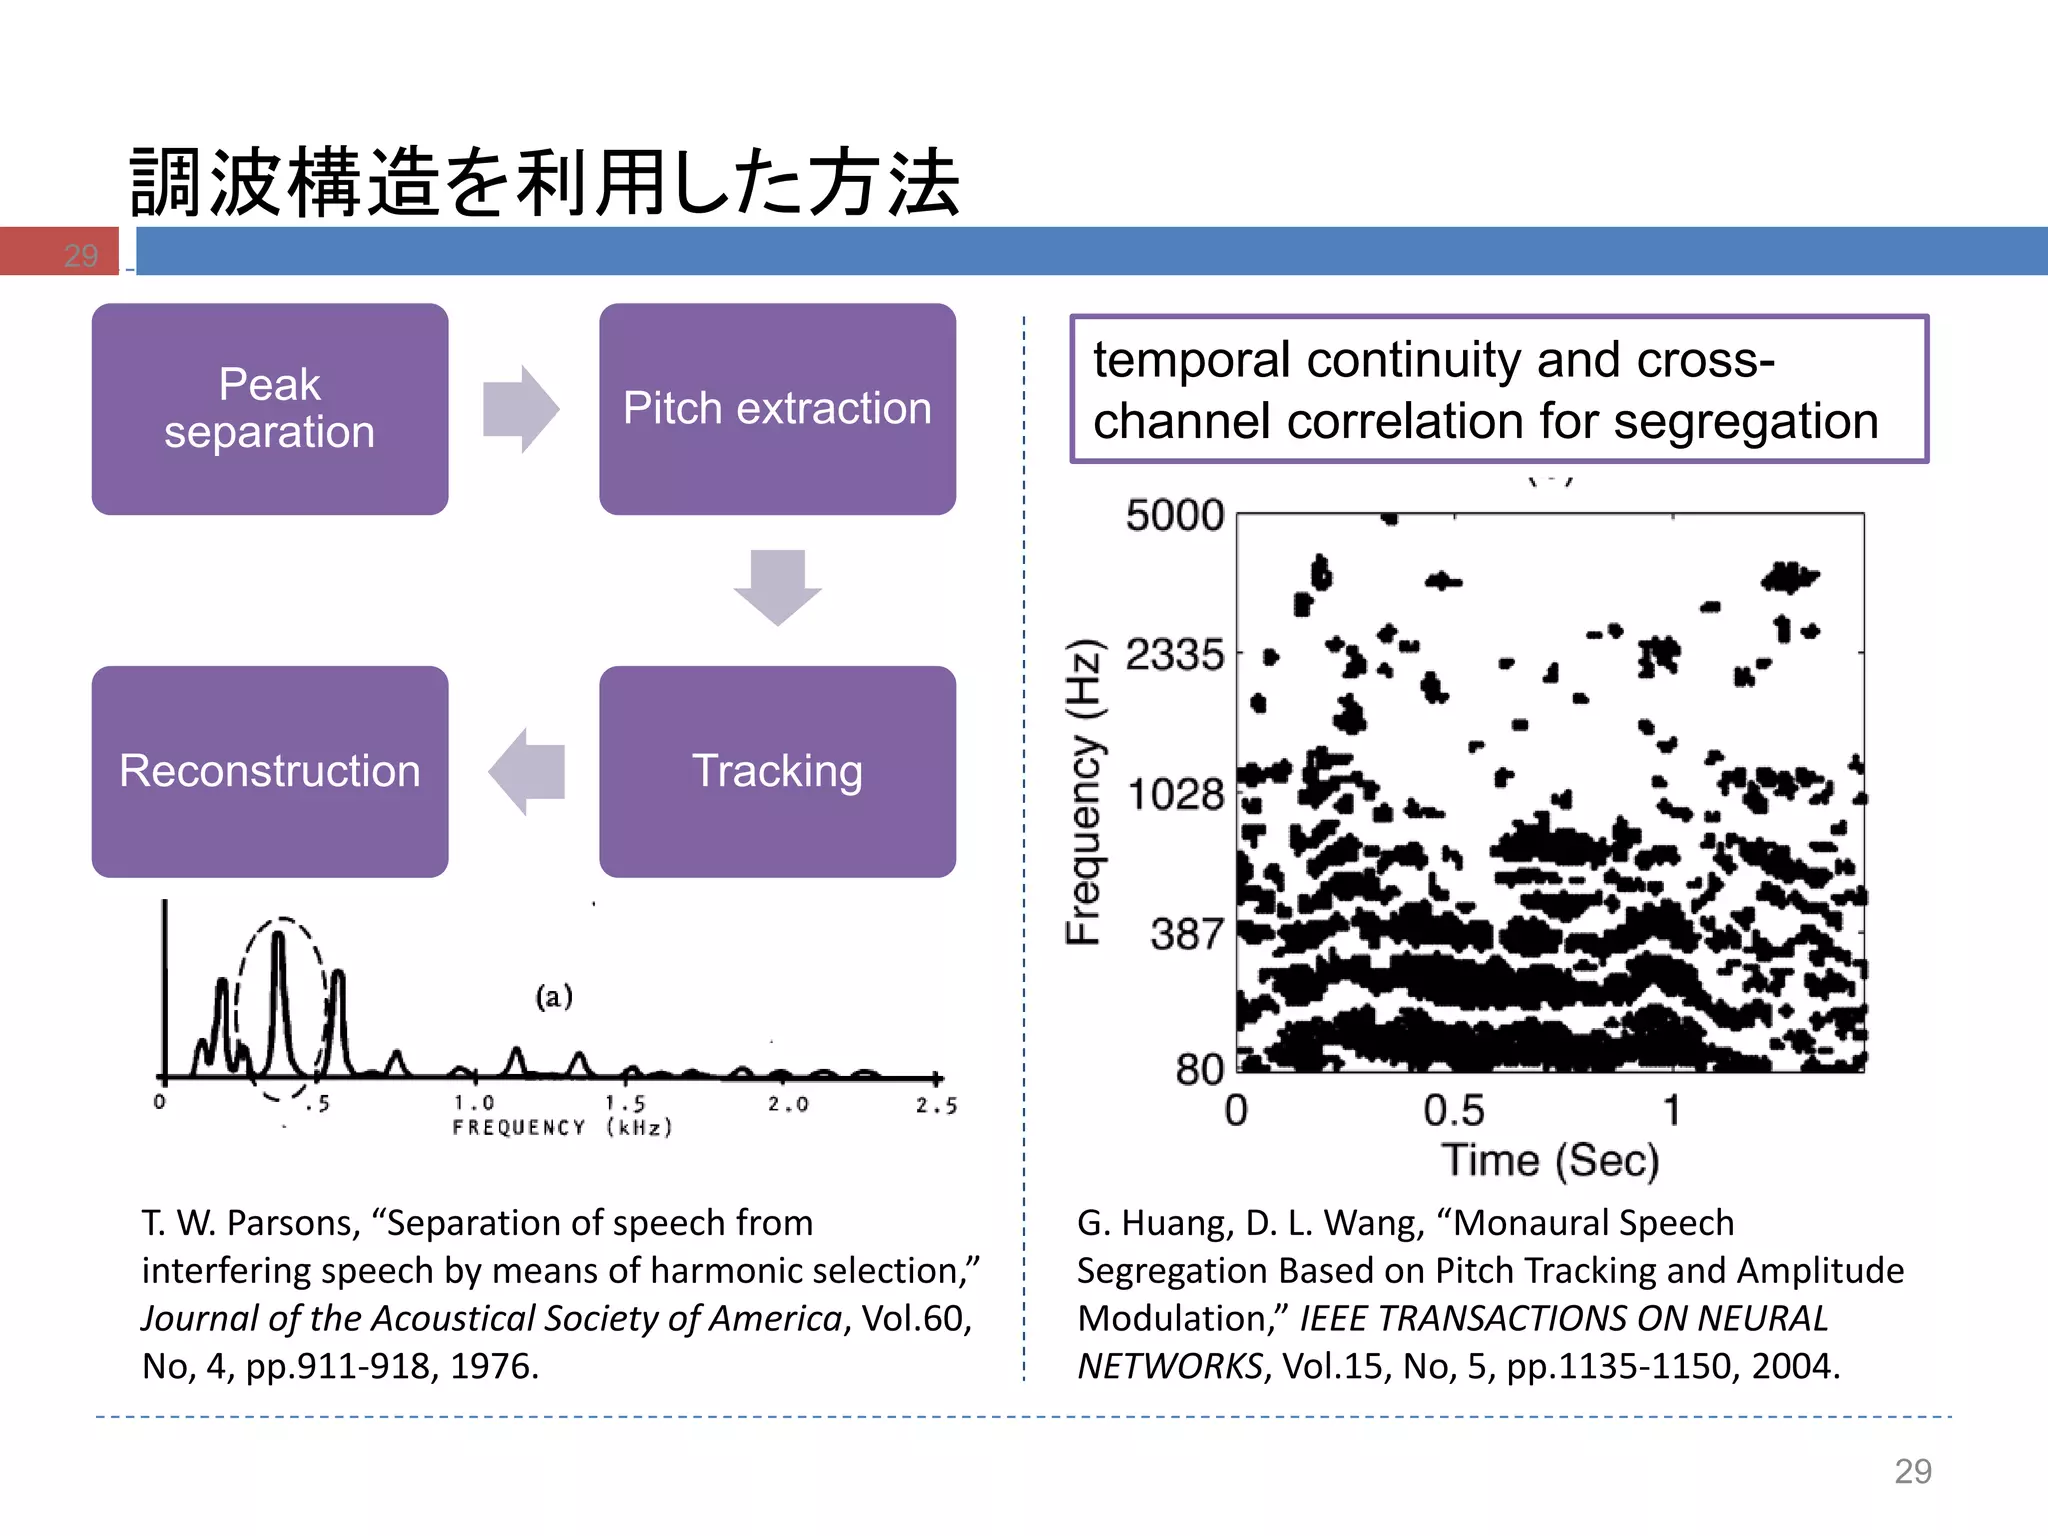
29.
調波構造を利用した方法
T. W. Parsons,“Separation of speech from
interfering speech by means of harmonic selection,”
Journal of the Acoustical Society of America, Vol.60,
No, 4, pp.911-918, 1976.
G. Huang, D. L. Wang, “Monaural Speech
Segregation Based on Pitch Tracking and Amplitude
Modulation,” IEEE TRANSACTIONS ON NEURAL
NETWORKS, Vol.15, No, 5, pp.1135-1150, 2004.
temporal continuity and cross-
channel correlation for segregation
Peak
separation
Pitch extraction
TrackingReconstruction
29
29
3535
Strategy 2: T-Fブロックにおける一致性
Time frame
Frequencybin
2
],[
]),[],[(1],[
qp
lkqplk
])},[],,[min(exp{],[ lklklk ft
Standard deviation
信頼度 指数
region for consistency check
Yylyklkt |,:],[
Zzzlklkf |,:],[
36.
36
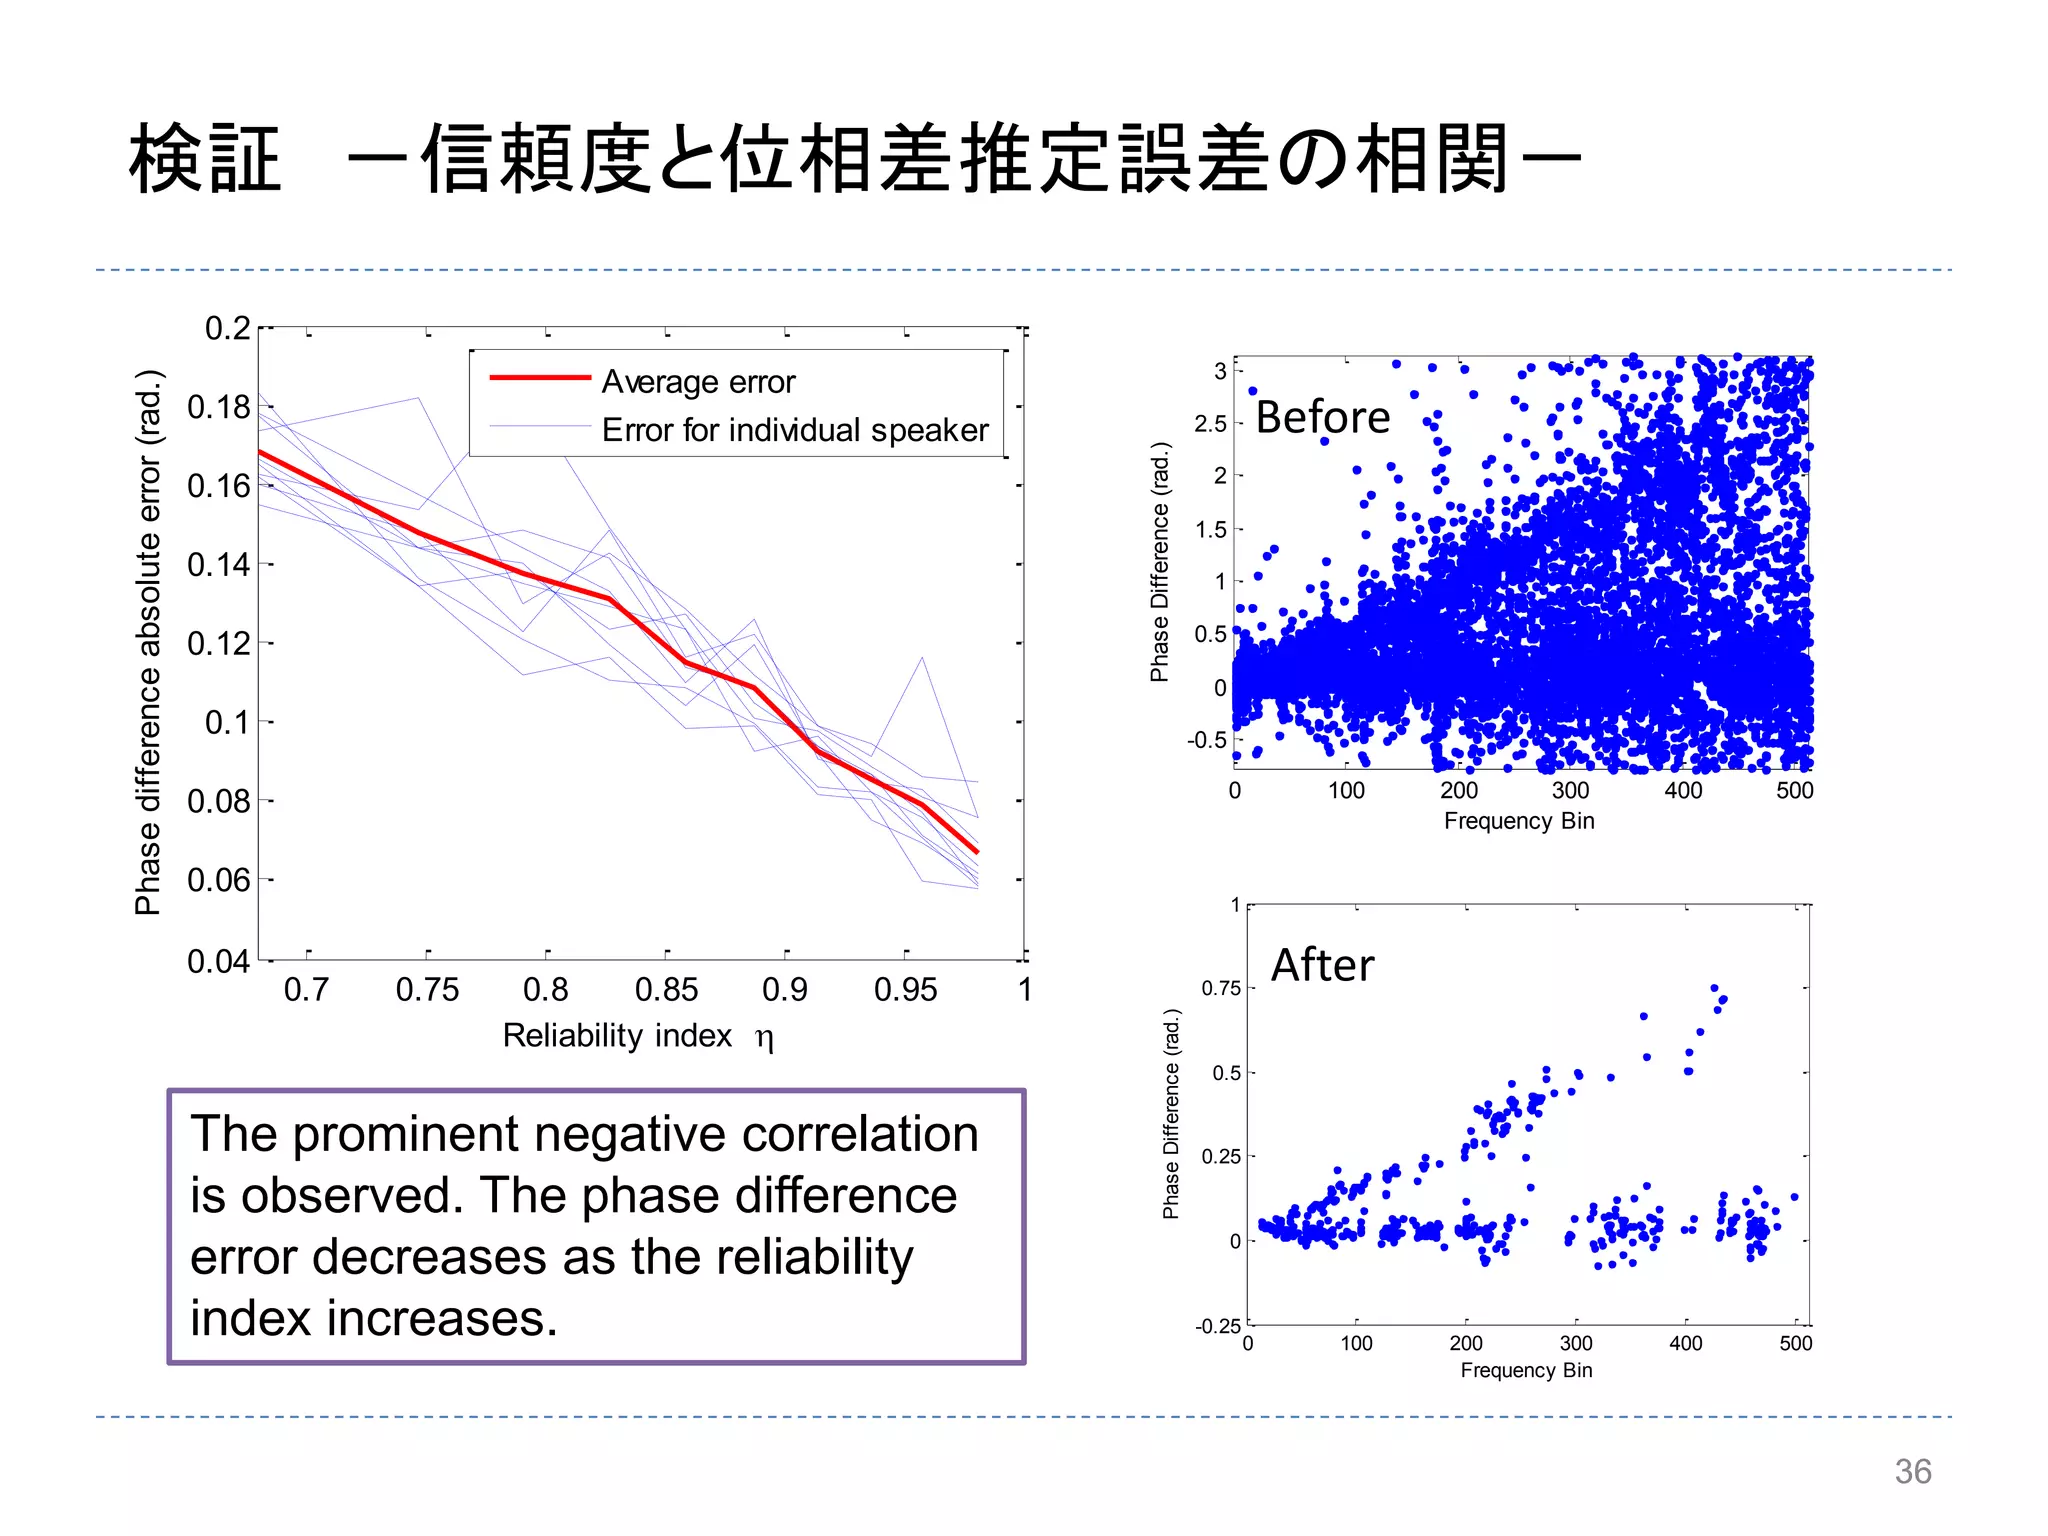
検証 -信頼度と位相差推定誤差の相関-
36
0.7 0.750.8 0.85 0.9 0.95 1
0.04
0.06
0.08
0.1
0.12
0.14
0.16
0.18
0.2
Reliability index
Phasedifferenceabsoluteerror(rad.)
Average error
Error for individual speaker
The prominent negative correlation
is observed. The phase difference
error decreases as the reliability
index increases.
0 100 200 300 400 500
-0.5
0
0.5
1
1.5
2
2.5
3
Frequency Bin
PhaseDifference(rad.)
0 100 200 300 400 500
-0.25
0
0.25
0.5
0.75
1
Frequency Bin
PhaseDifference(rad.)
Before
After
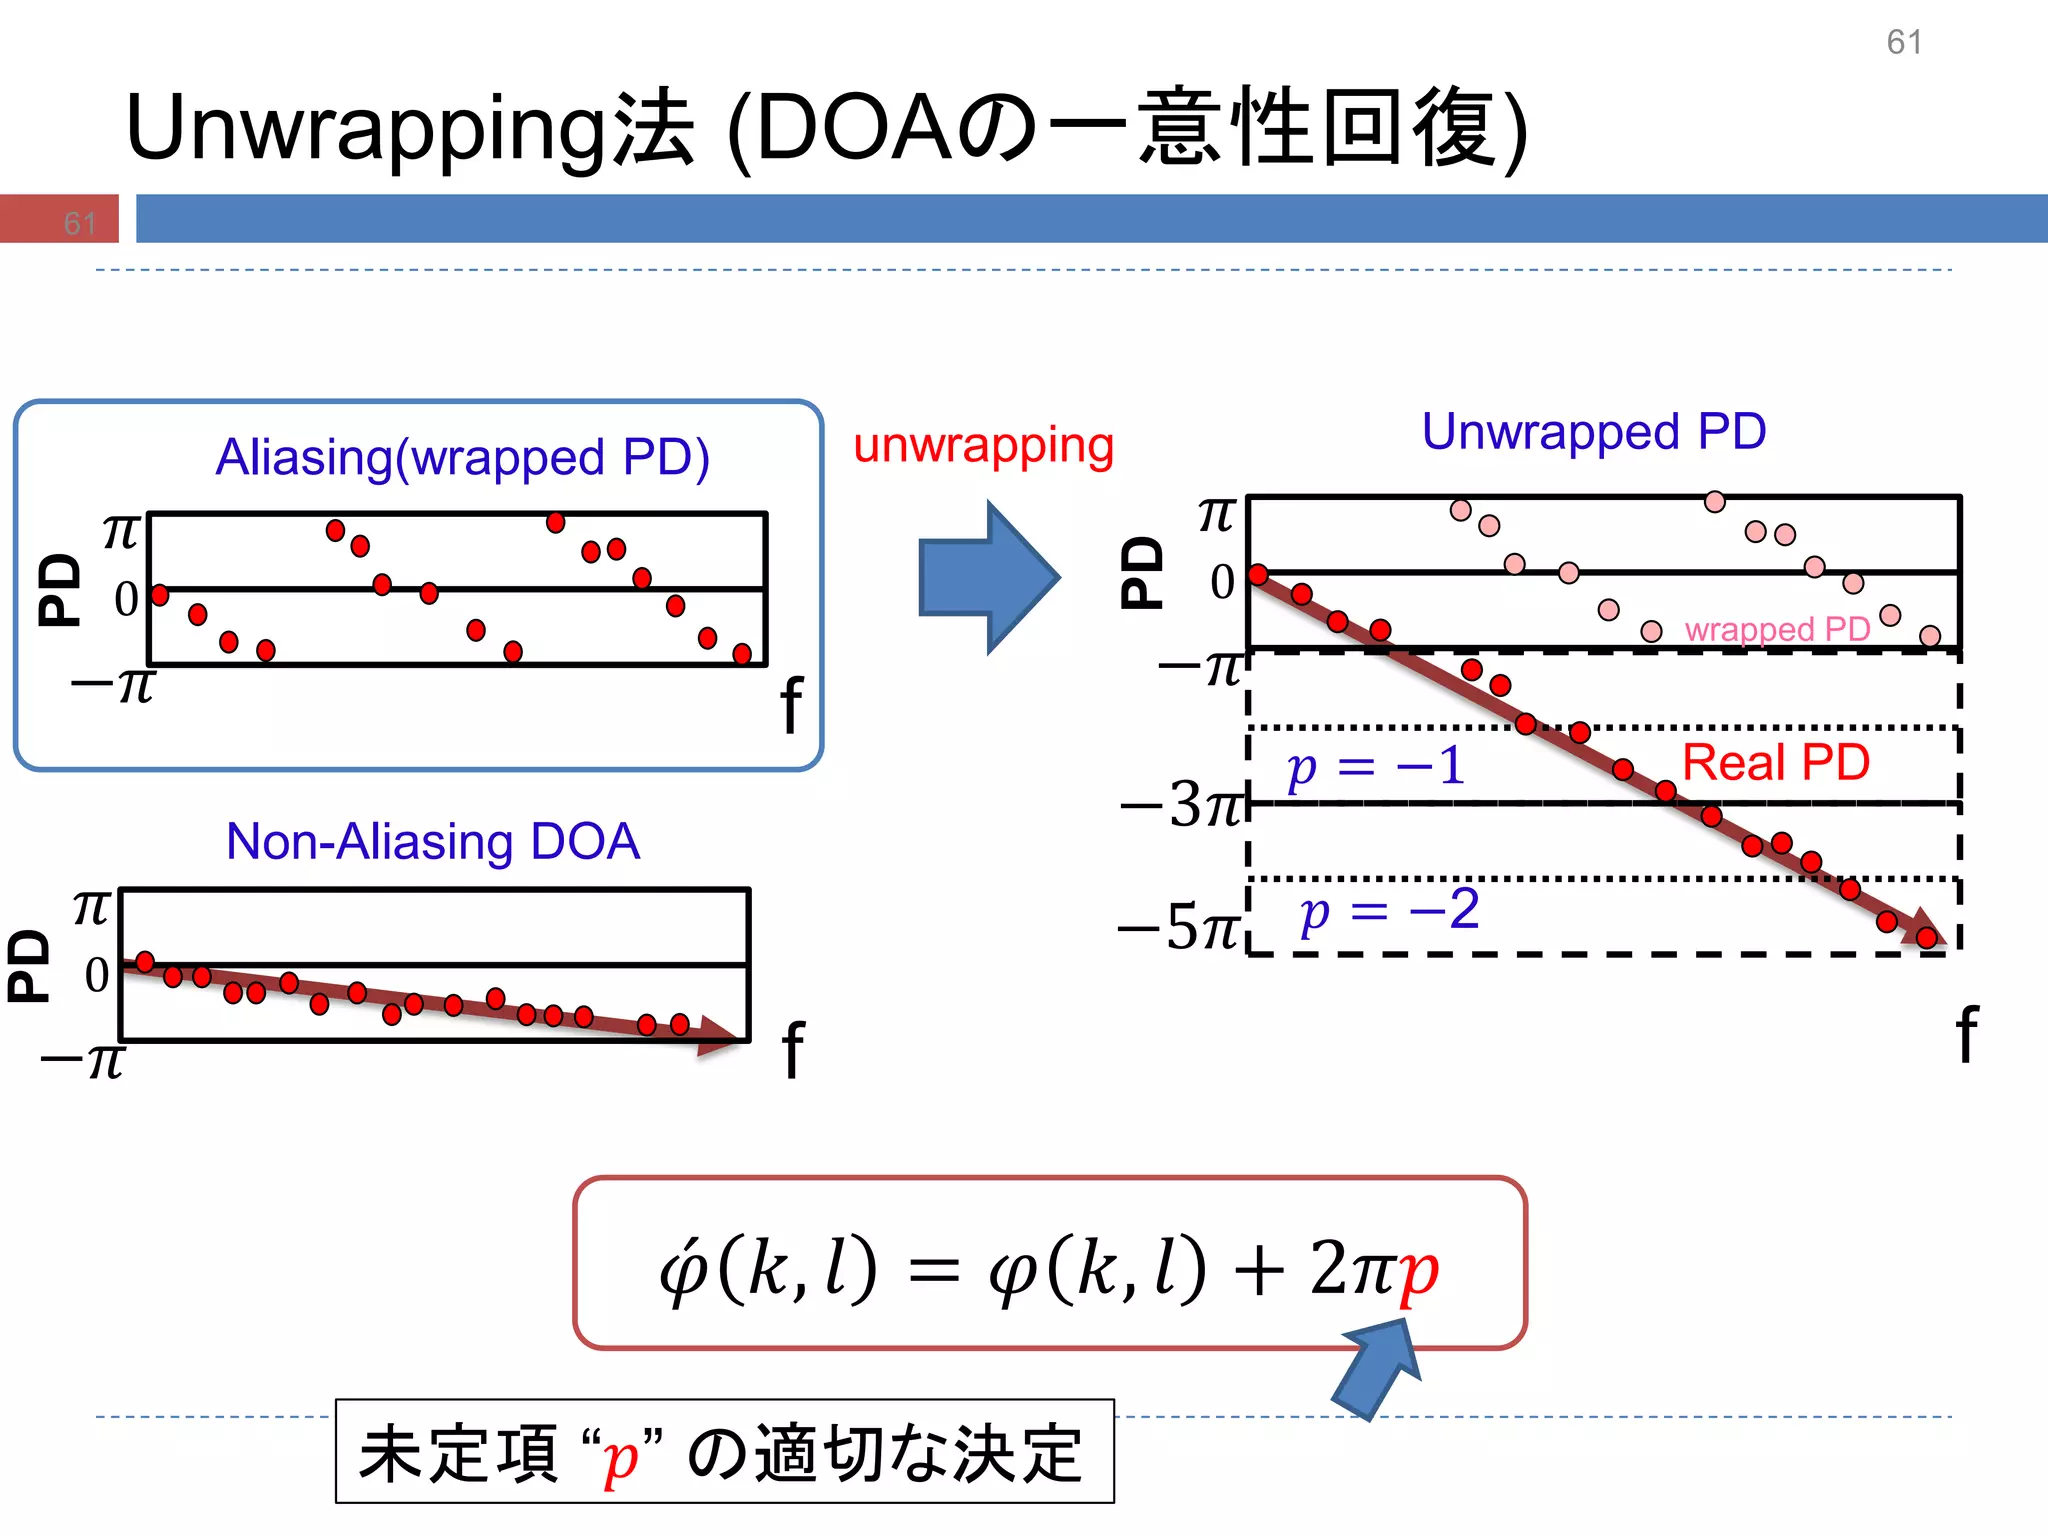
37.
3737
2)カーネル密度推定(KDE)によるアプローチ
cdT /
Lfs /2
00 sinTB
),0(~][ 2
Nl
independent to l
lB0
)(sin)( 1
lT
Random variable
][l
n])[( 0 llB
Phase Difference (ideal)
Phase Difference Error
Direction angle
0 100 200 300 400 500
-0.8
-0.6
-0.4
-0.2
0
0.2
0.4
0.6
0.8
Frequency bin l
PDestimationerror(rad.)
Average
Standard deviation
Individual direction
Experimental verification of phase
difference error which is
independent to frequency bin.
37
38.
誤差伝搬モデル
If the randomvariable is given by and is
sufficient small, the probability function of is given by
),0(~][ 2
Nl
])[,(~ 2][
lN nn
l
n
nlT
ln
cos
1
][
][l
][l
n
1. DOA 推定誤差分布の定式化
2. 誤差分布の違いをカーネル密度推定に利用する
PD distribution
DOA estimation distribution
38
0 100 200 300 400 500
-0.5
0
0.5
1
1.5
2
2.5
3
Frequency Bin
PhaseDifference(rad.)
Source 1
Source 2
39.
-10 -8 -6-4 -2 0 2 4 6 8 10
0
0.5
1
1.5
2
2.5
x
Histogram
3939
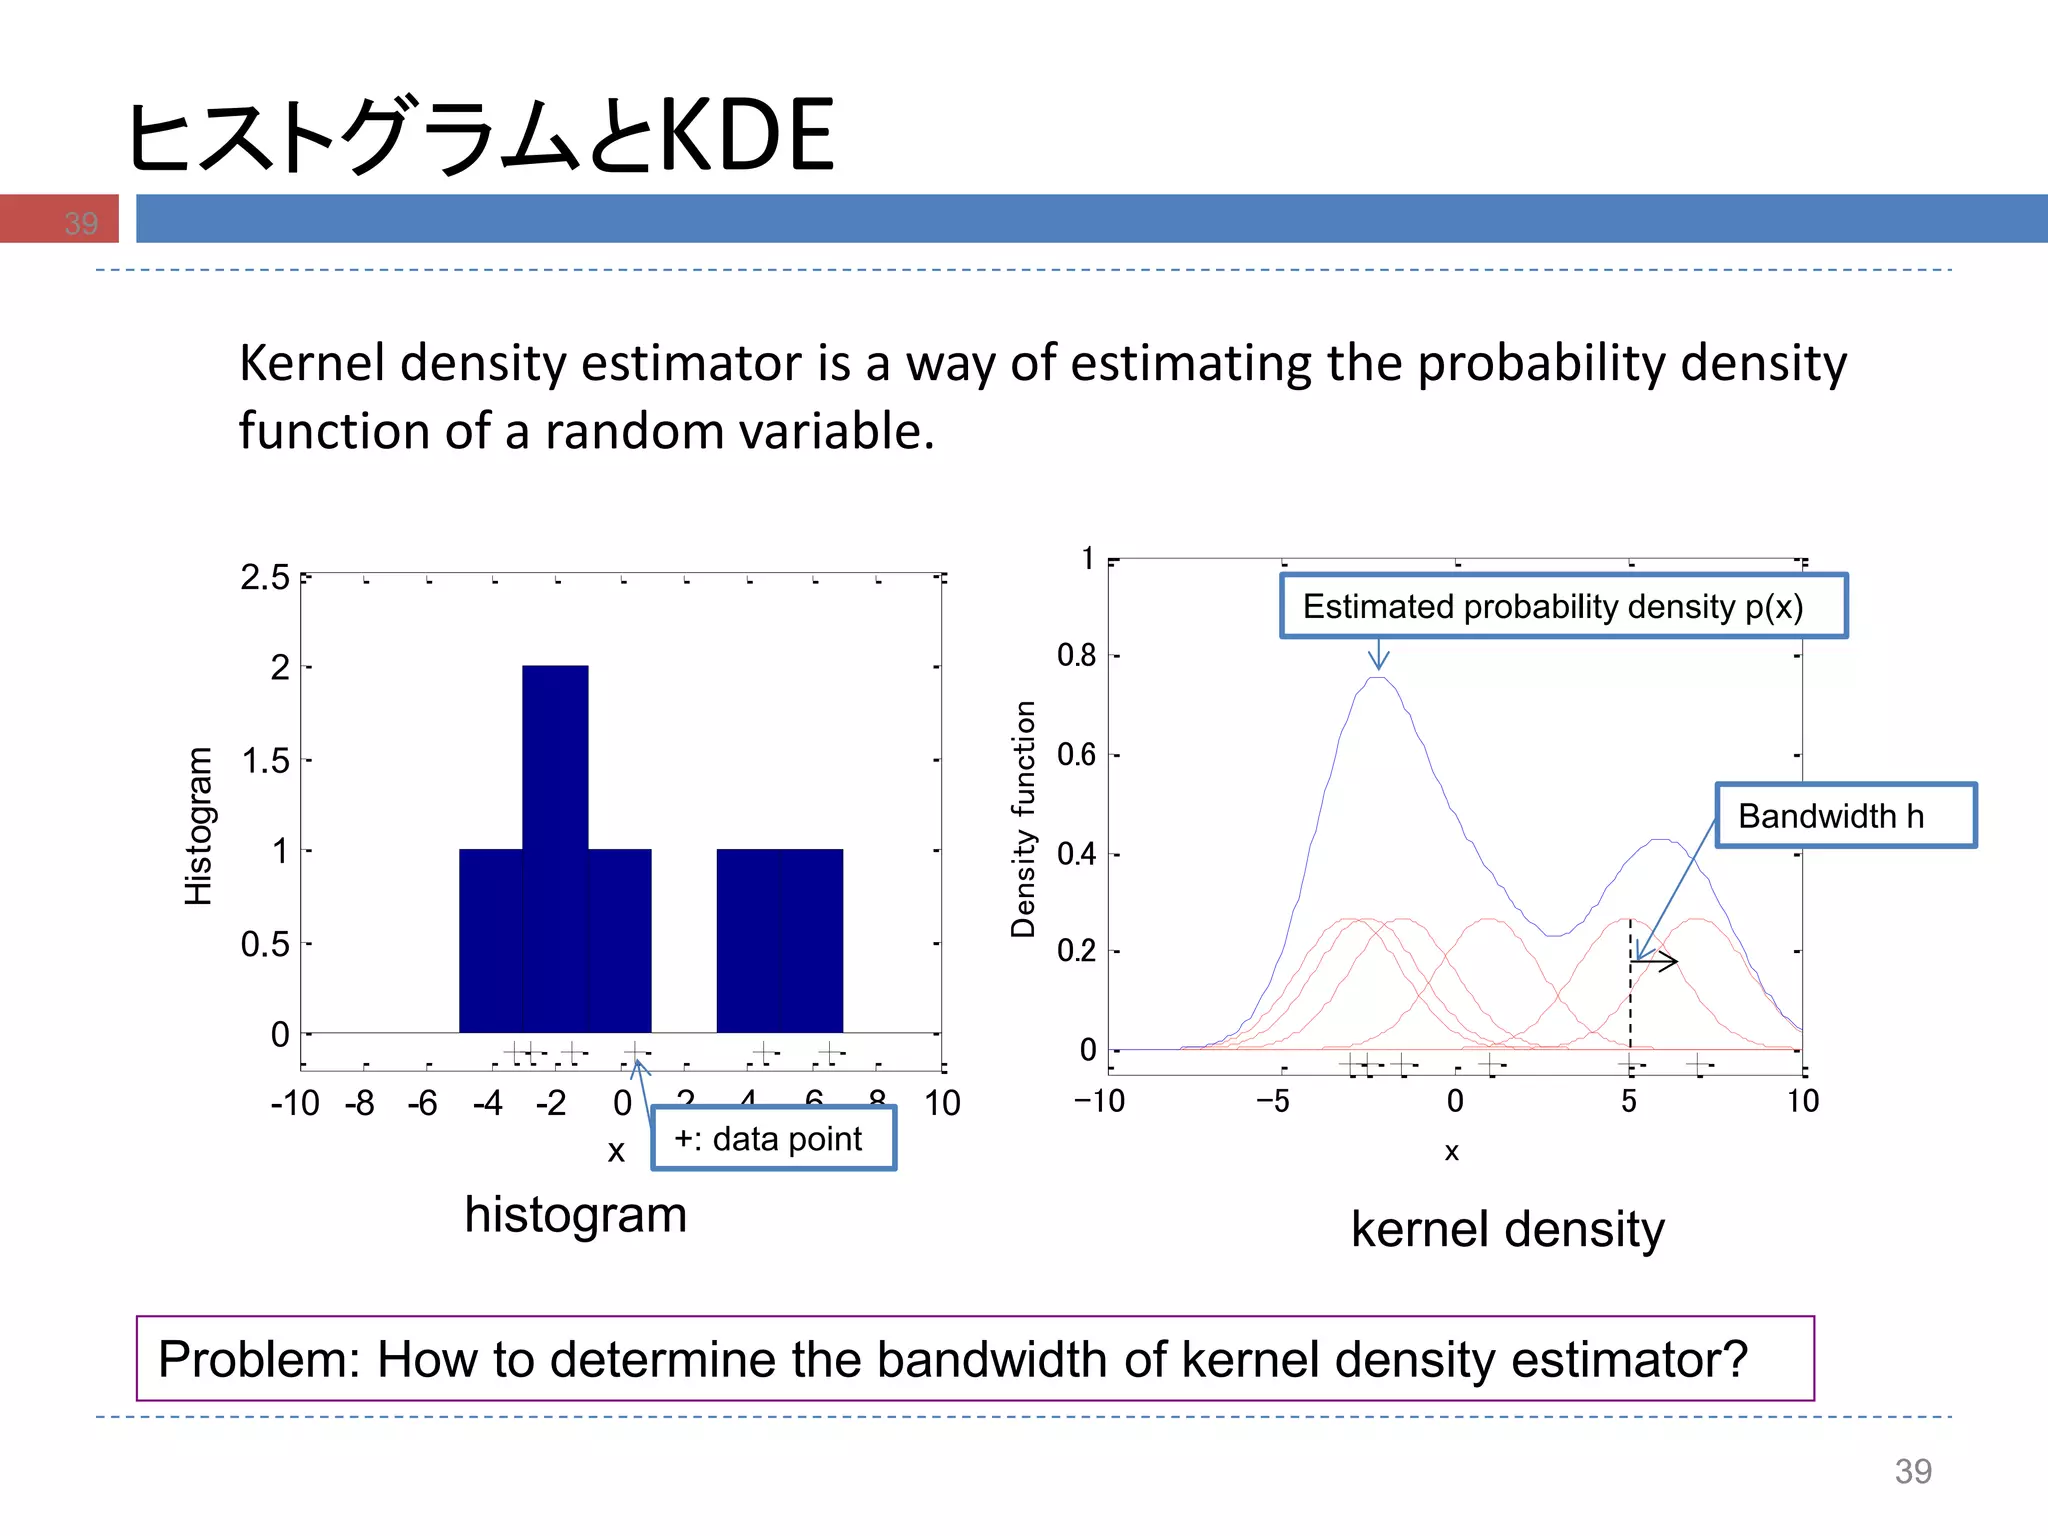
ヒストグラムとKDE
Kernel density estimator is a way of estimating the probability density
function of a random variable.
histogram kernel density
Problem: How to determine the bandwidth of kernel density estimator?
-10 -5 0 5 10
0
0.2
0.4
0.6
0.8
1
x
Densityfunction
+: data point
Estimated probability density p(x)
Bandwidth h
39
40.
KDEにおけるバンド幅
0 200 400600 800 1000 1200
0
0.2
0.4
0.6
0.8
1
1.2
1.4
誤差大
→バンド幅大
(低信頼度)
誤差小
→バンド幅小
(高信頼度)
I
l
l
i
i
lli
lli
)(
,)(
)
2
)(
exp(
2
1
2
xx
xK
ガウスカーネル
カーネル数
M
i i
l
i
i l
K
lM
p
i
1
][
)
][
(
][
11
)(
40
42
DOA 推定 –KDE法–
42
M
i i
l
i
i l
K
lM
p
i
1
][
)
][
(
][
11
)(
in lTlT
l
cos
1
cos
1
][
Probability density function
Kernel density function
Estimated angle by each cell
Bandwidth of kernel
Bandwidth control parameter
)(
p
K
][ il
i
][ il
The DOA estimation error is related with source direction and frequency .
5.0 2 5
42
i l
42
43.
43
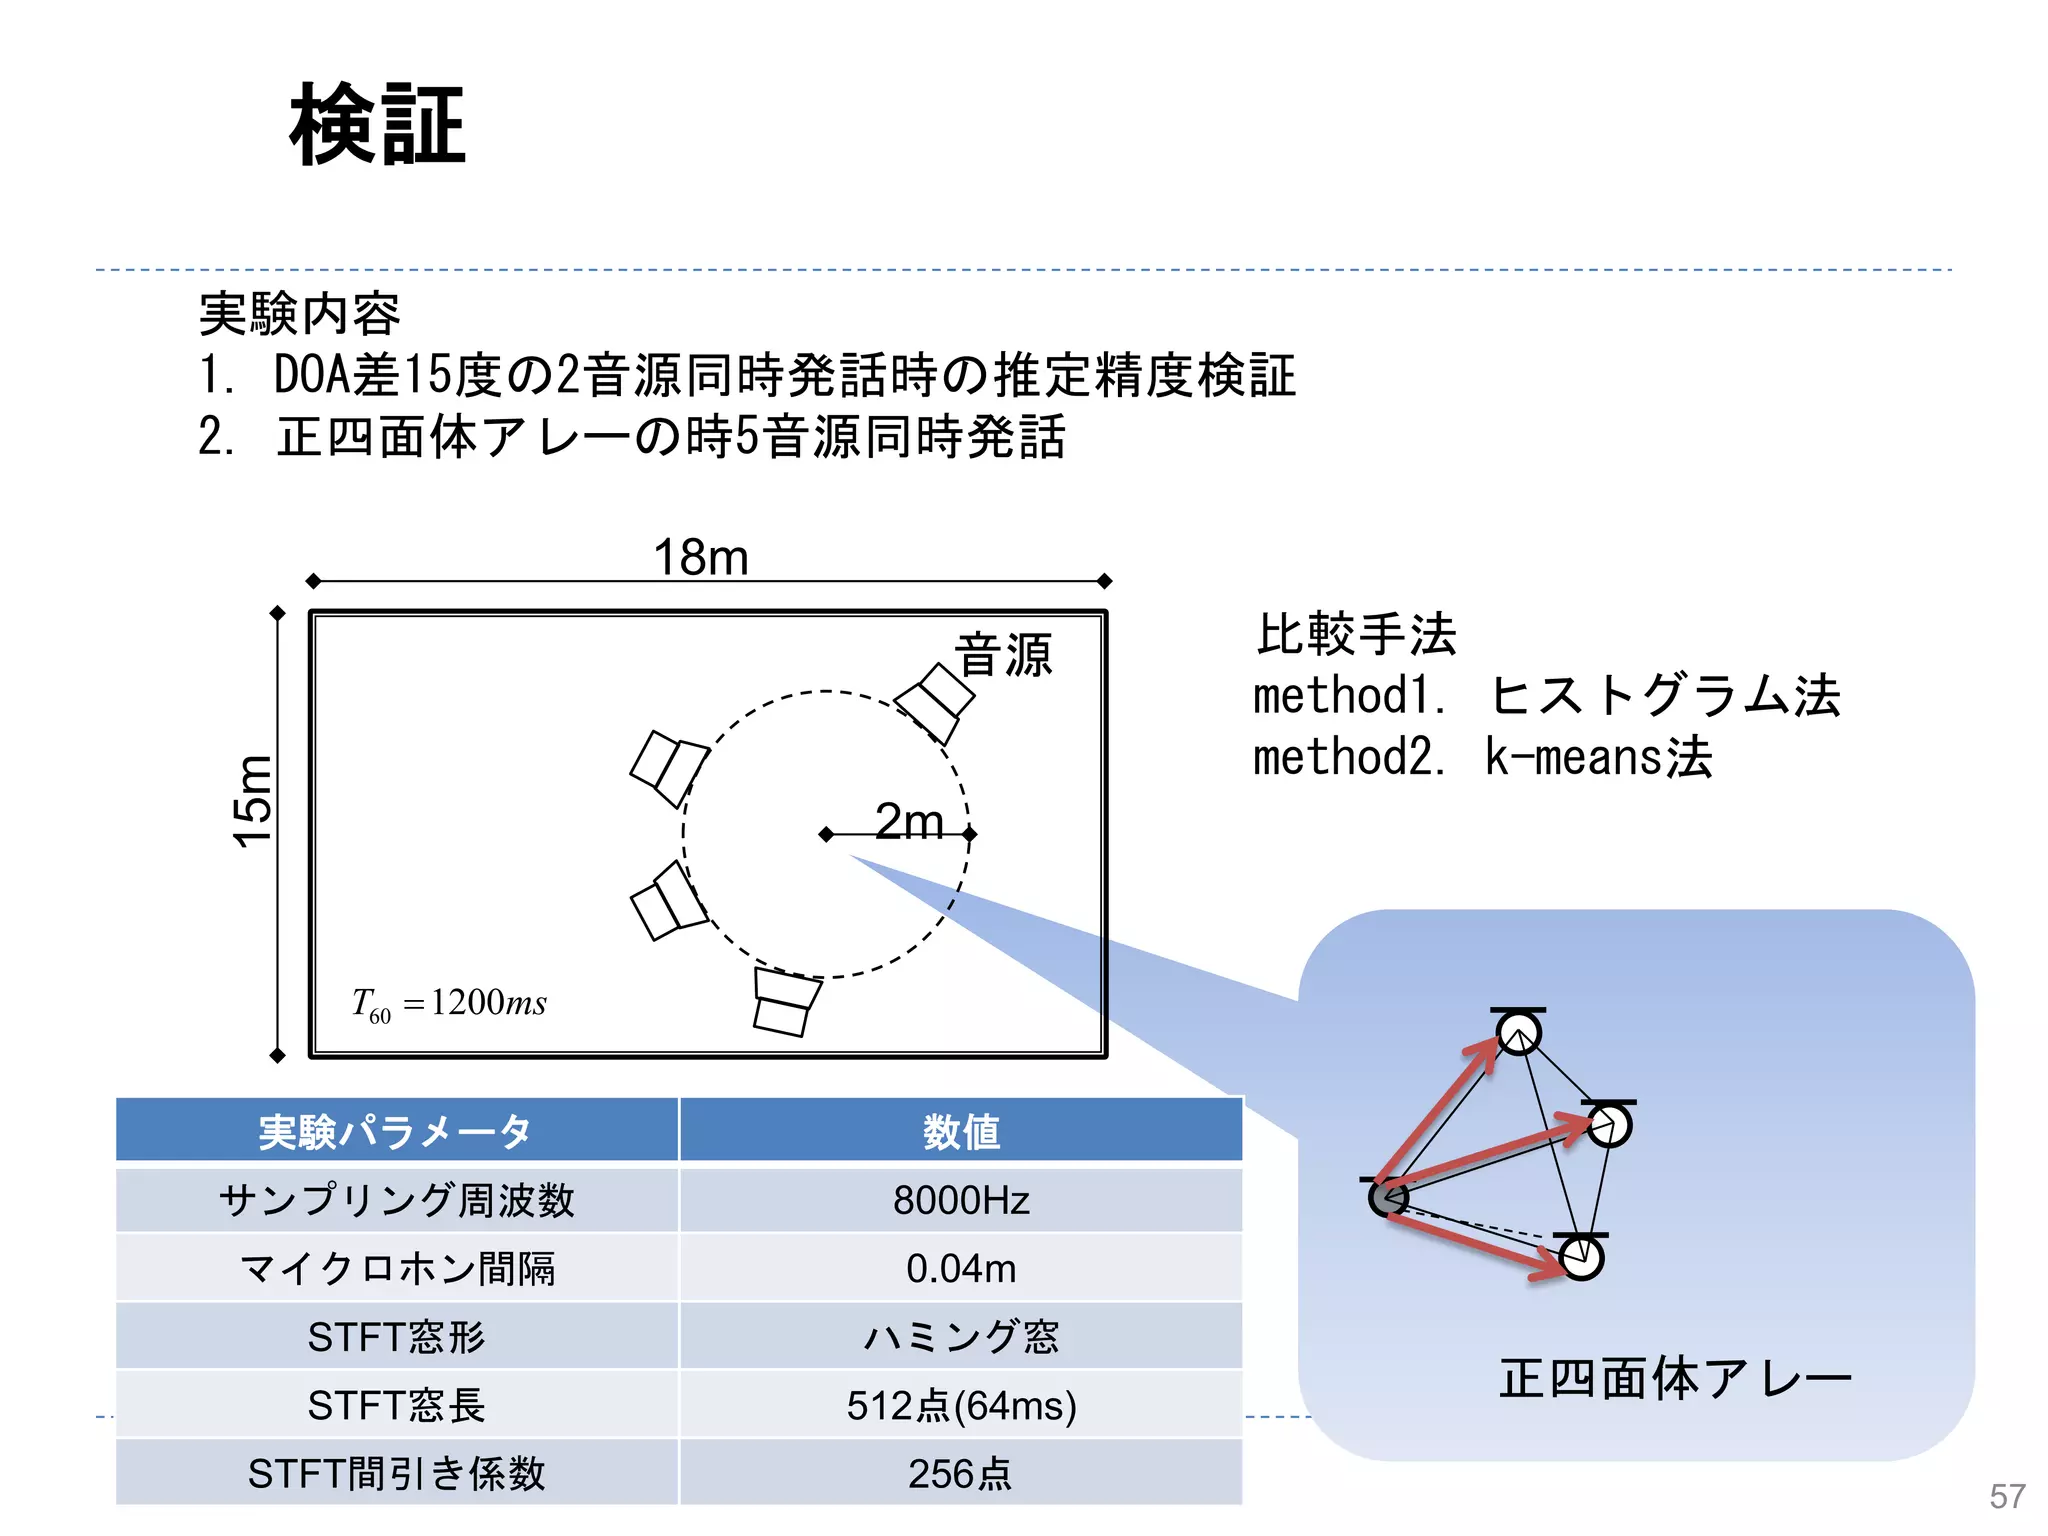
3) 実験
Name Methods
ICA-
based
F.Nesta et al. “Cumulative state coherence
transform for a robust two-channel multiple source
localization,” Proc. ICA, pp.290-297, 2009.
k-means
S. Araki et al. “DOA estimation for multiple sparse
sources with arbitrarily arranged multiple sensors,”
Journal of Signal Processing Systems, vo.63,
pp.265-275, 2009.
比較対象の従来法
43
4646
3音源
0 2 46 8 10
-60
-40
-20
0
20
40
60
CaseDOAestimation(degree)
Close together (-23o
& 4o
& 23o
)
Far apart (-42o
& 4o
& 42o
)
0 2 4 6 8 10
-60
-40
-20
0
20
40
60
Case
DOAestimation(degree)
Close together (-23o
& 4o
& 23o
)
Far apart (-42o
& 4o
& 42o
)
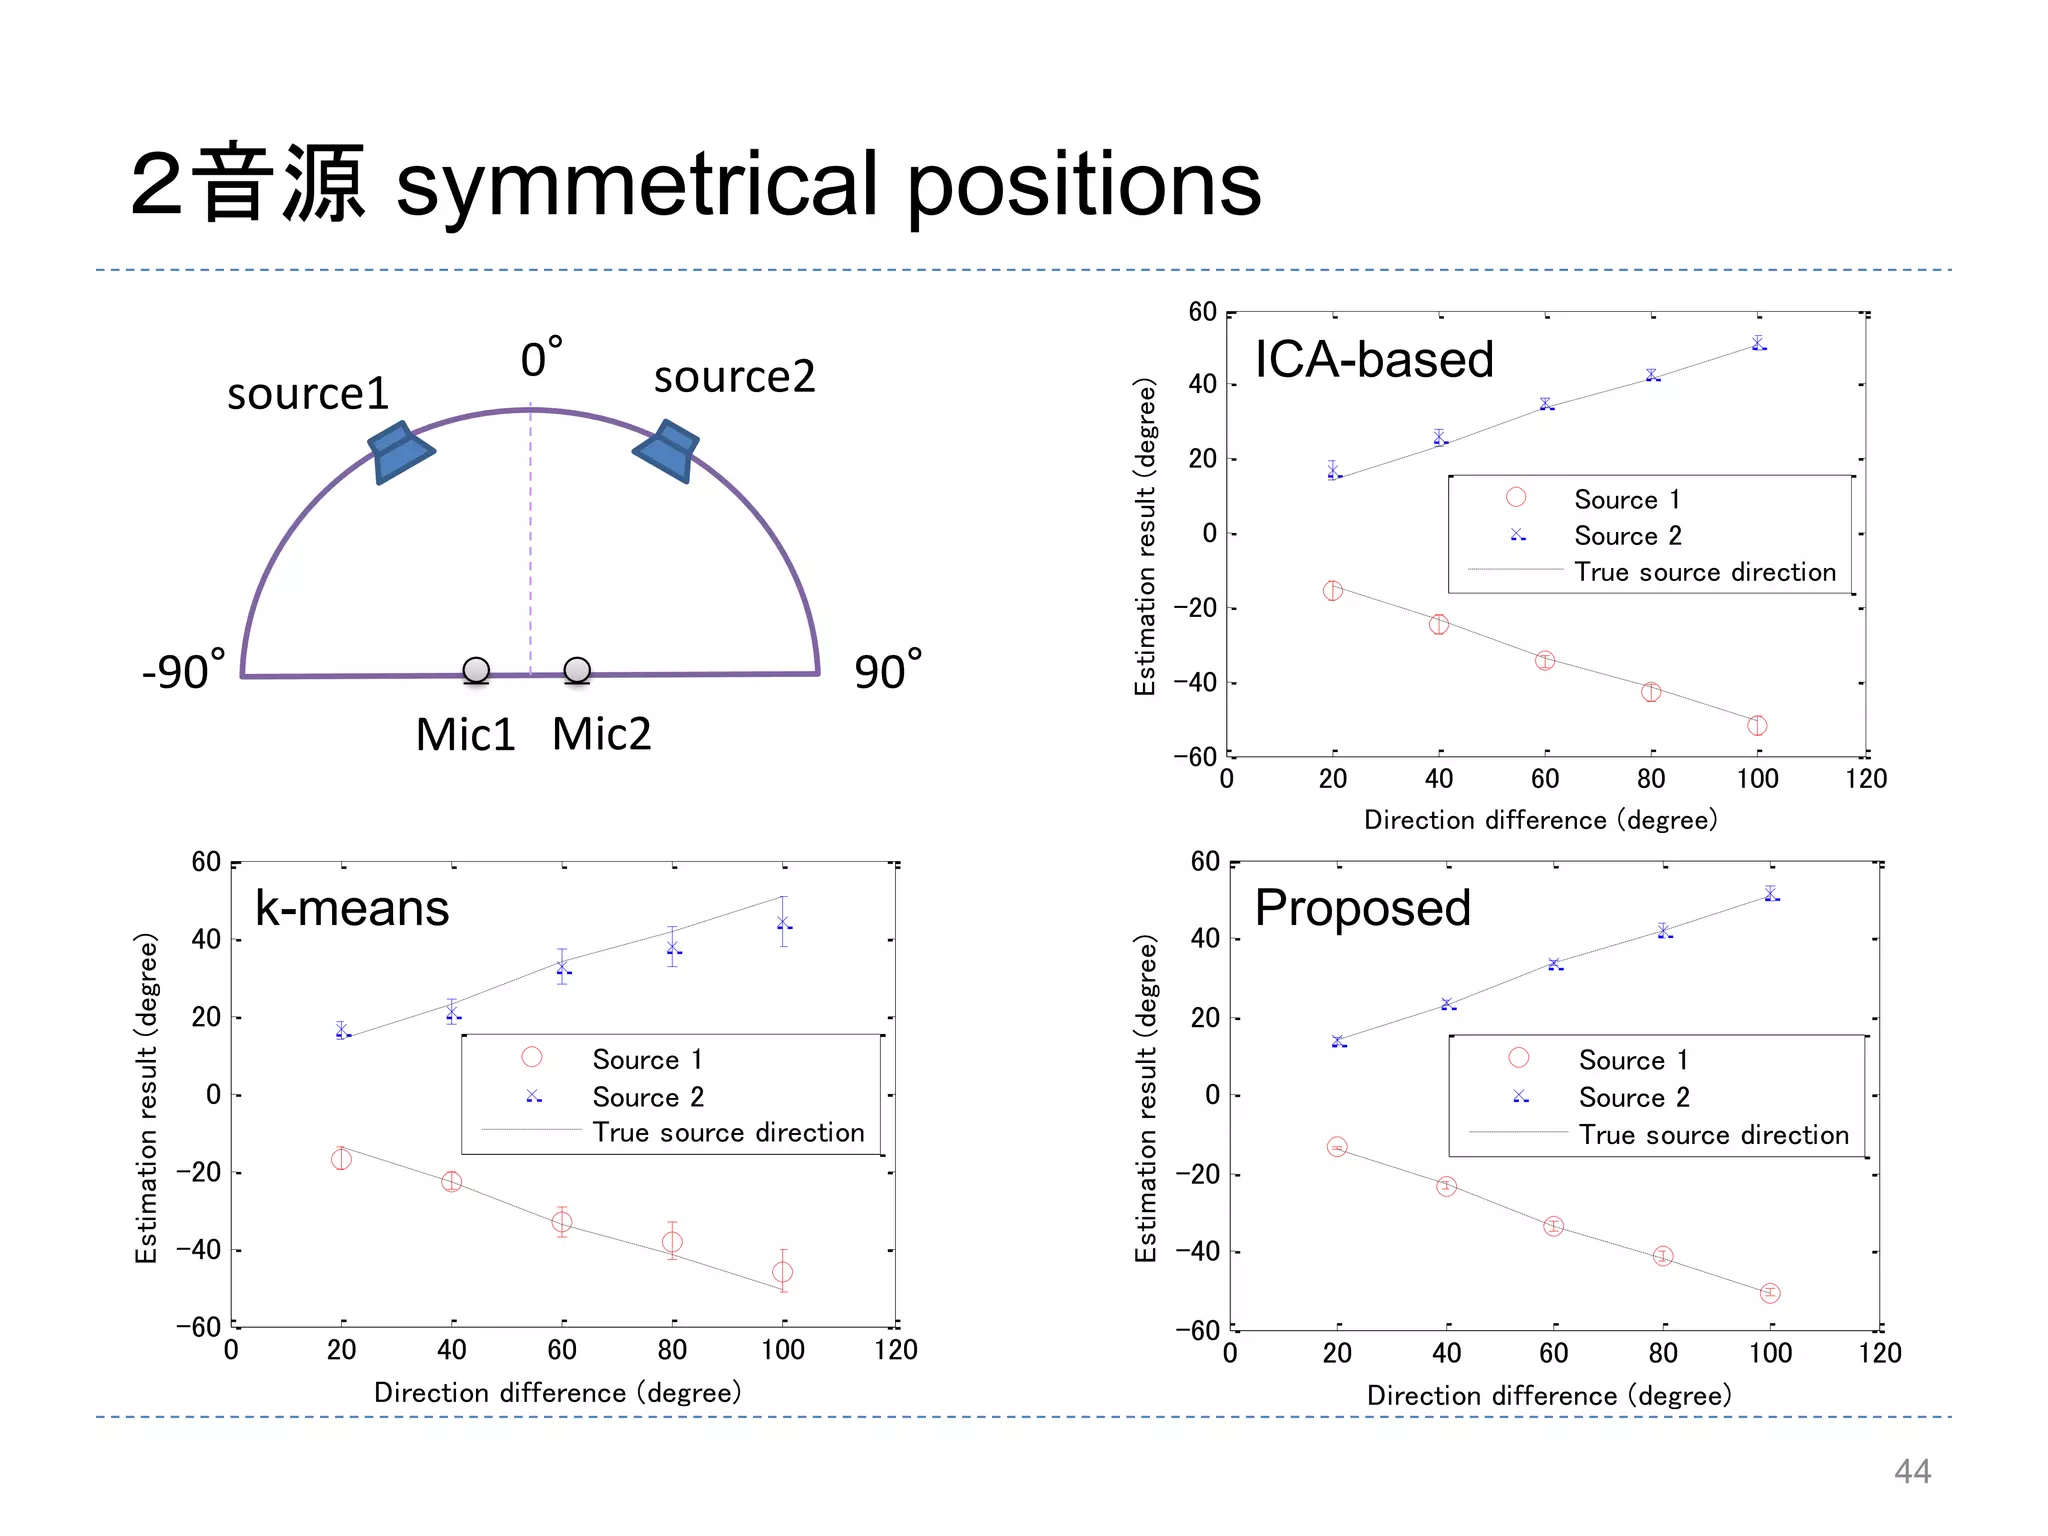
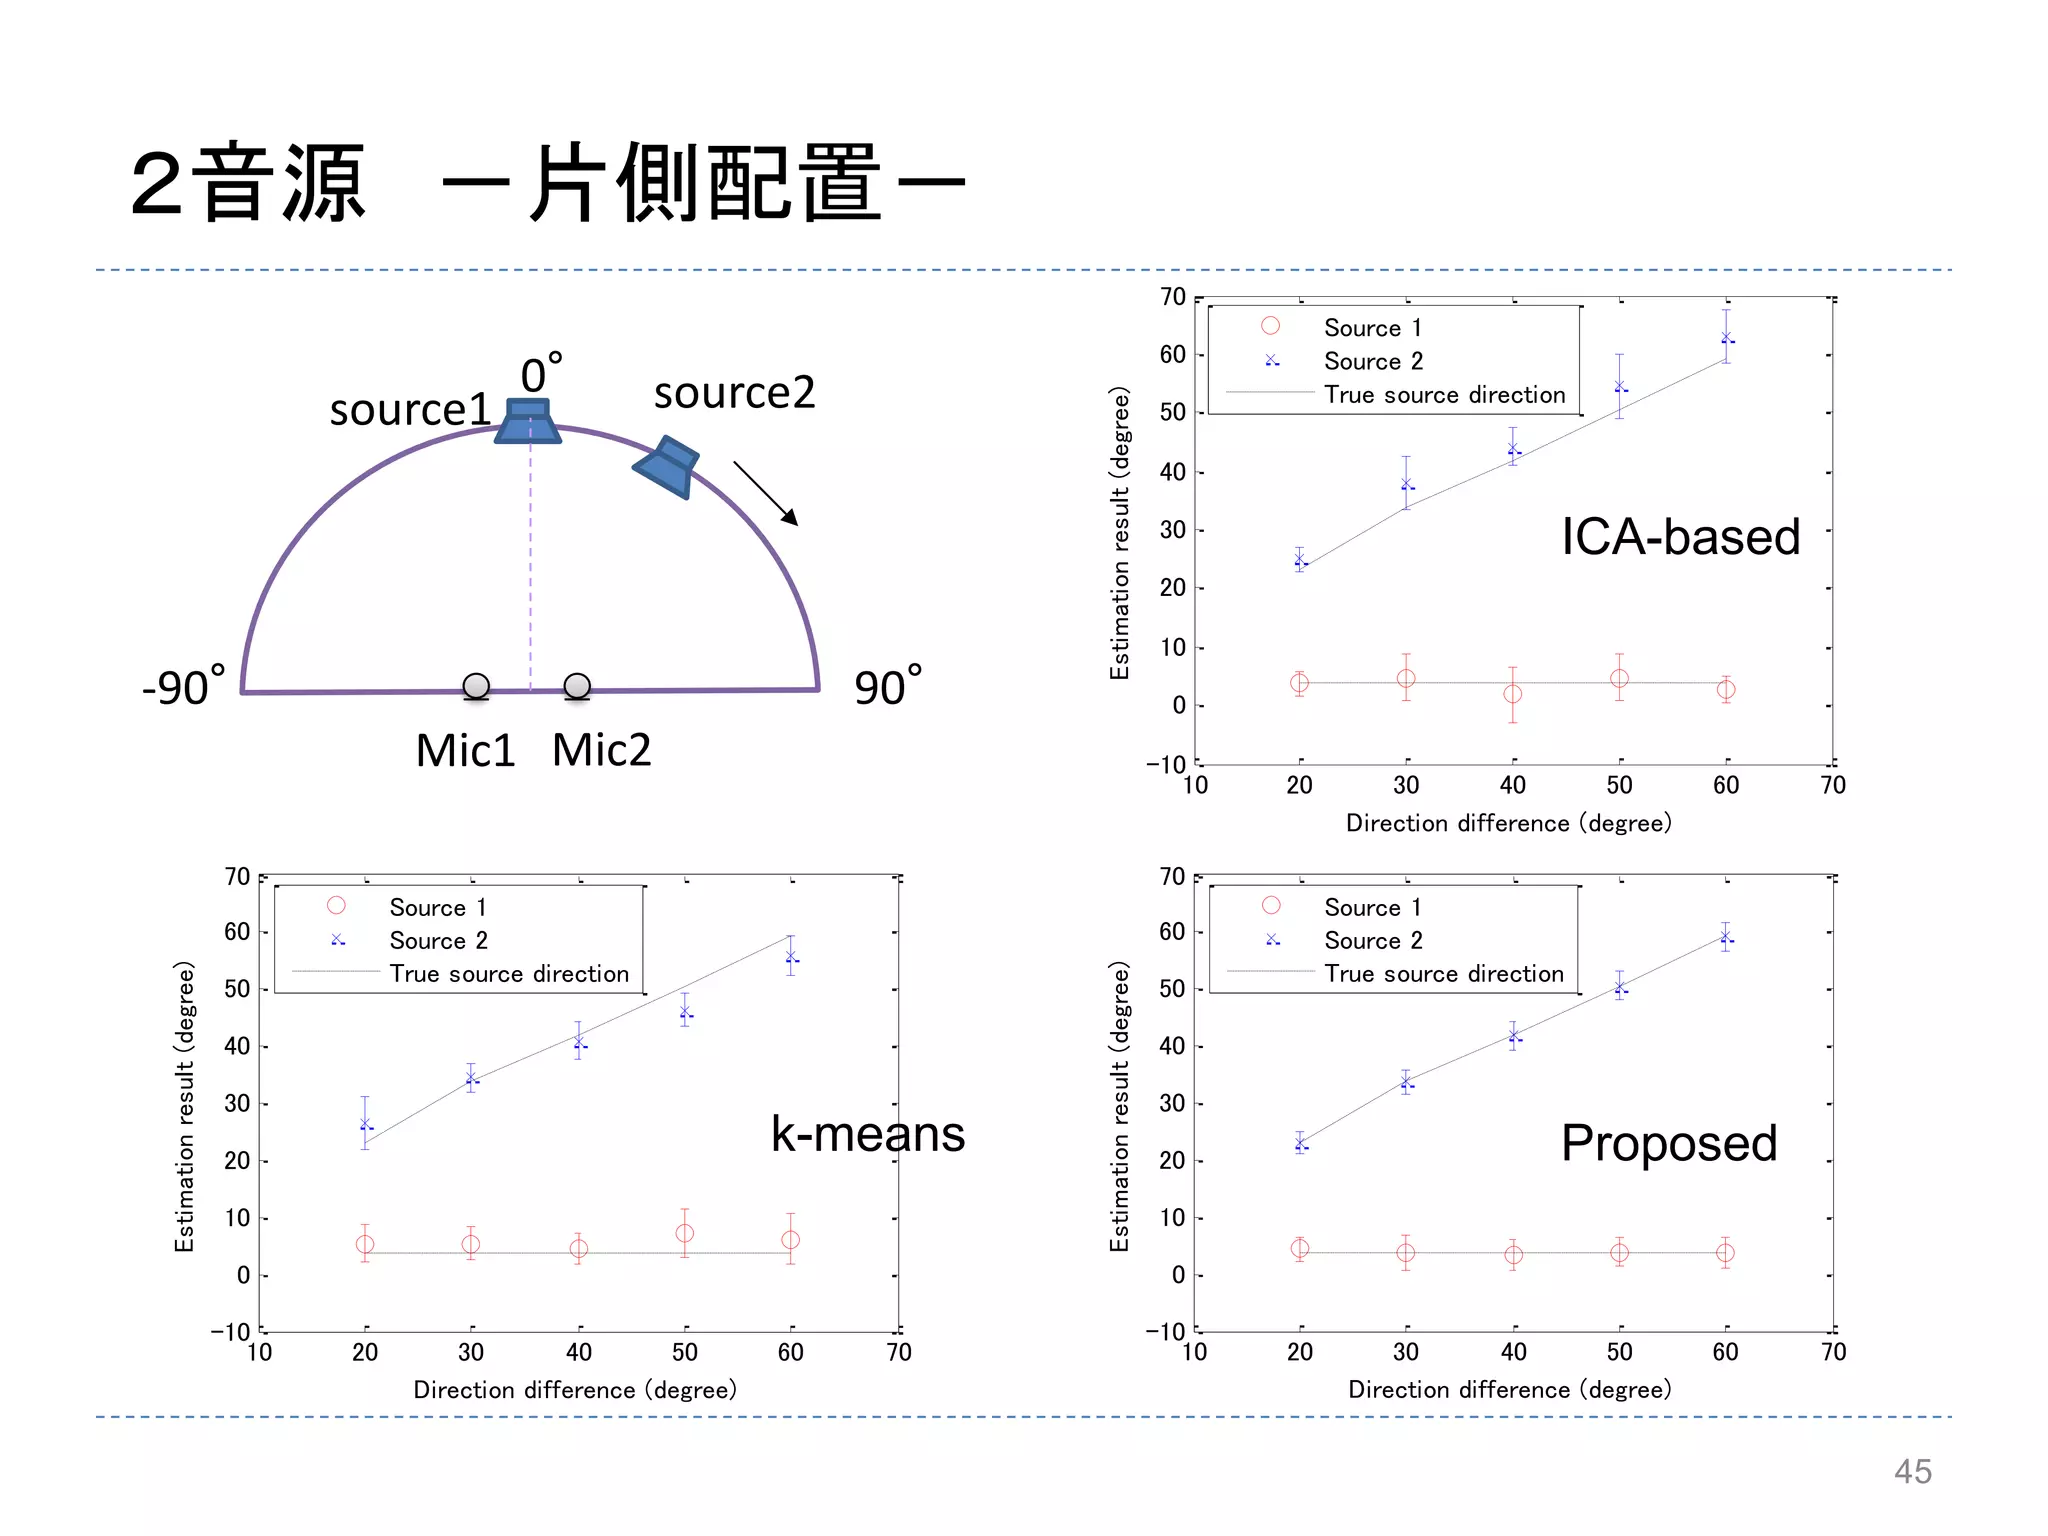
The proposed method gives much more accurate and stable DOA
estimation than conventional method.
Proposedk-means
47.
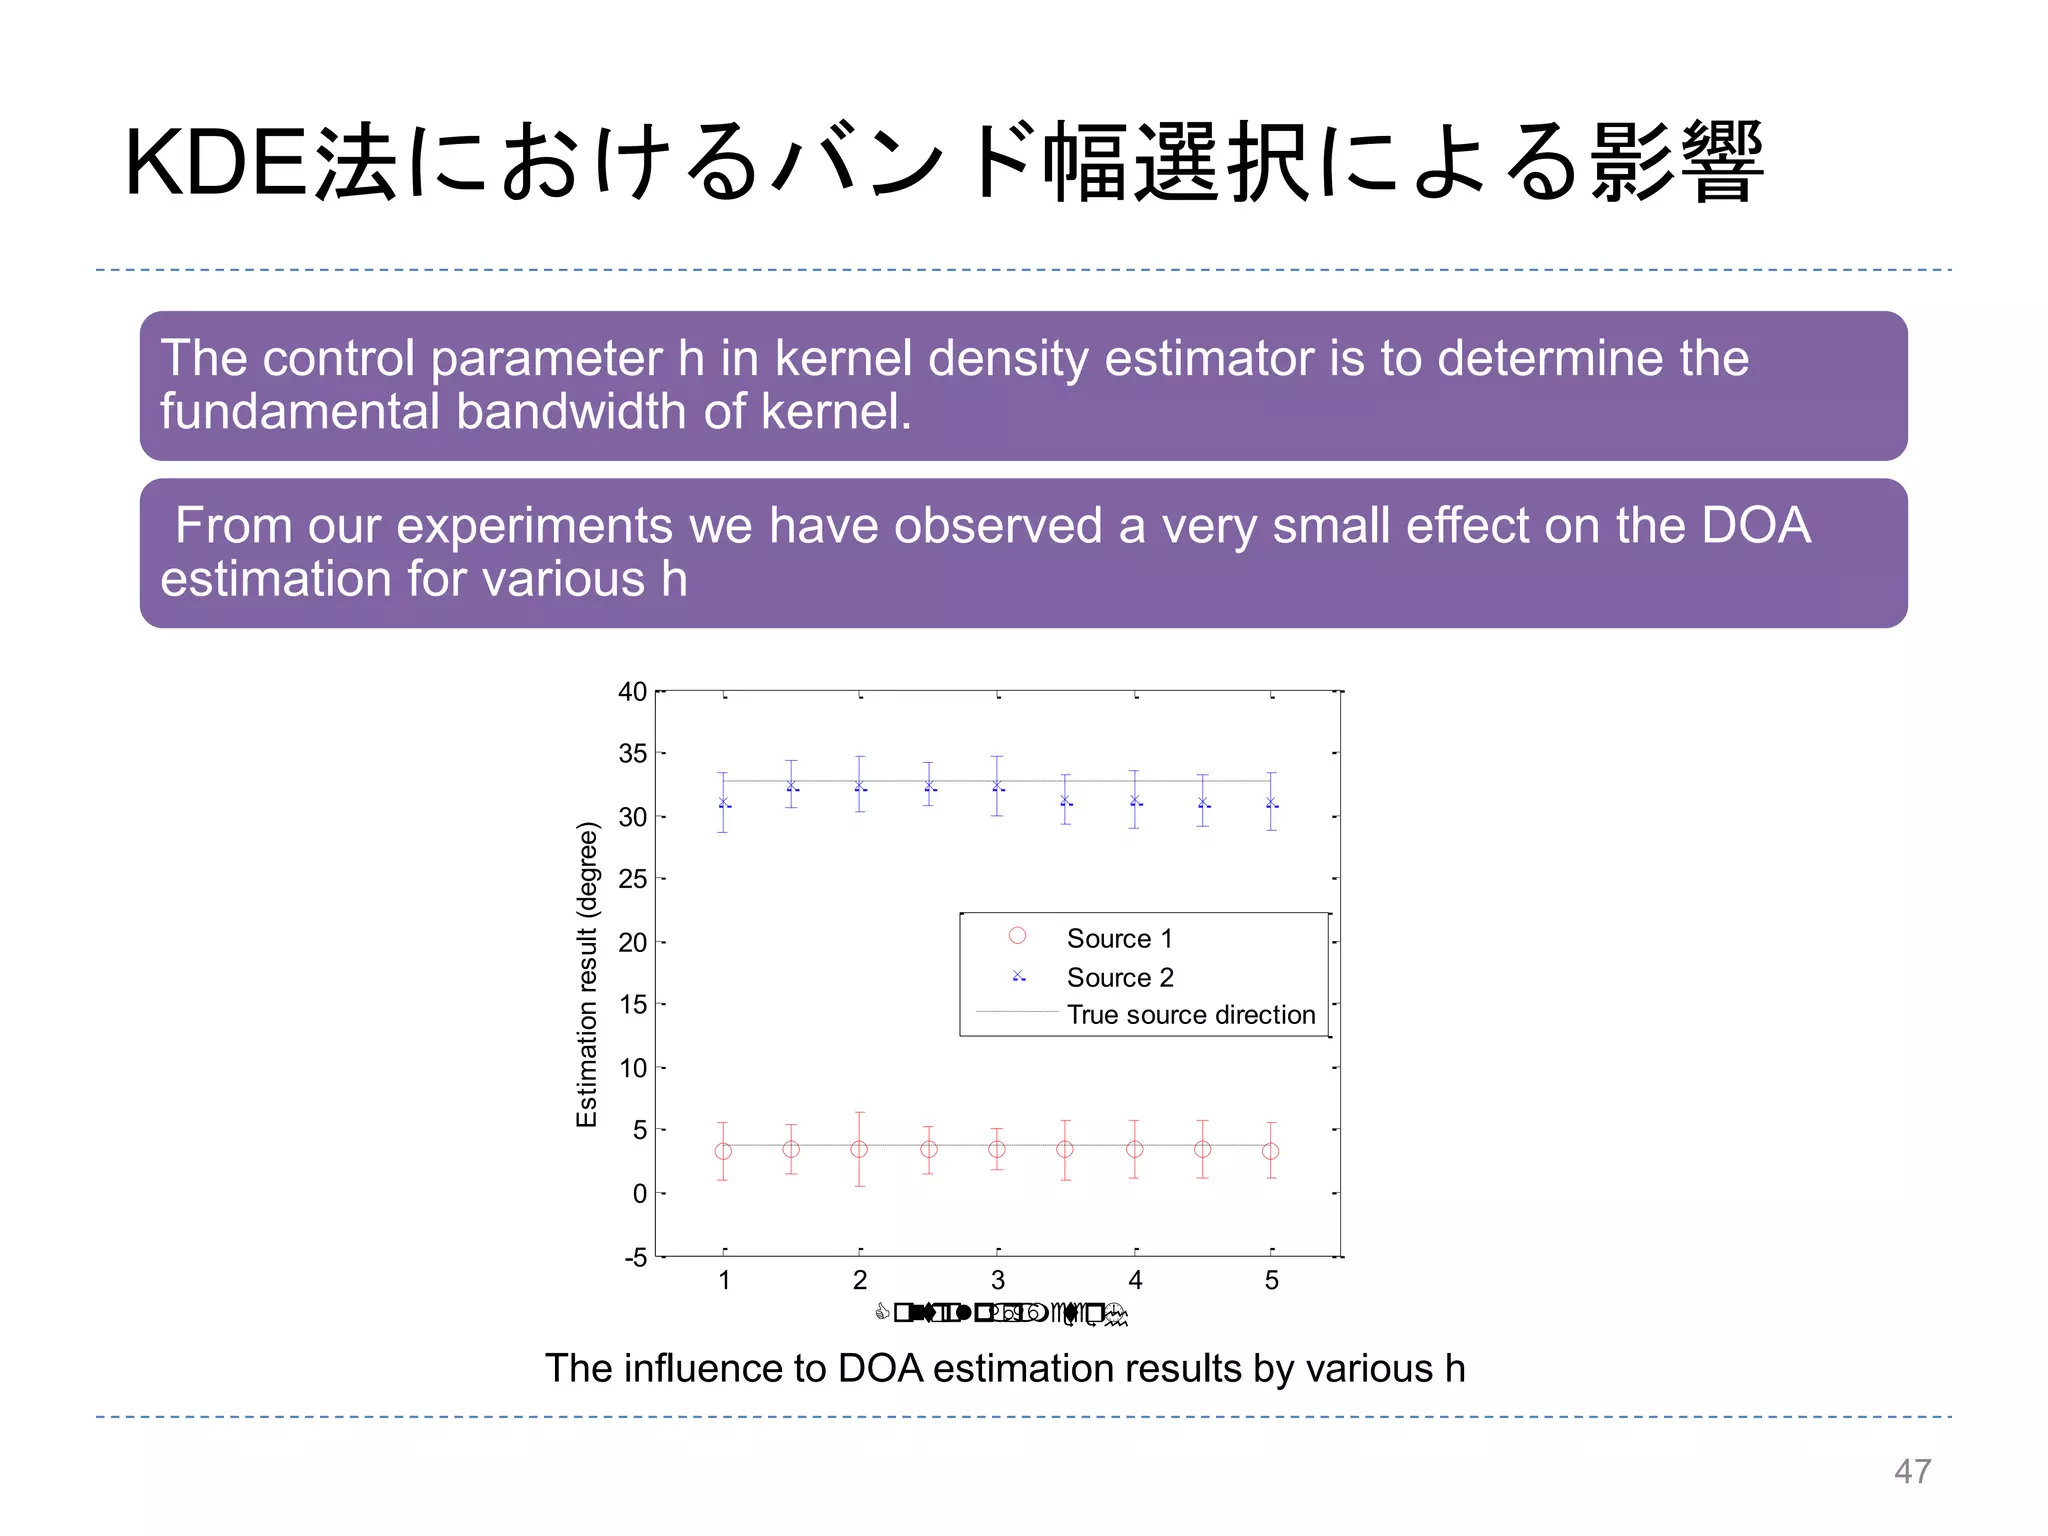
KDE法におけるバンド幅選択による影響
The control parameterh in kernel density estimator is to determine the
fundamental bandwidth of kernel.
From our experiments we have observed a very small effect on the DOA
estimation for various h
47
1 2 3 4 5
-5
0
5
10
15
20
25
30
35
40
Estimationresult(degree)
Source 1
Source 2
True source direction
The influence to DOA estimation results by various h
48.
48
Diffuse noise に対するロバスト性
0100 200 300 400 500 600
0
0.2
0.4
0.6
0.8
1
Frequency bin
Amplitude
Theoretical line sinc(Tl)
generated cross-correlation
white Gaussian noise
],[
],[
],[
2
1
lkN
lkN
lkN
1)(sin
)(sin1
][
2
Tlc
Tlc
NNEV H
Correlation matrix
],[],[],[ lkNlkXlkX
In the diffuse noise, there is equal probability of energy flow in all directions.
The noise appears to have no single source and correlated between sensors.
Tl
Tl
Tlc
)sin(
)(sin
cdT /
Lfs /2
)(12 lV
)(11 lV
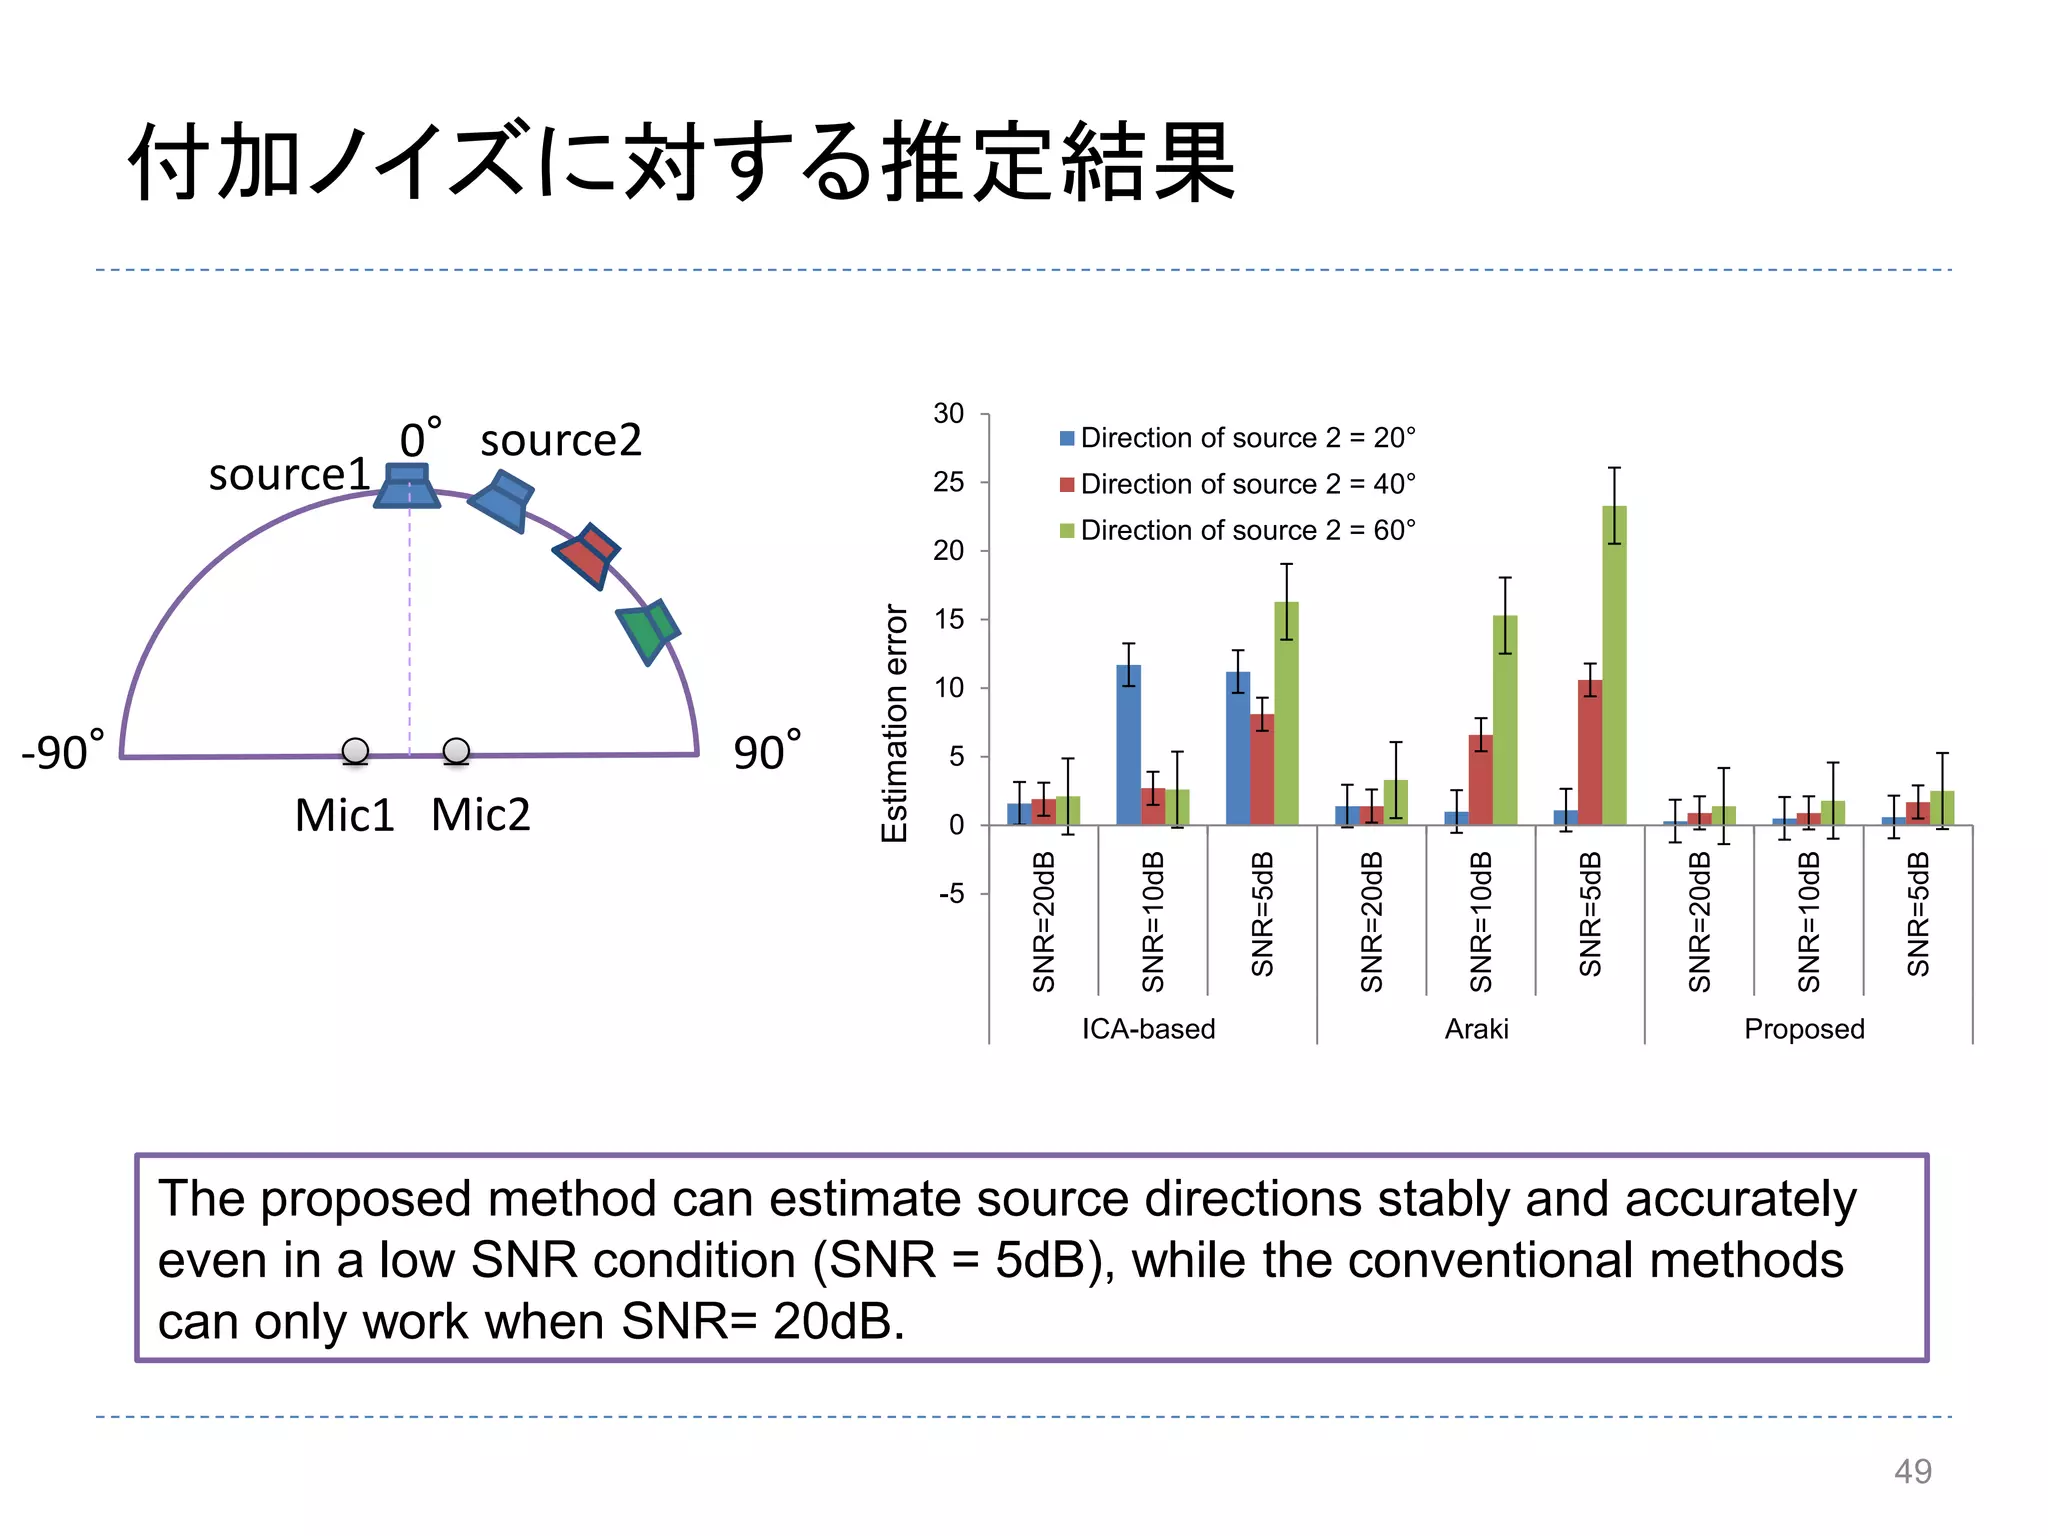
49.
付加ノイズに対する推定結果
49
The proposed methodcan estimate source directions stably and accurately
even in a low SNR condition (SNR = 5dB), while the conventional methods
can only work when SNR= 20dB.
-90° 90°
0°
source1
source2
Mic1 Mic2
-5
0
5
10
15
20
25
30
SNR=20dB
SNR=10dB
SNR=5dB
SNR=20dB
SNR=10dB
SNR=5dB
SNR=20dB
SNR=10dB
SNR=5dB
ICA-based Araki Proposed
Direction of source 2 = 20°
Direction of source 2 = 40°
Direction of source 2 = 60°
Estimationerror
60
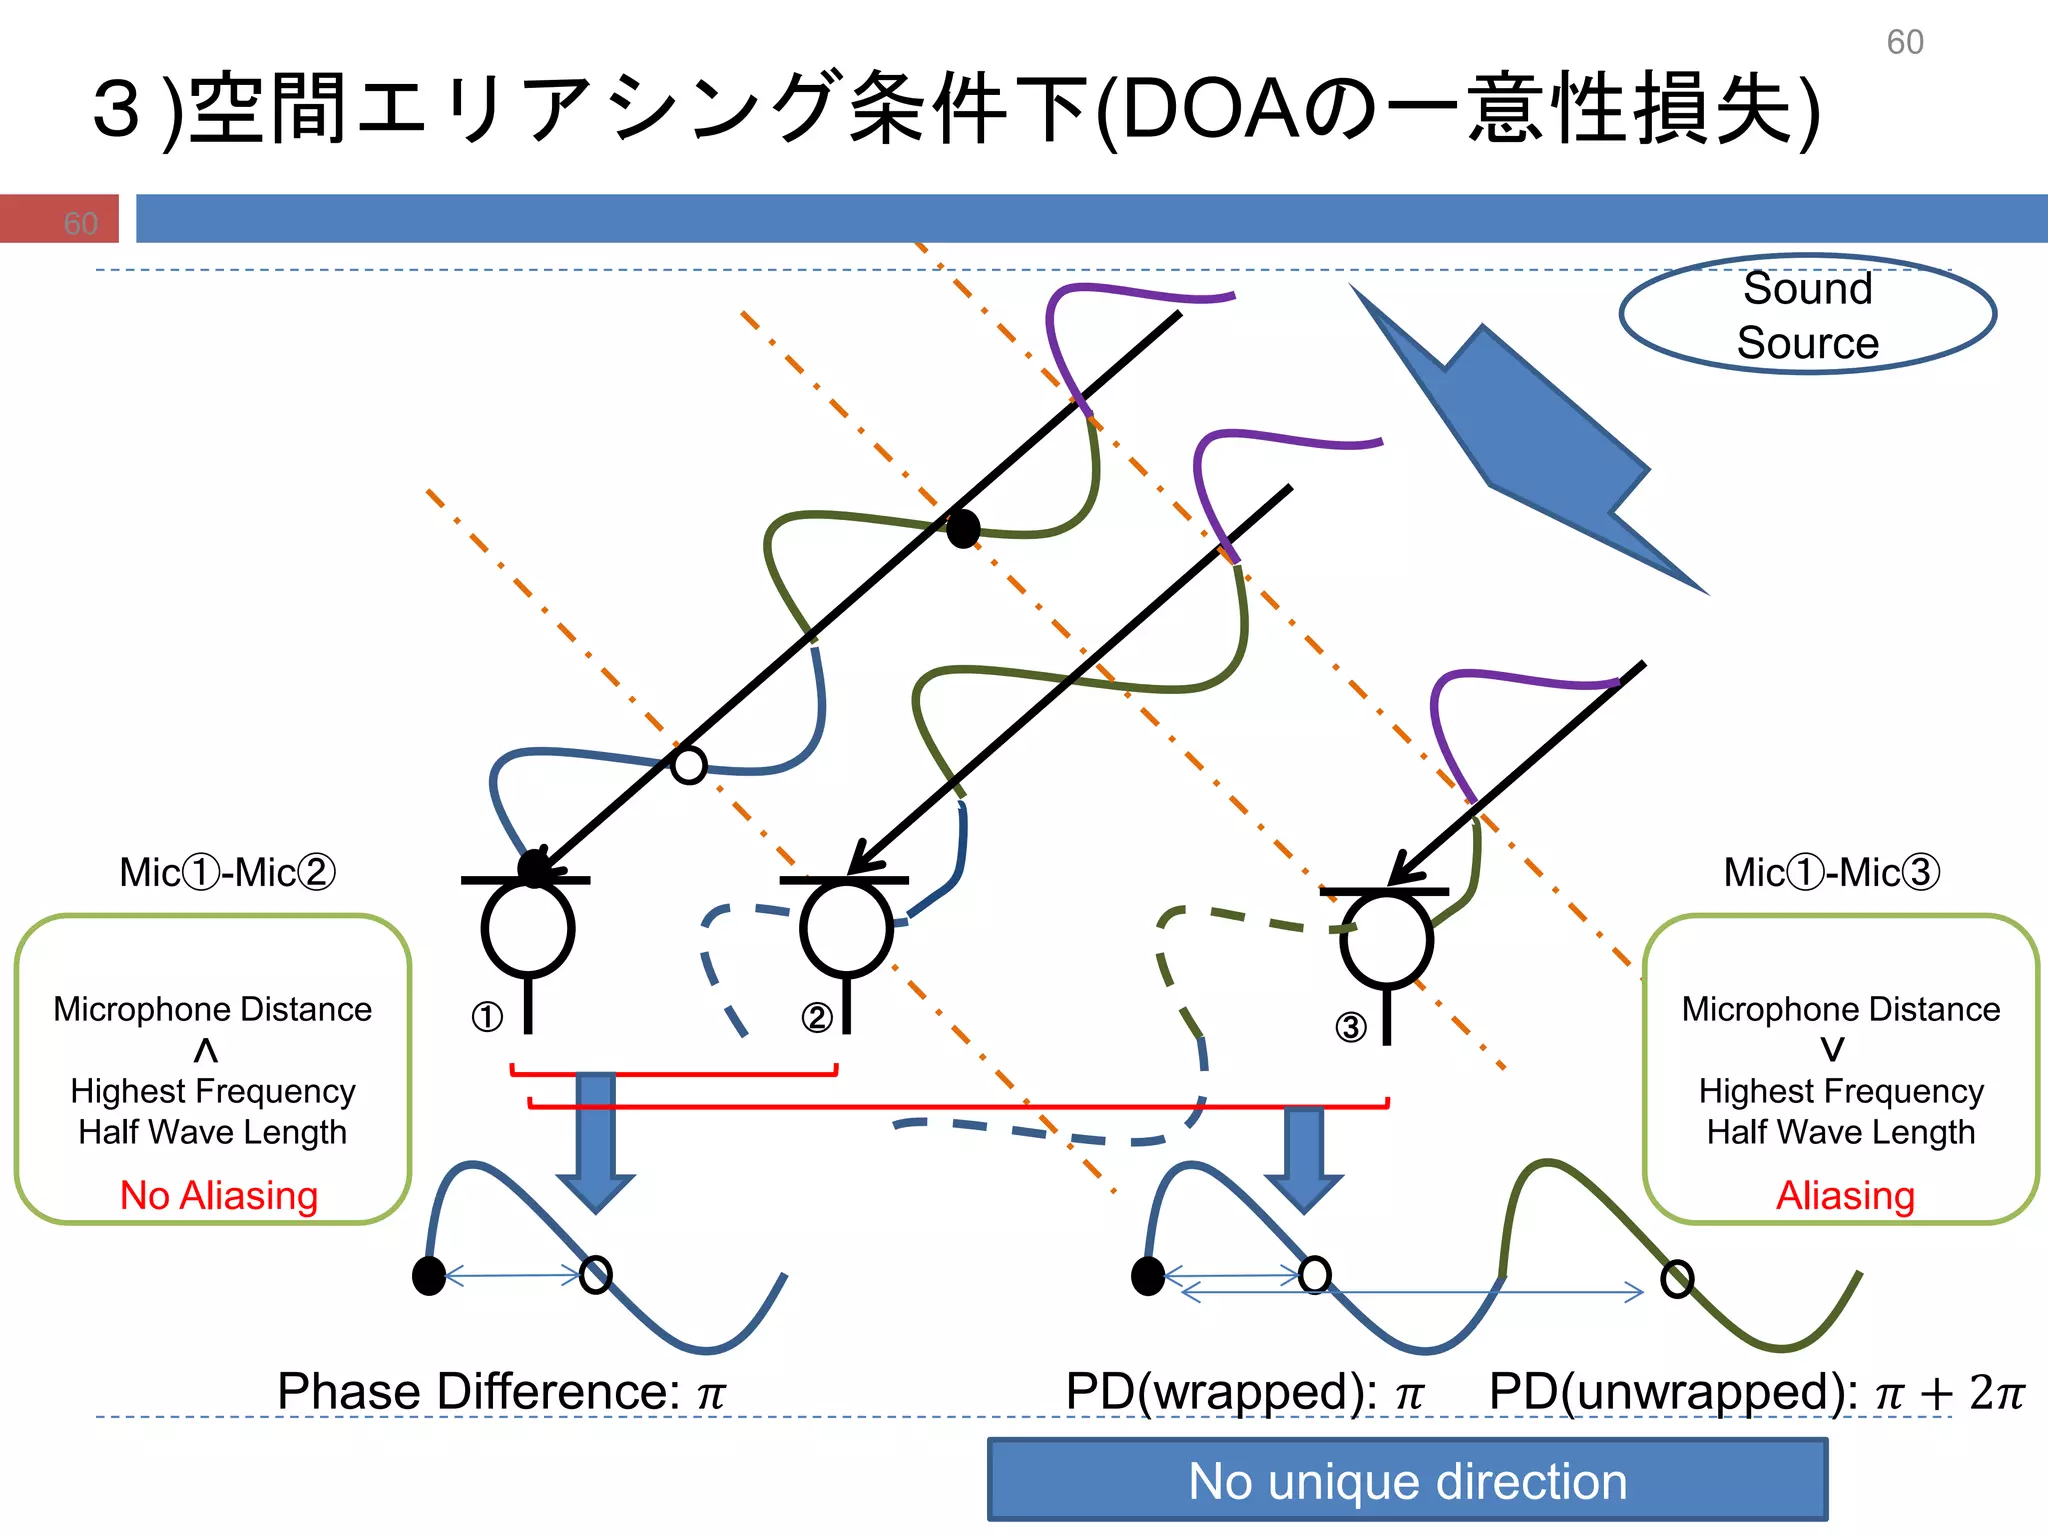
3)空間エリアシング条件下(DOAの一意性損失)
Sound
Source
① ② ③
PhaseDifference: 𝜋 PD(wrapped): 𝜋
No unique direction
Microphone Distance
Highest Frequency
Half Wave Length
>
Mic①-Mic②
No Aliasing
Microphone Distance
Highest Frequency
Half Wave Length
>
Mic①-Mic③
Aliasing
PD(unwrapped): 𝜋 + 2𝜋
60
エリアシングを許容するDOA推定(音源分離)
拡張Hough変換(ヒストグラム)による手法[27]
B. Loesch andB. Yang, “ Blind Source Separation based on Time-Frequency Sparseness in the Presence of Spatial
Aliasing ”LATENTVARIABLE ANALYSIS AND SIGNAL SEPARATION, Lecture Notesin Computer Science, 2010, Volume
6365/2010
逐次的位相差補正処理による手法[28]
いずれか一組のセンサが非エリアシング条件を満たすことを利用
Loeschらによる手法[23]2010 *
State vectorを用いた評価関数による任意マイク配置におけるDOA推定と分離
Sawadaらによる手法[21]2007
低域から順次解決するDOA推定と分離手法
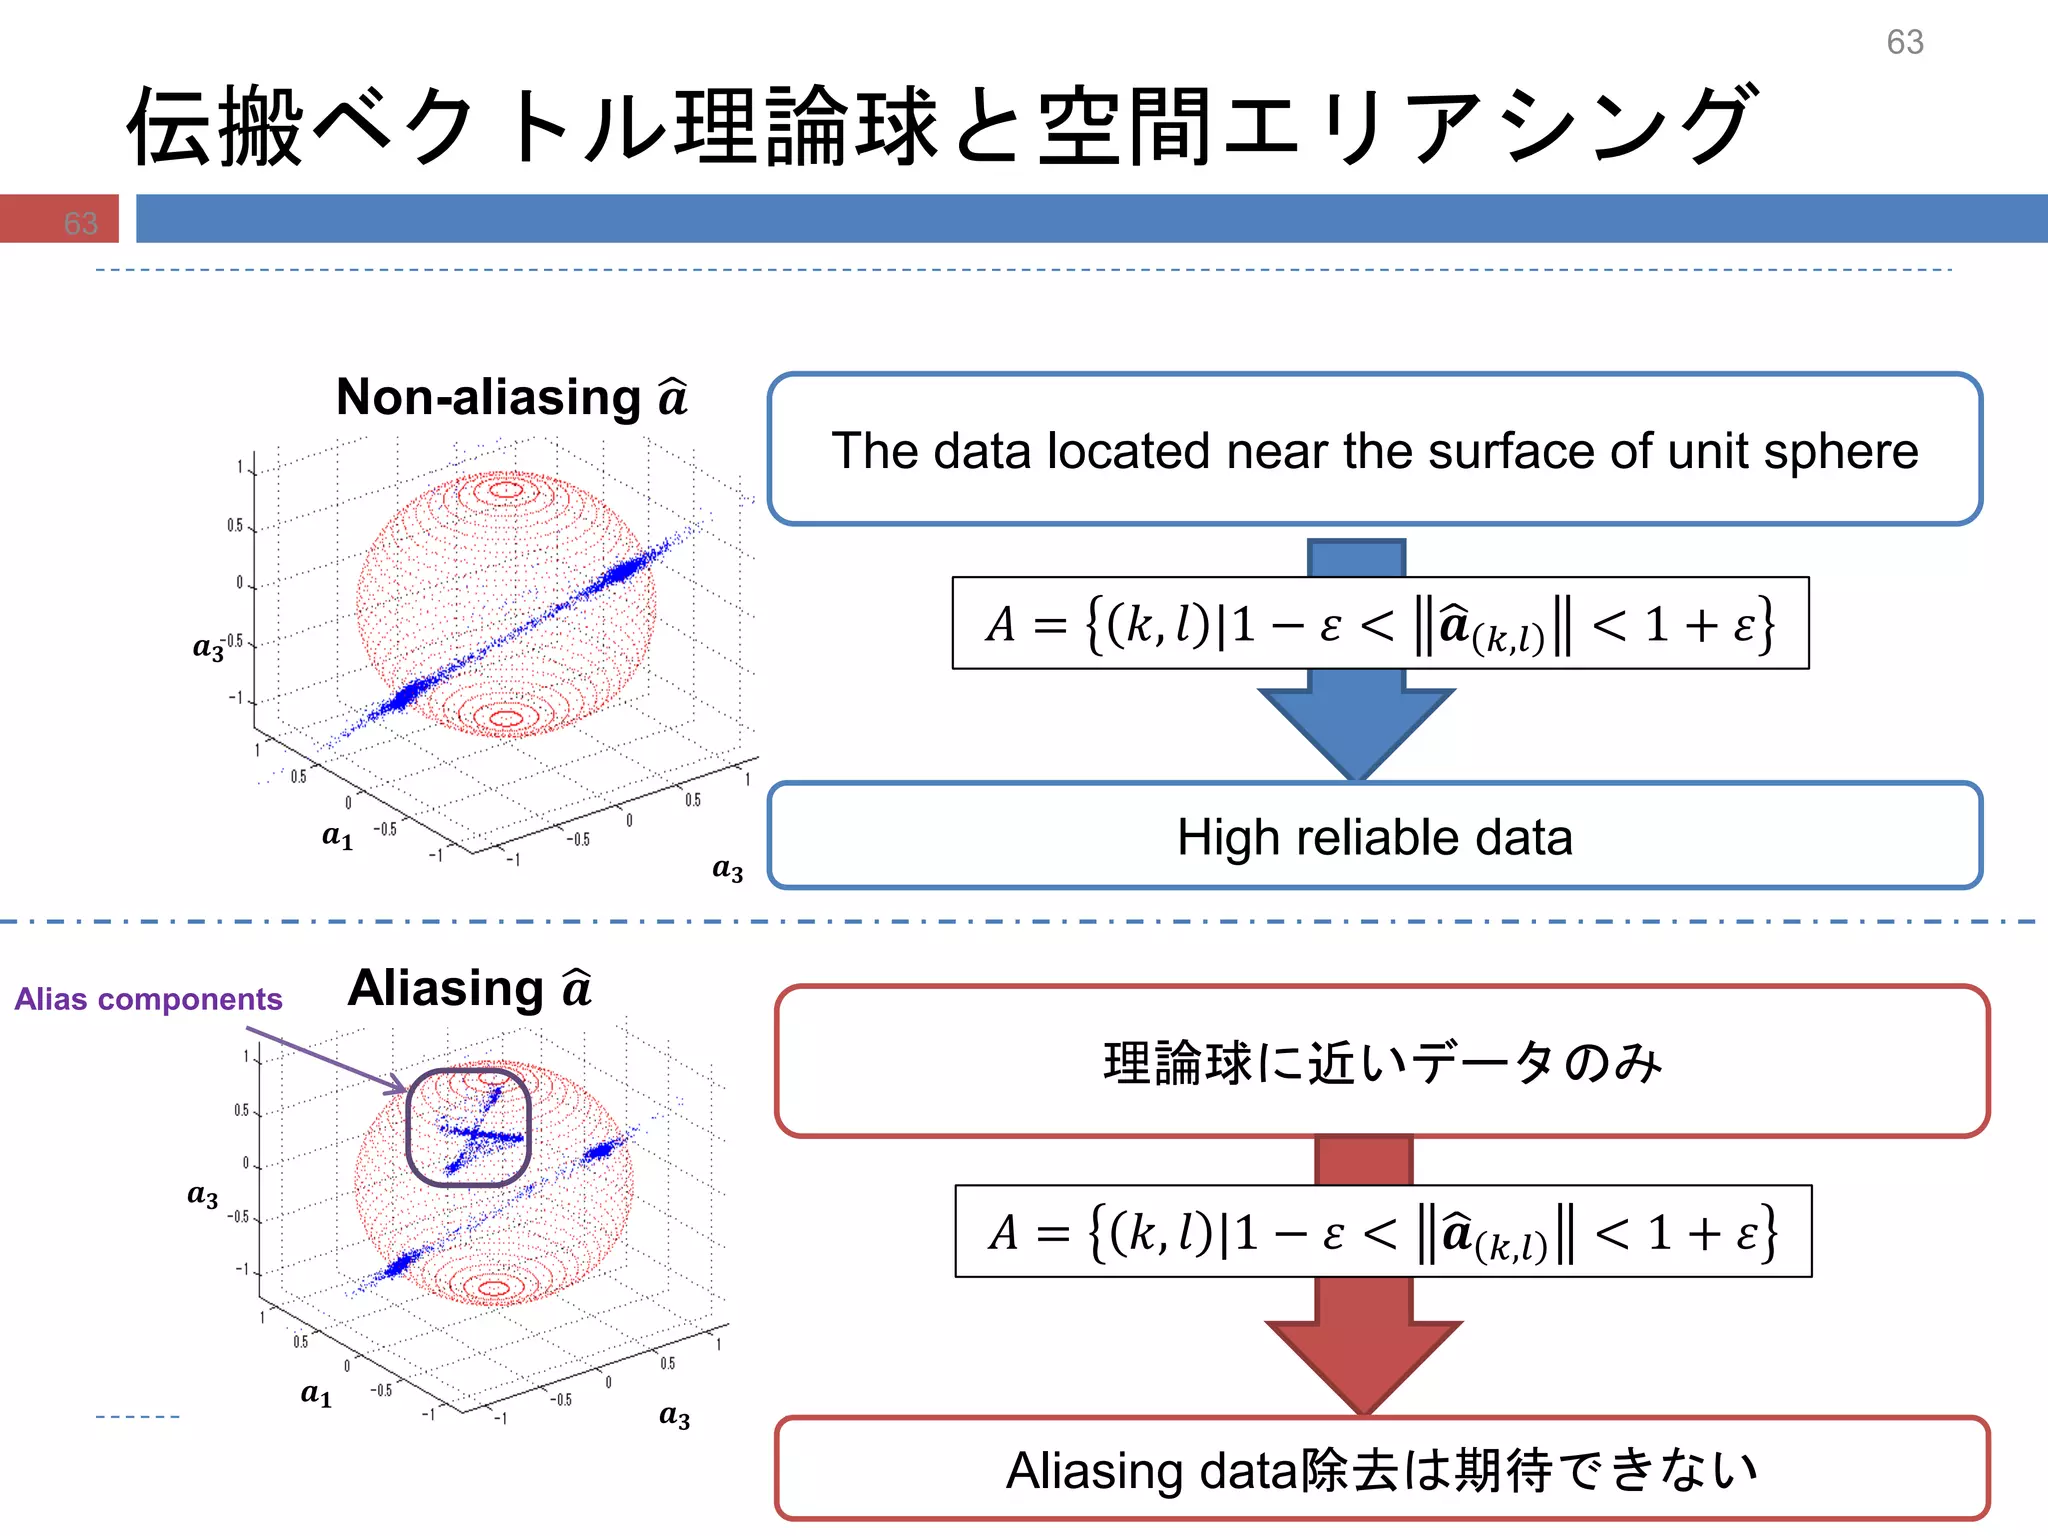
63.
𝒂 𝟑
𝒂 𝟏
𝒂𝟑
Non-aliasing 𝒂
伝搬ベクトル理論球と空間エリアシング
63
The data located near the surface of unit sphere
High reliable data
𝒂 𝟑
𝒂 𝟏
𝒂 𝟑
Aliasing 𝒂
理論球に近いデータのみ
Aliasing data除去は期待できない
𝐴 = 𝑘, 𝑙 |1 − 𝜀 < 𝒂 𝑘,𝑙 < 1 + 𝜀
𝐴 = 𝑘, 𝑙 |1 − 𝜀 < 𝒂 𝑘,𝑙 < 1 + 𝜀
Alias components
63
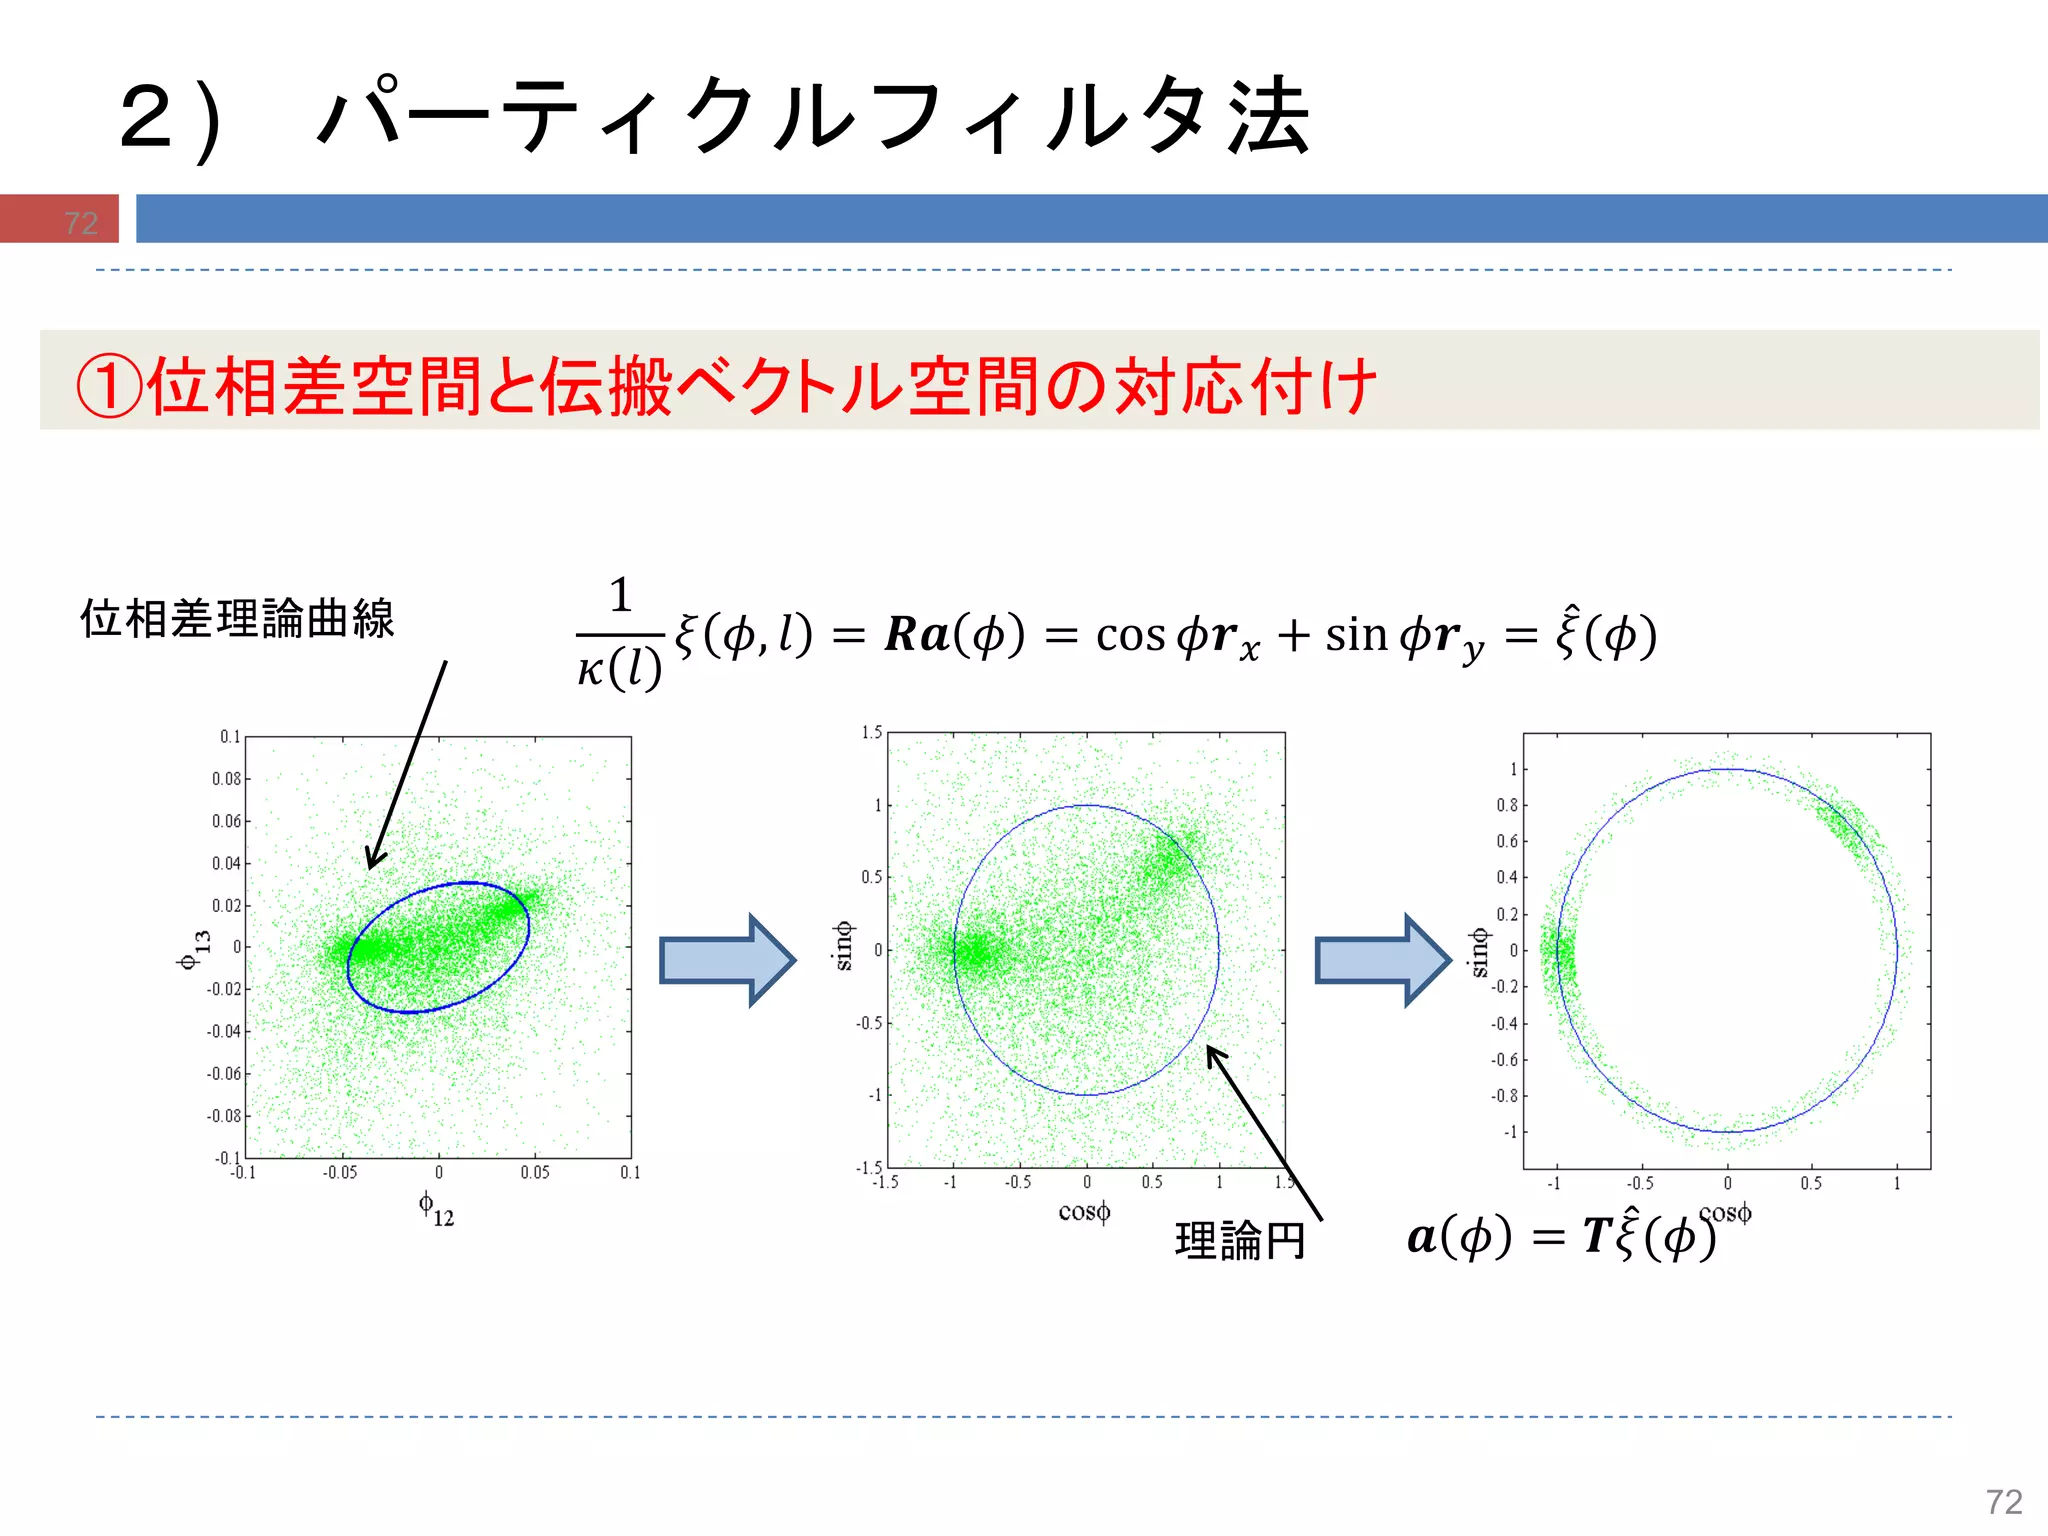
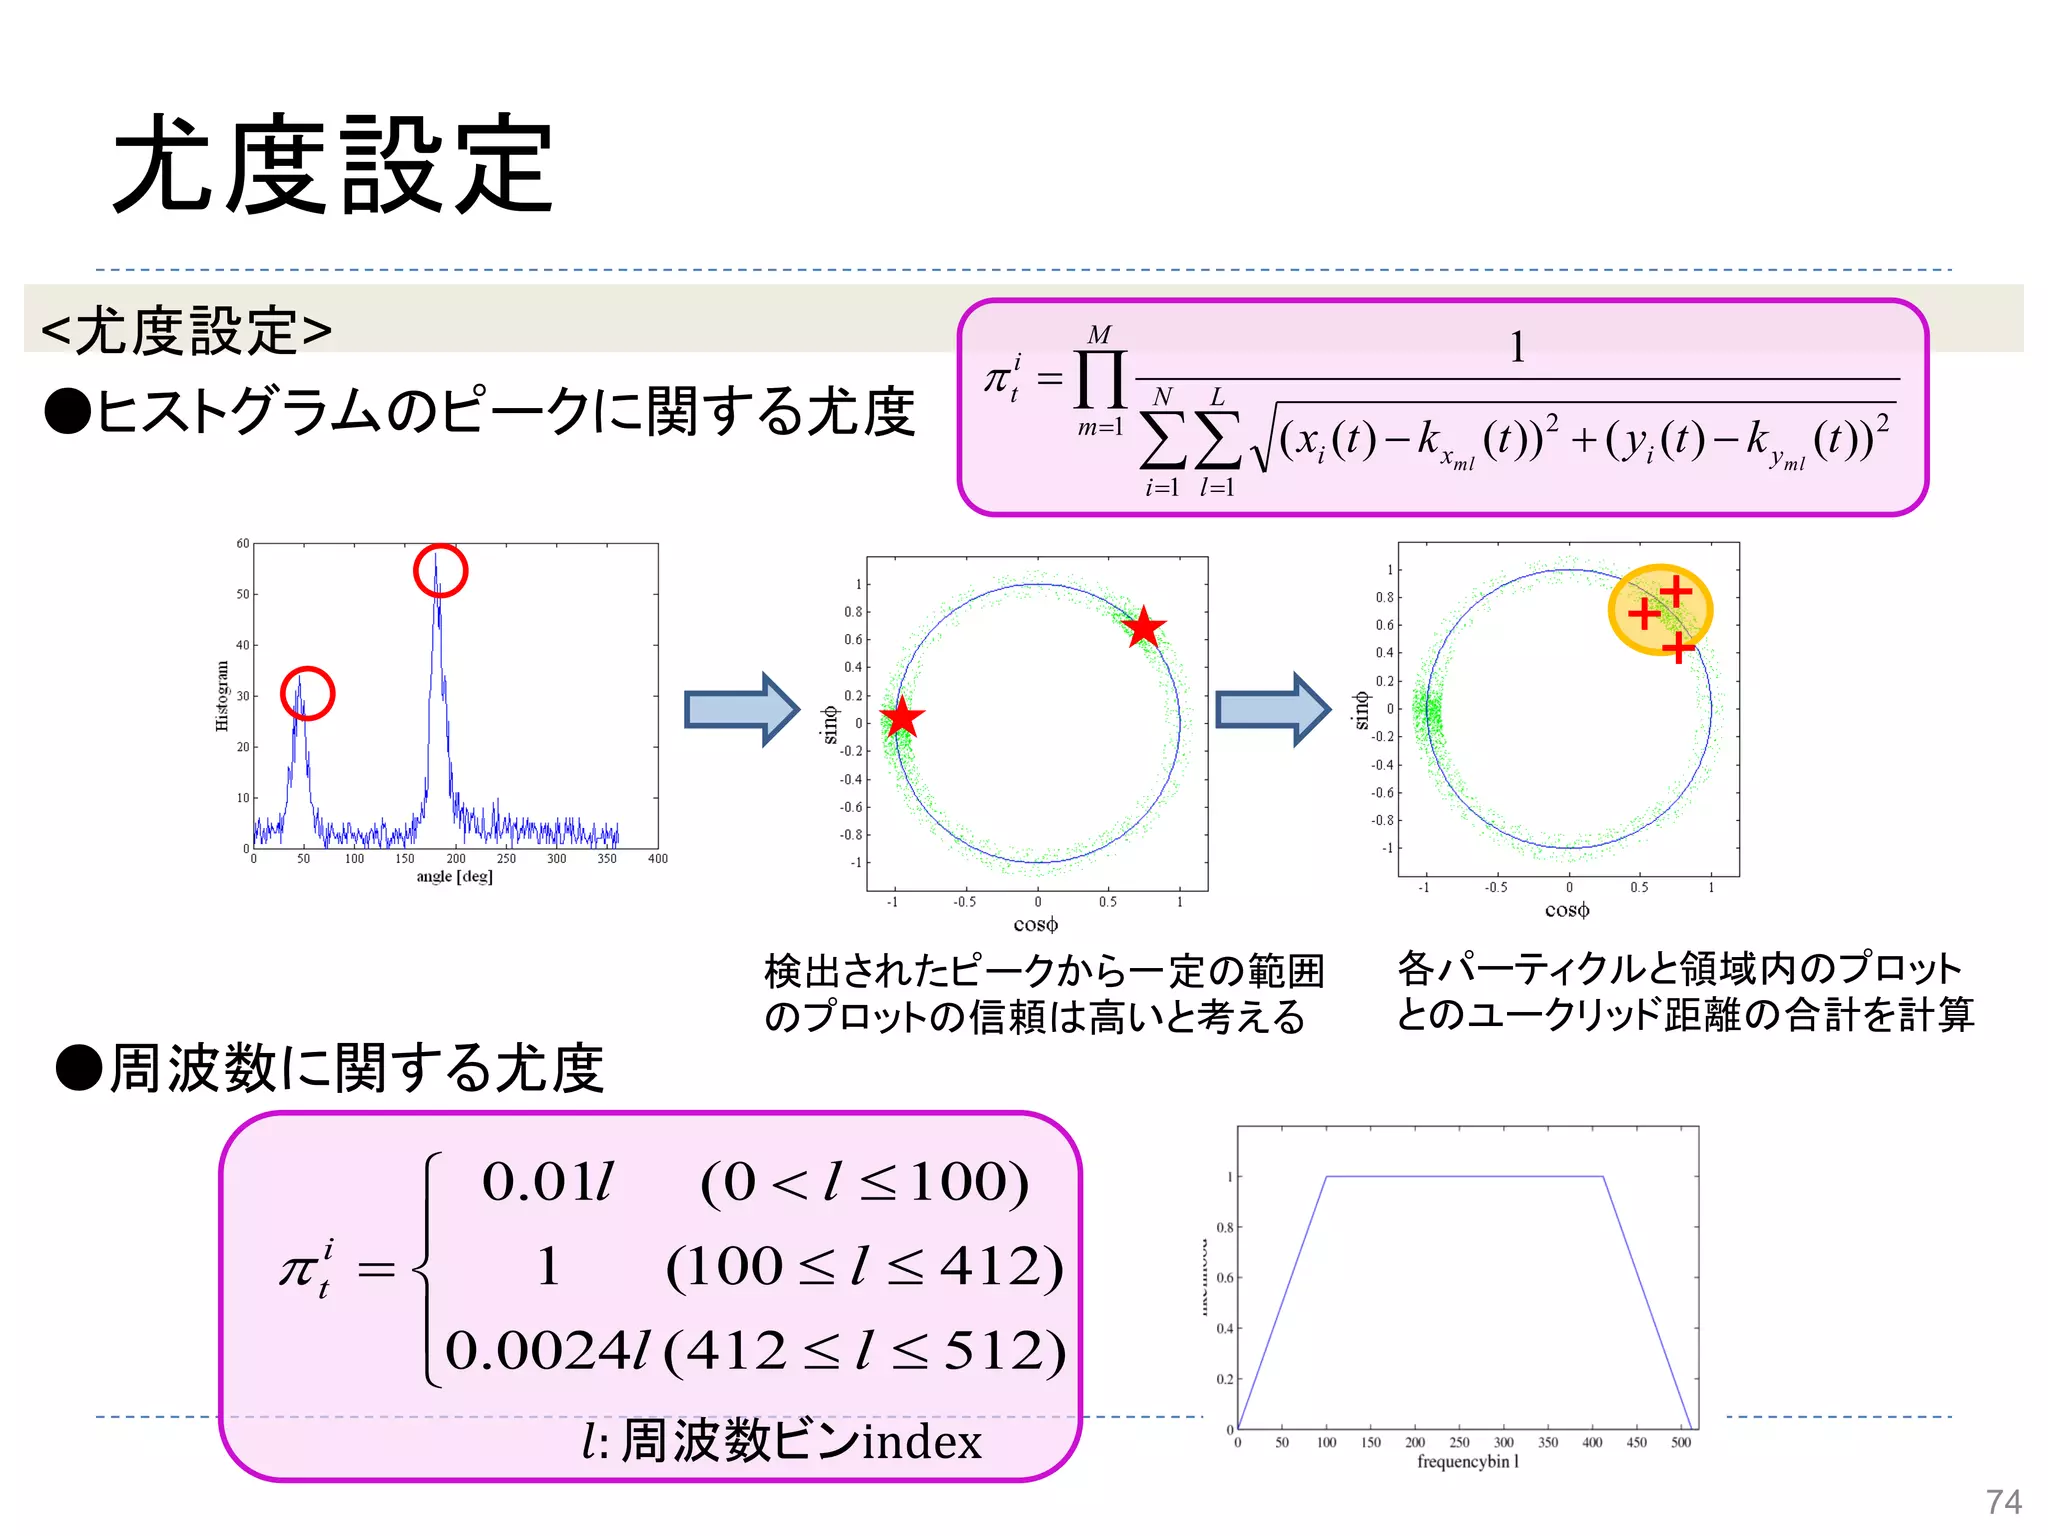
尤度設定
M
m
N
i
L
l
yixi
i
t
tktytktx mlml
1
11
22
))()(())()((
1
<尤度設定>
●ヒストグラムのピークに関する尤度
●周波数に関する尤度
検出されたピークから一定の範囲
のプロットの信頼は高いと考える
各パーティクルと領域内のプロット
とのユークリッド距離の合計を計算
)512412(
)412100(
)1000(
0024.0
1
01.0
l
l
l
l
l
i
t
𝑙: 周波数ビンindex
74
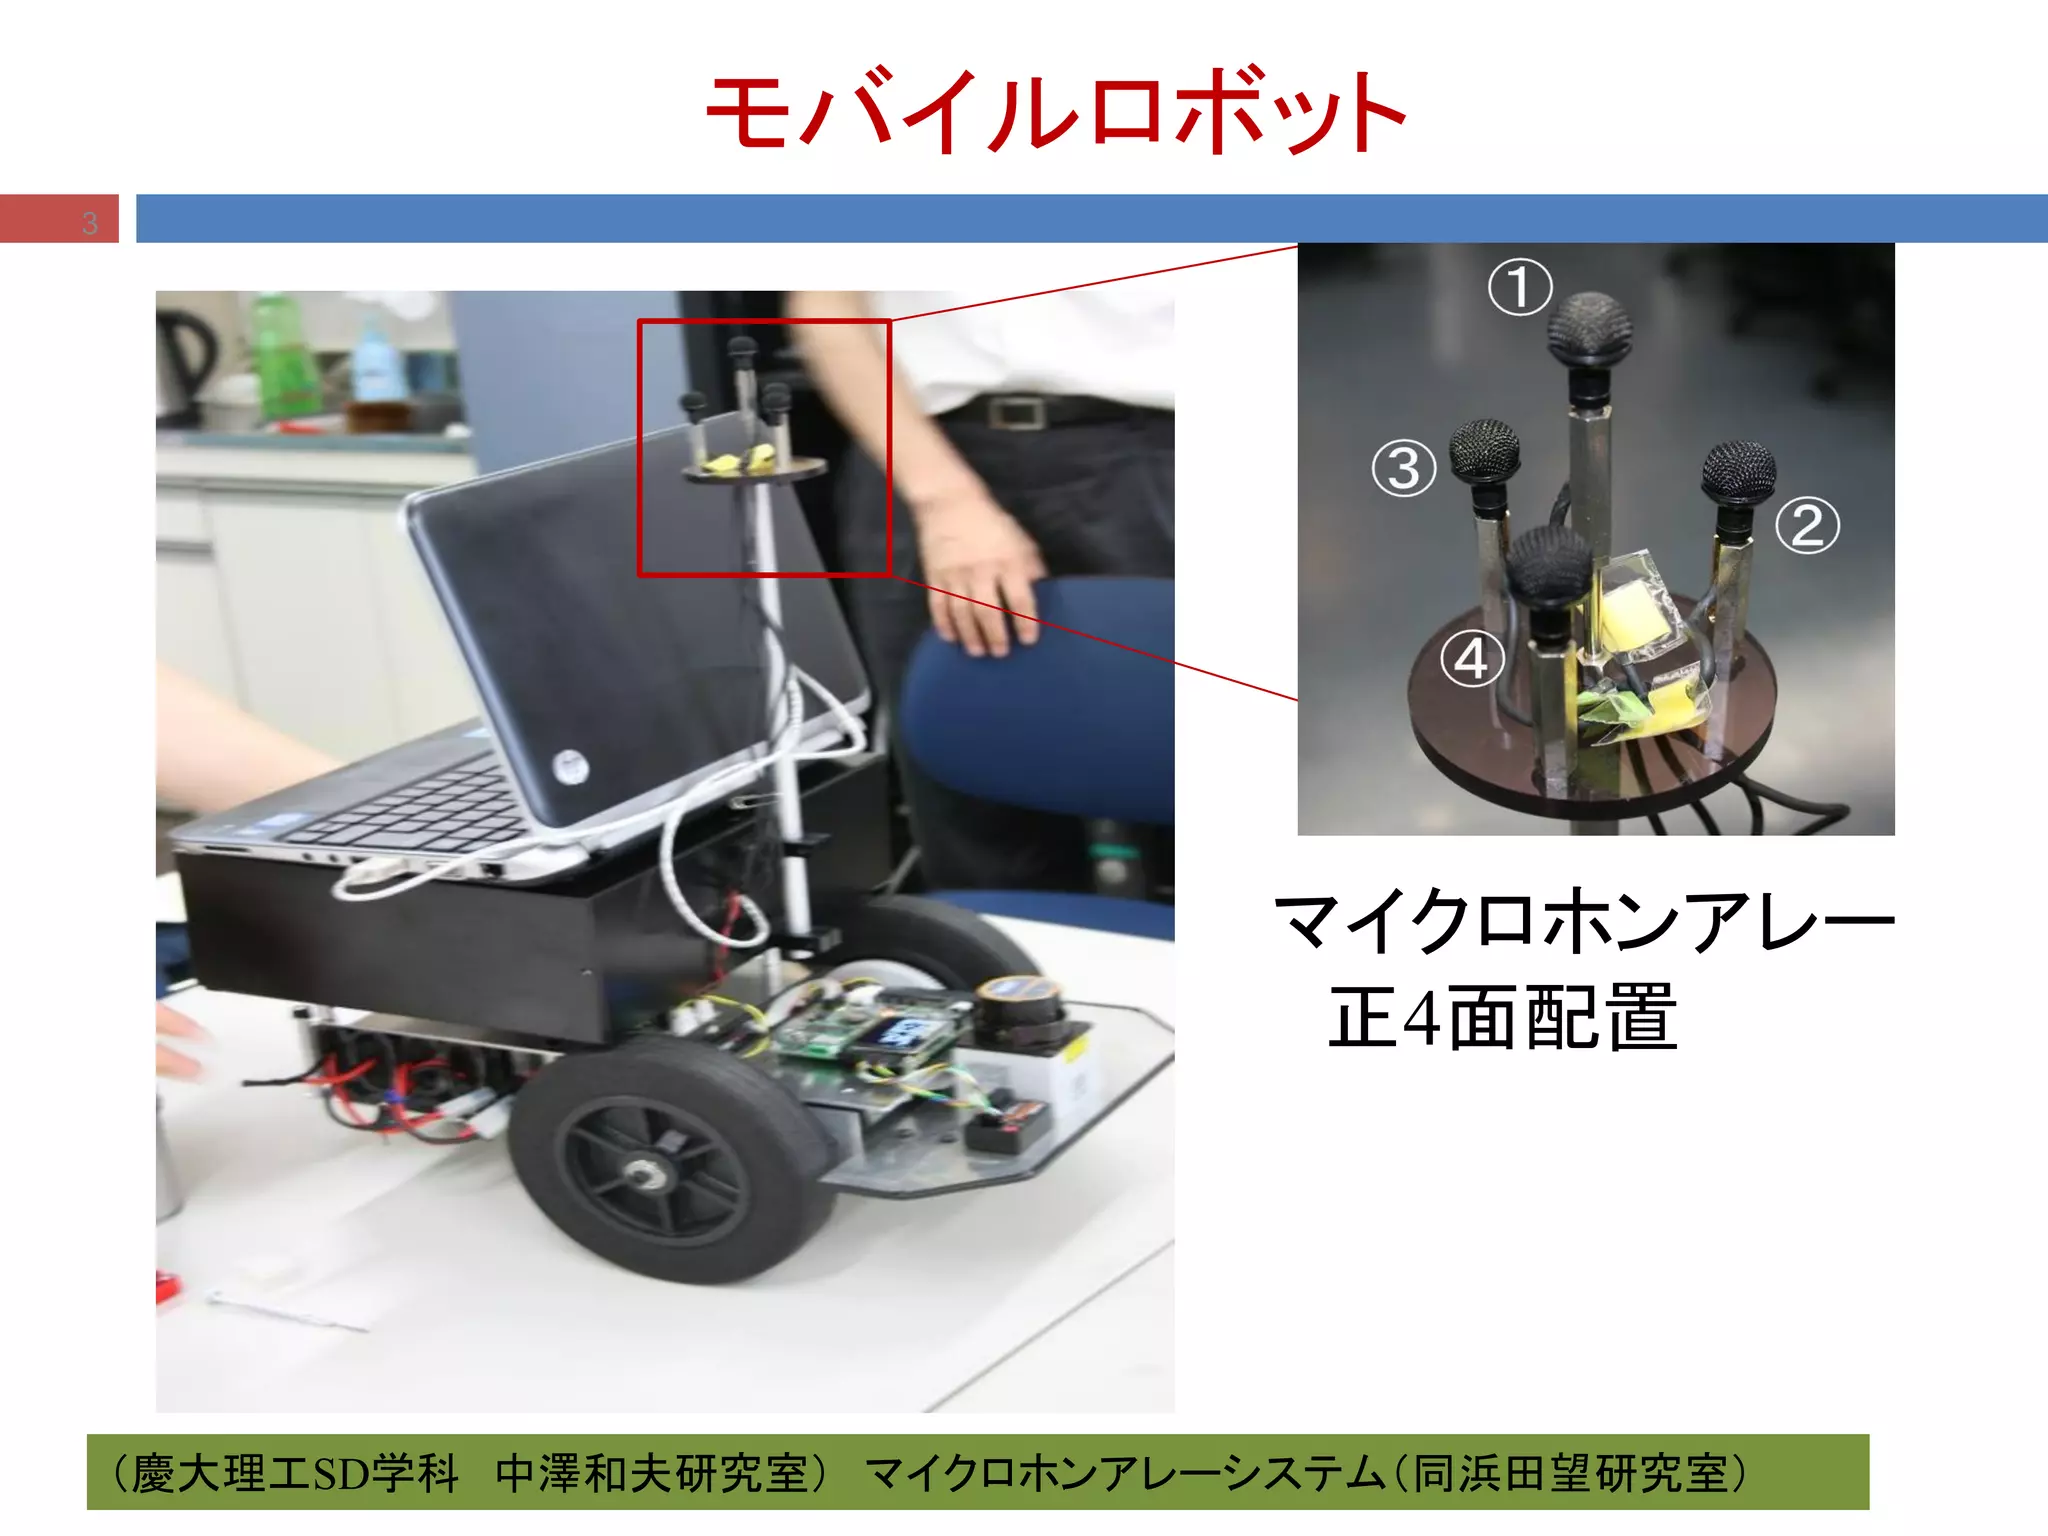
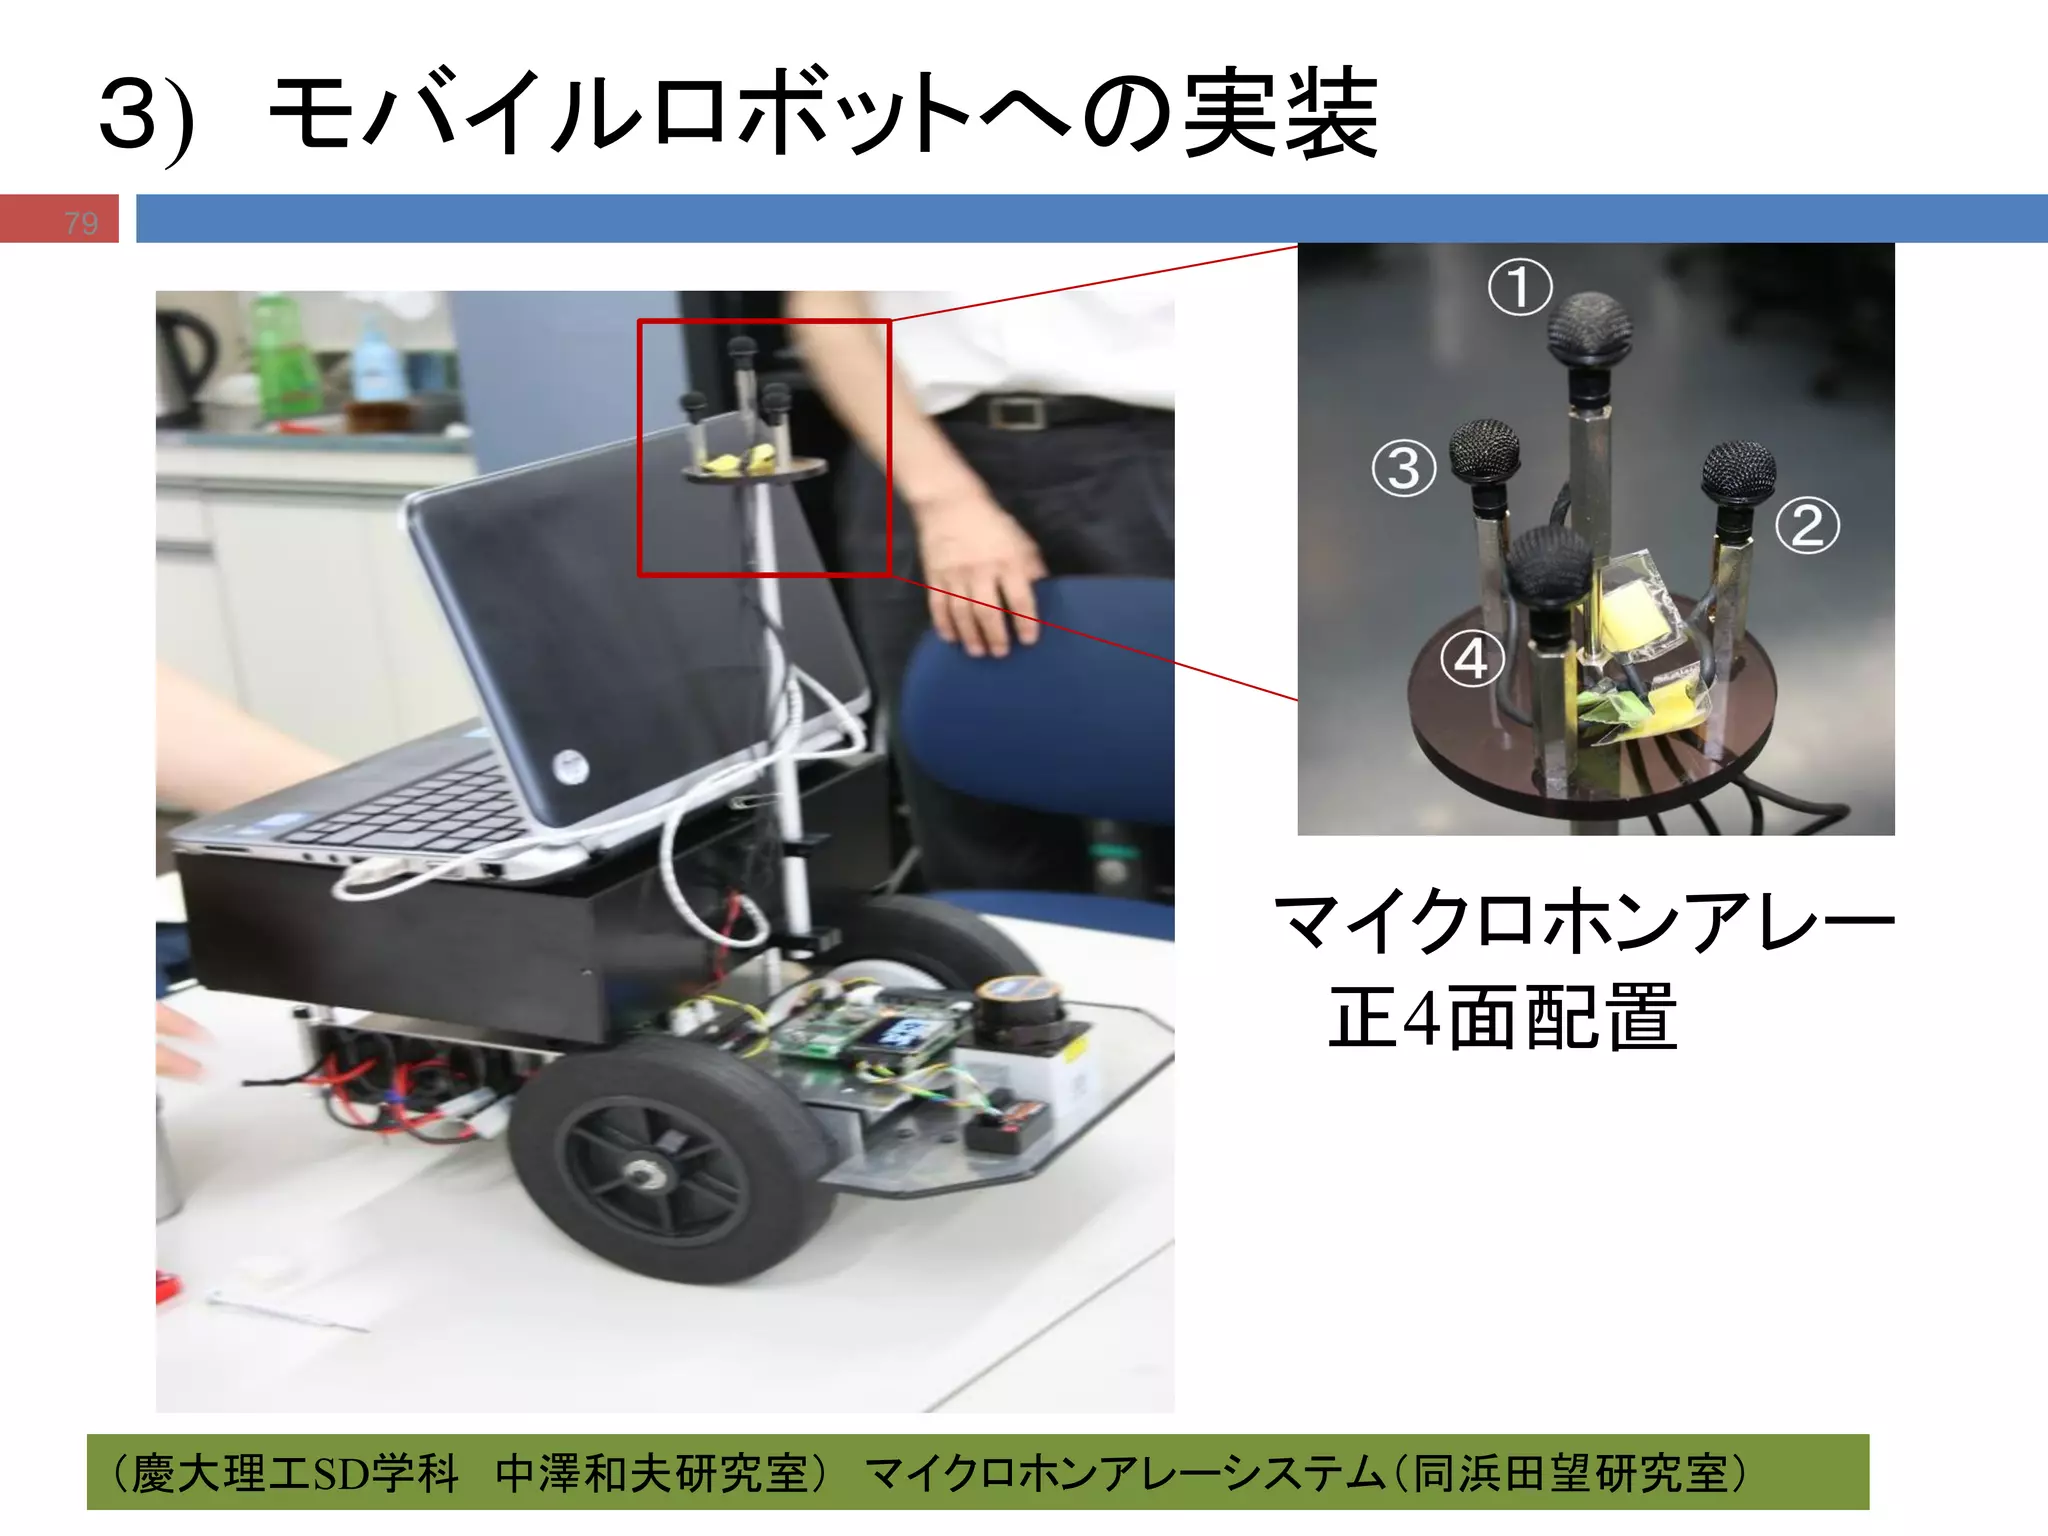
Implementation-Hardware
Hardware:
1) PC/Laptop withLinux (Ubuntu 10.04 LTS)
2) TD-BD-16ADUSB board for multichannel synchronal sampling
3) 8 channels amplifier
4) Mobile robot (Nakazawa Lab. in Keio)
5) Microphone array, wires etc.
TD-BD-16ADUSB board
mobile robot from Nakazawa lab
Microphone array
8 channels amplifier Mobile robot with Audition
80
81.
Implementation-Software
Software:
1) OS :Linux (Ubuntu 10.04 LTS)
2) Sub OS : ROS (sources and tutorials can be found http://www.ros.org/wiki/ )
3) Linux driver for TD-BD-16ADUSB
4) QT4 for GUI (Graphic User Interface), gazebo 3D simulation, bluetooth lib etc.
azimuth
elevation
azimuth
-180 0 180
90
-90
0
Hardware
Linux & drivers
ROS
apps
Software Hierarchy
Simulator gazebo GUI
81
82.
3.2 Implementation-Software (cont.)ProgramFramework: Multi processes:
DOA & Tracking
Speaker
Identification mobile robot /
moving speaker
Audio records
For each 0.5s
(φ,θ) are relative
azimuth and elevation
angles between robot and
speaker
(φ,θ)
82
84.
4. Exp, FieldTest & ResultExp: Real time tracking the loud speaker:
Real time audio source tracking with mean shift algorithm
85.
4. Exp, FieldTest & Result (cont.)
Filed Test: Robot master tracking & Identification
Robot Audition System field test for tracking a speaking person using
mean-shift algorithm and speaker identification
Video on youtube HamadaLab channel :
http://youtu.be/6vazpZbYlgI and http://youtu.be/TZqiHtjTOFM
0 100 200300 400 500
-0.5
0
0.5
1
1.5
2
2.5
3
Frequency Bin
PhaseDifference(rad.)
Source 1
Source 2
0 100 200 300 400 500
-0.5
0
0.5
1
1.5
2
2.5
3
Frequency Bin
PhaseDifference(rad.)
Source 1
Source 2
基本方針
],[
],[
arg],[,
1
2
lkX
lkX
lkl
Frame-by-frame approach
分離問題 DOA推定問題
0 100 200 300 400 500
-0.5
0
0.5
1
1.5
2
2.5
3
Frequency Bin
PhaseDifference(rad.)
Source 1
Source 2
0 100 200 300 400 500
-0.5
0
0.5
1
1.5
2
2.5
3
Frequency Bin
PhaseDifference(rad.)
Source 1
Source 2
...
0 100 200 300 400 500
-0.5
0
0.5
1
1.5
2
2.5
3
Frequency Bin
PhaseDifference(rad.)
Source 1
Source 2
PD error
distribution
DOA error
distribution
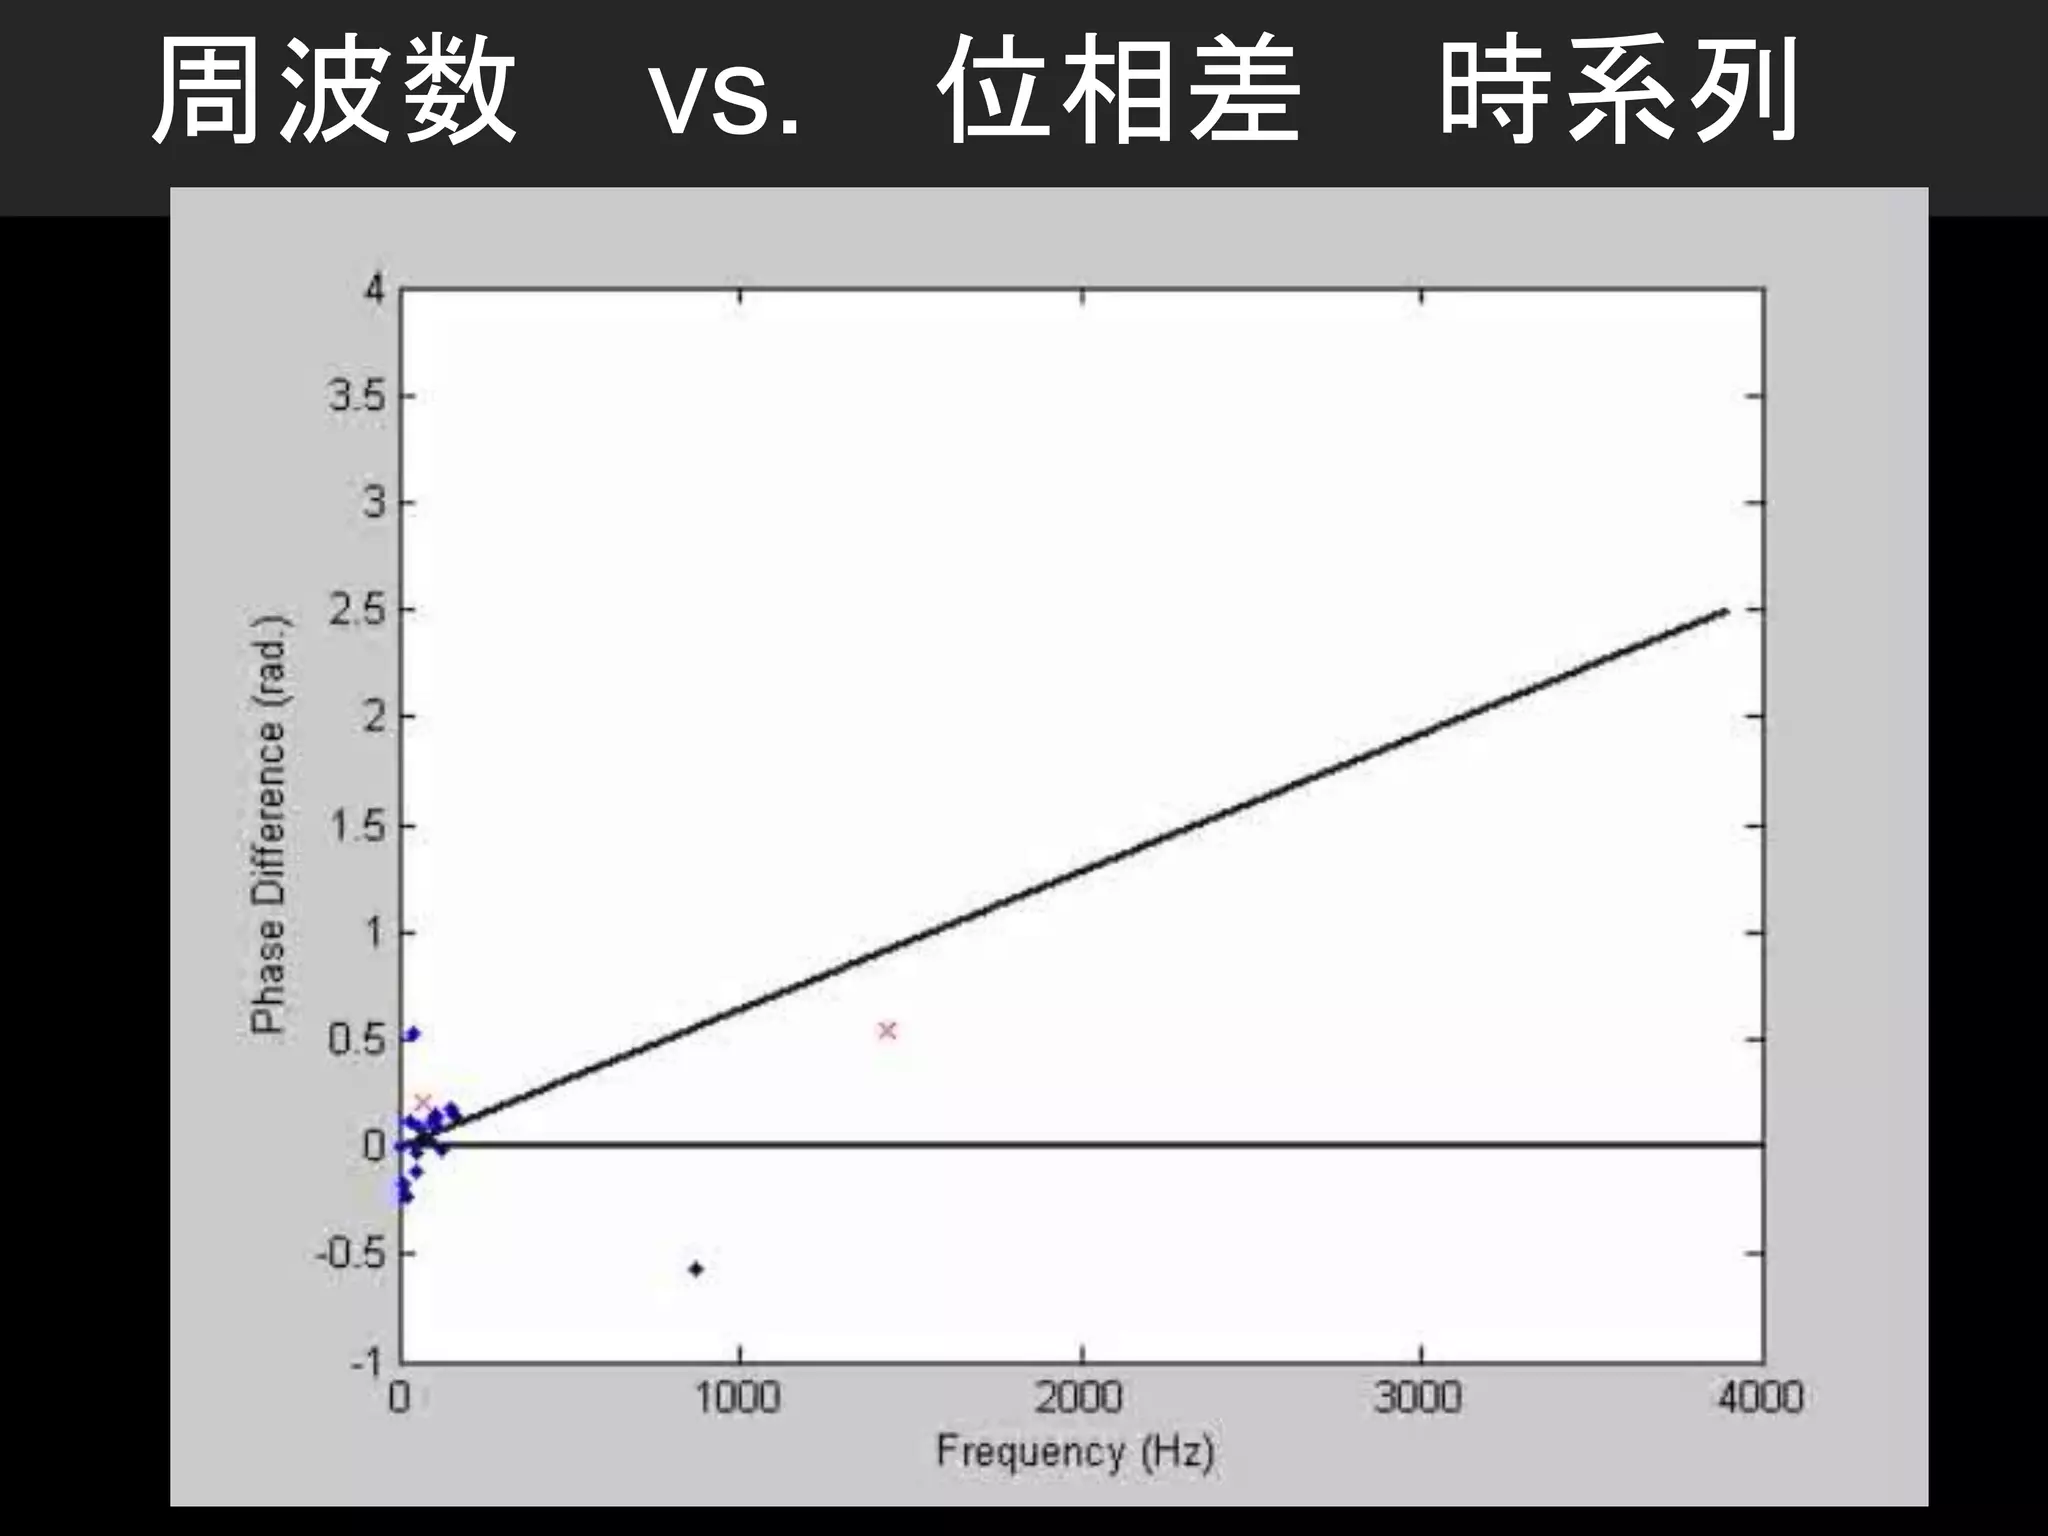
位相差 vs. 周波数 (PD-F) 分布
88
88
89.
0 100 200300 400 500
-0.5
0
0.5
1
1.5
2
2.5
3
Frequency Bin
PhaseDifference(rad.)
Source 1
Source 2
0 100 200 300 400 500 600
-0.5
0
0.5
1
1.5
2
2.5
3
Frequency Bin
PhaseDifference(rad.)
Source 1
Source 2
0 0.5 1 1.5 2 2.5 3 3.5 4 4.5 5
x 10
4
-20
-10
0
10
20
0 0.5 1 1.5 2 2.5 3 3.5 4 4.5 5
x 10
4
-10
-5
0
5
10
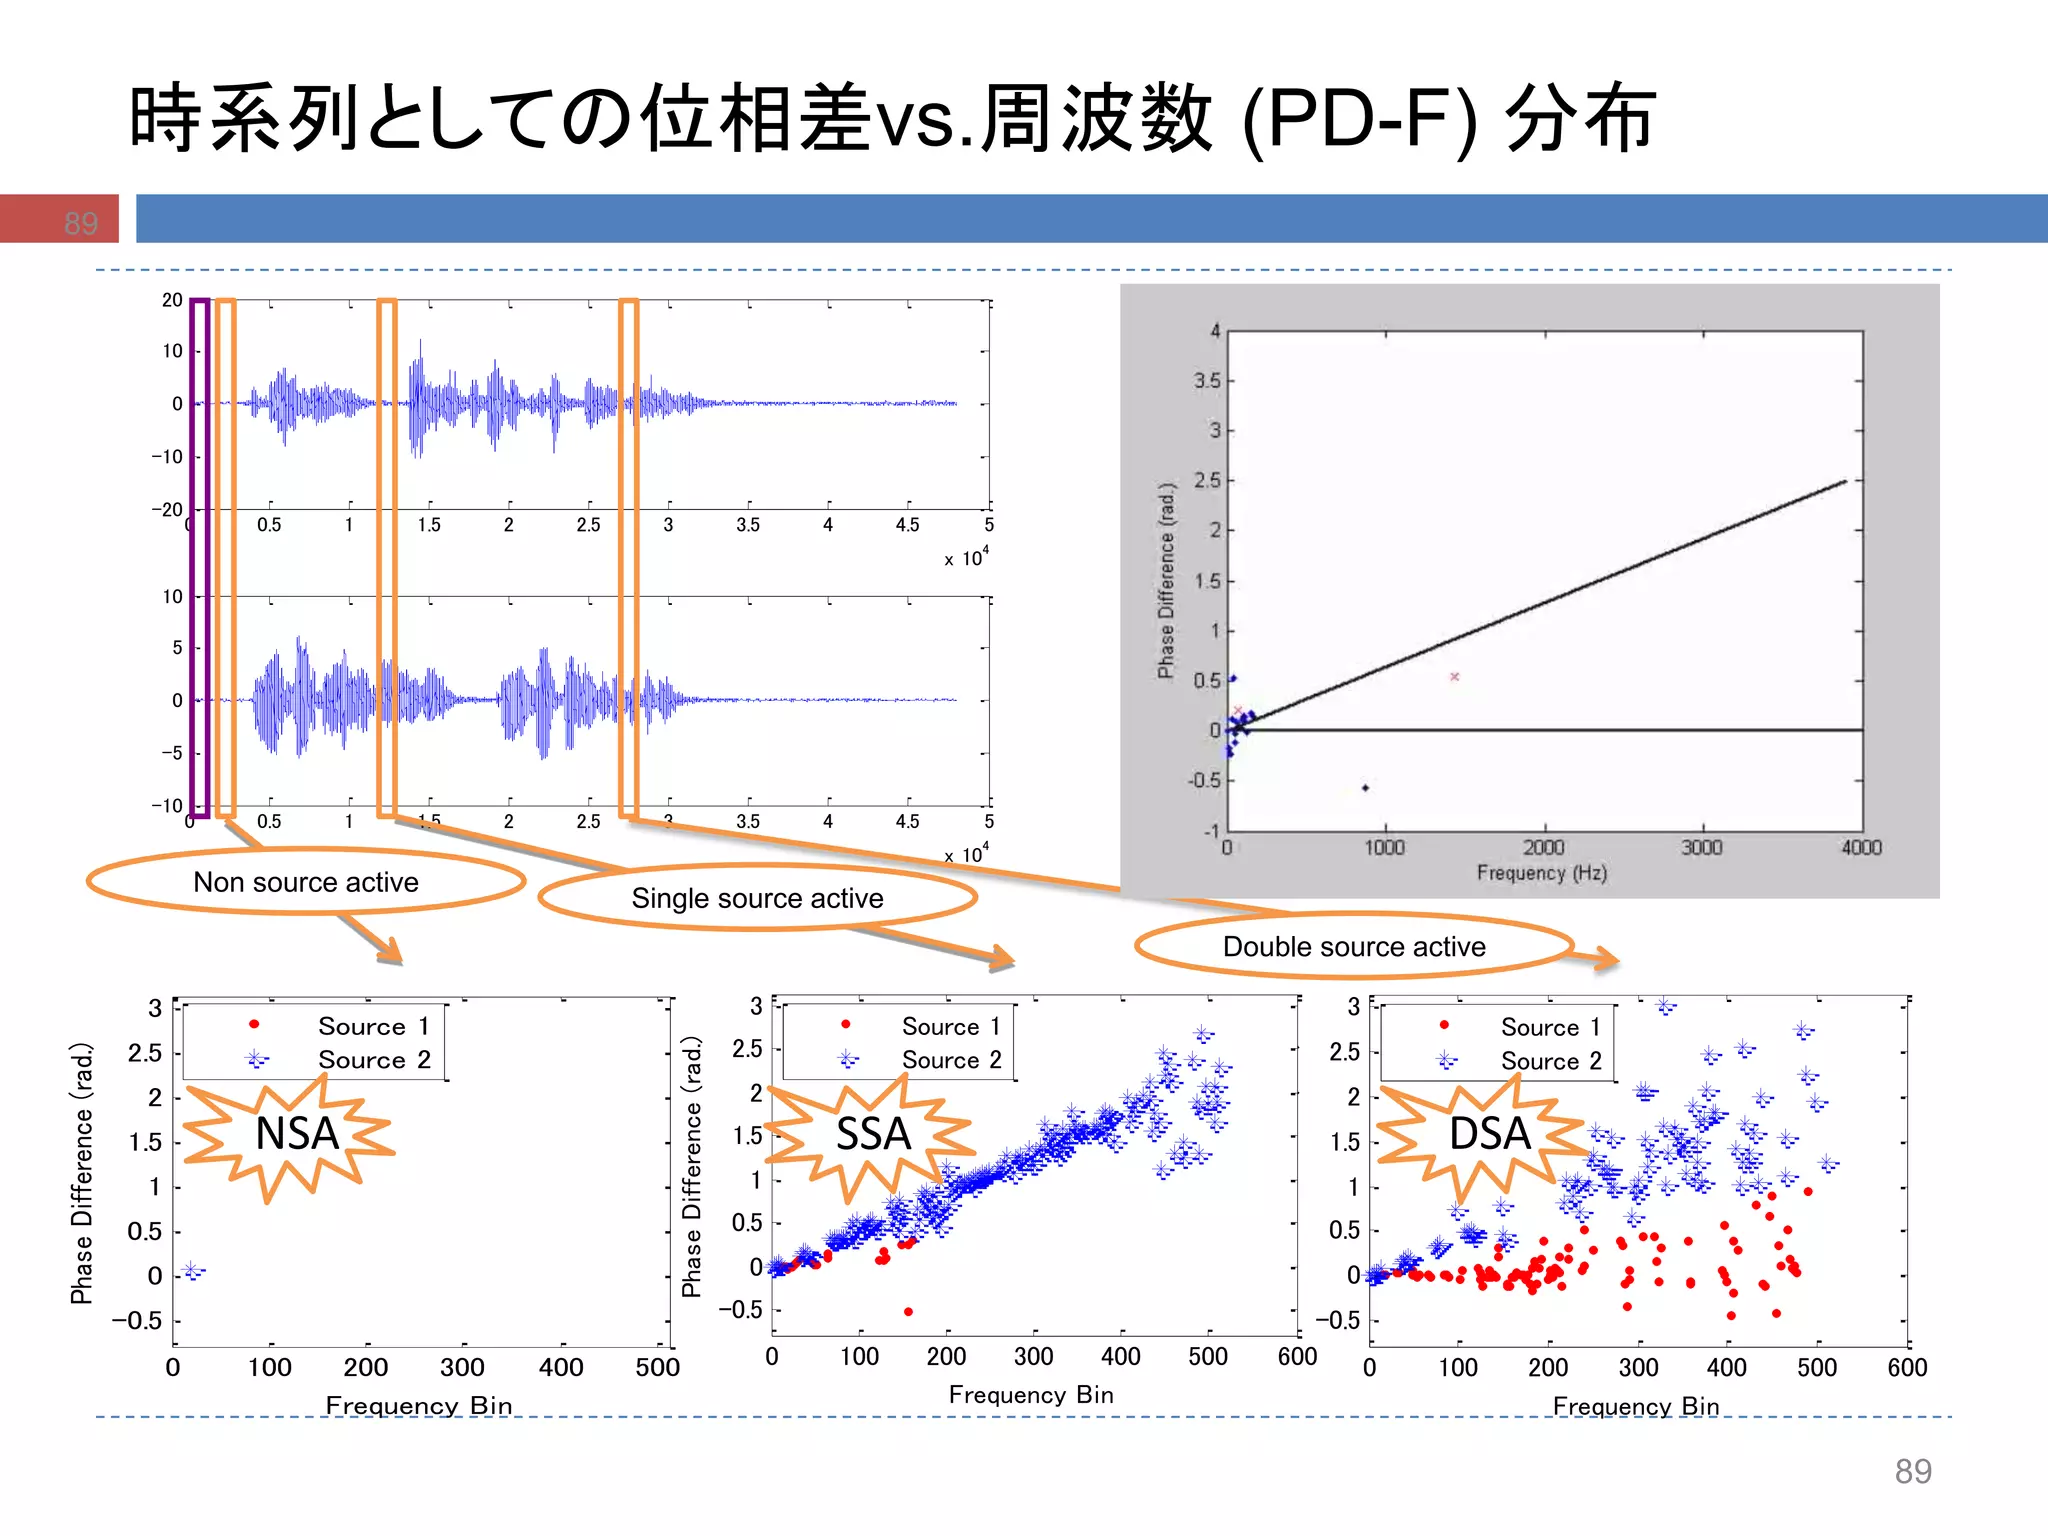
時系列としての位相差vs.周波数 (PD-F) 分布
0 100 200 300 400 500 600
-0.5
0
0.5
1
1.5
2
2.5
3
Frequency Bin
PhaseDifference(rad.)
Source 1
Source 2
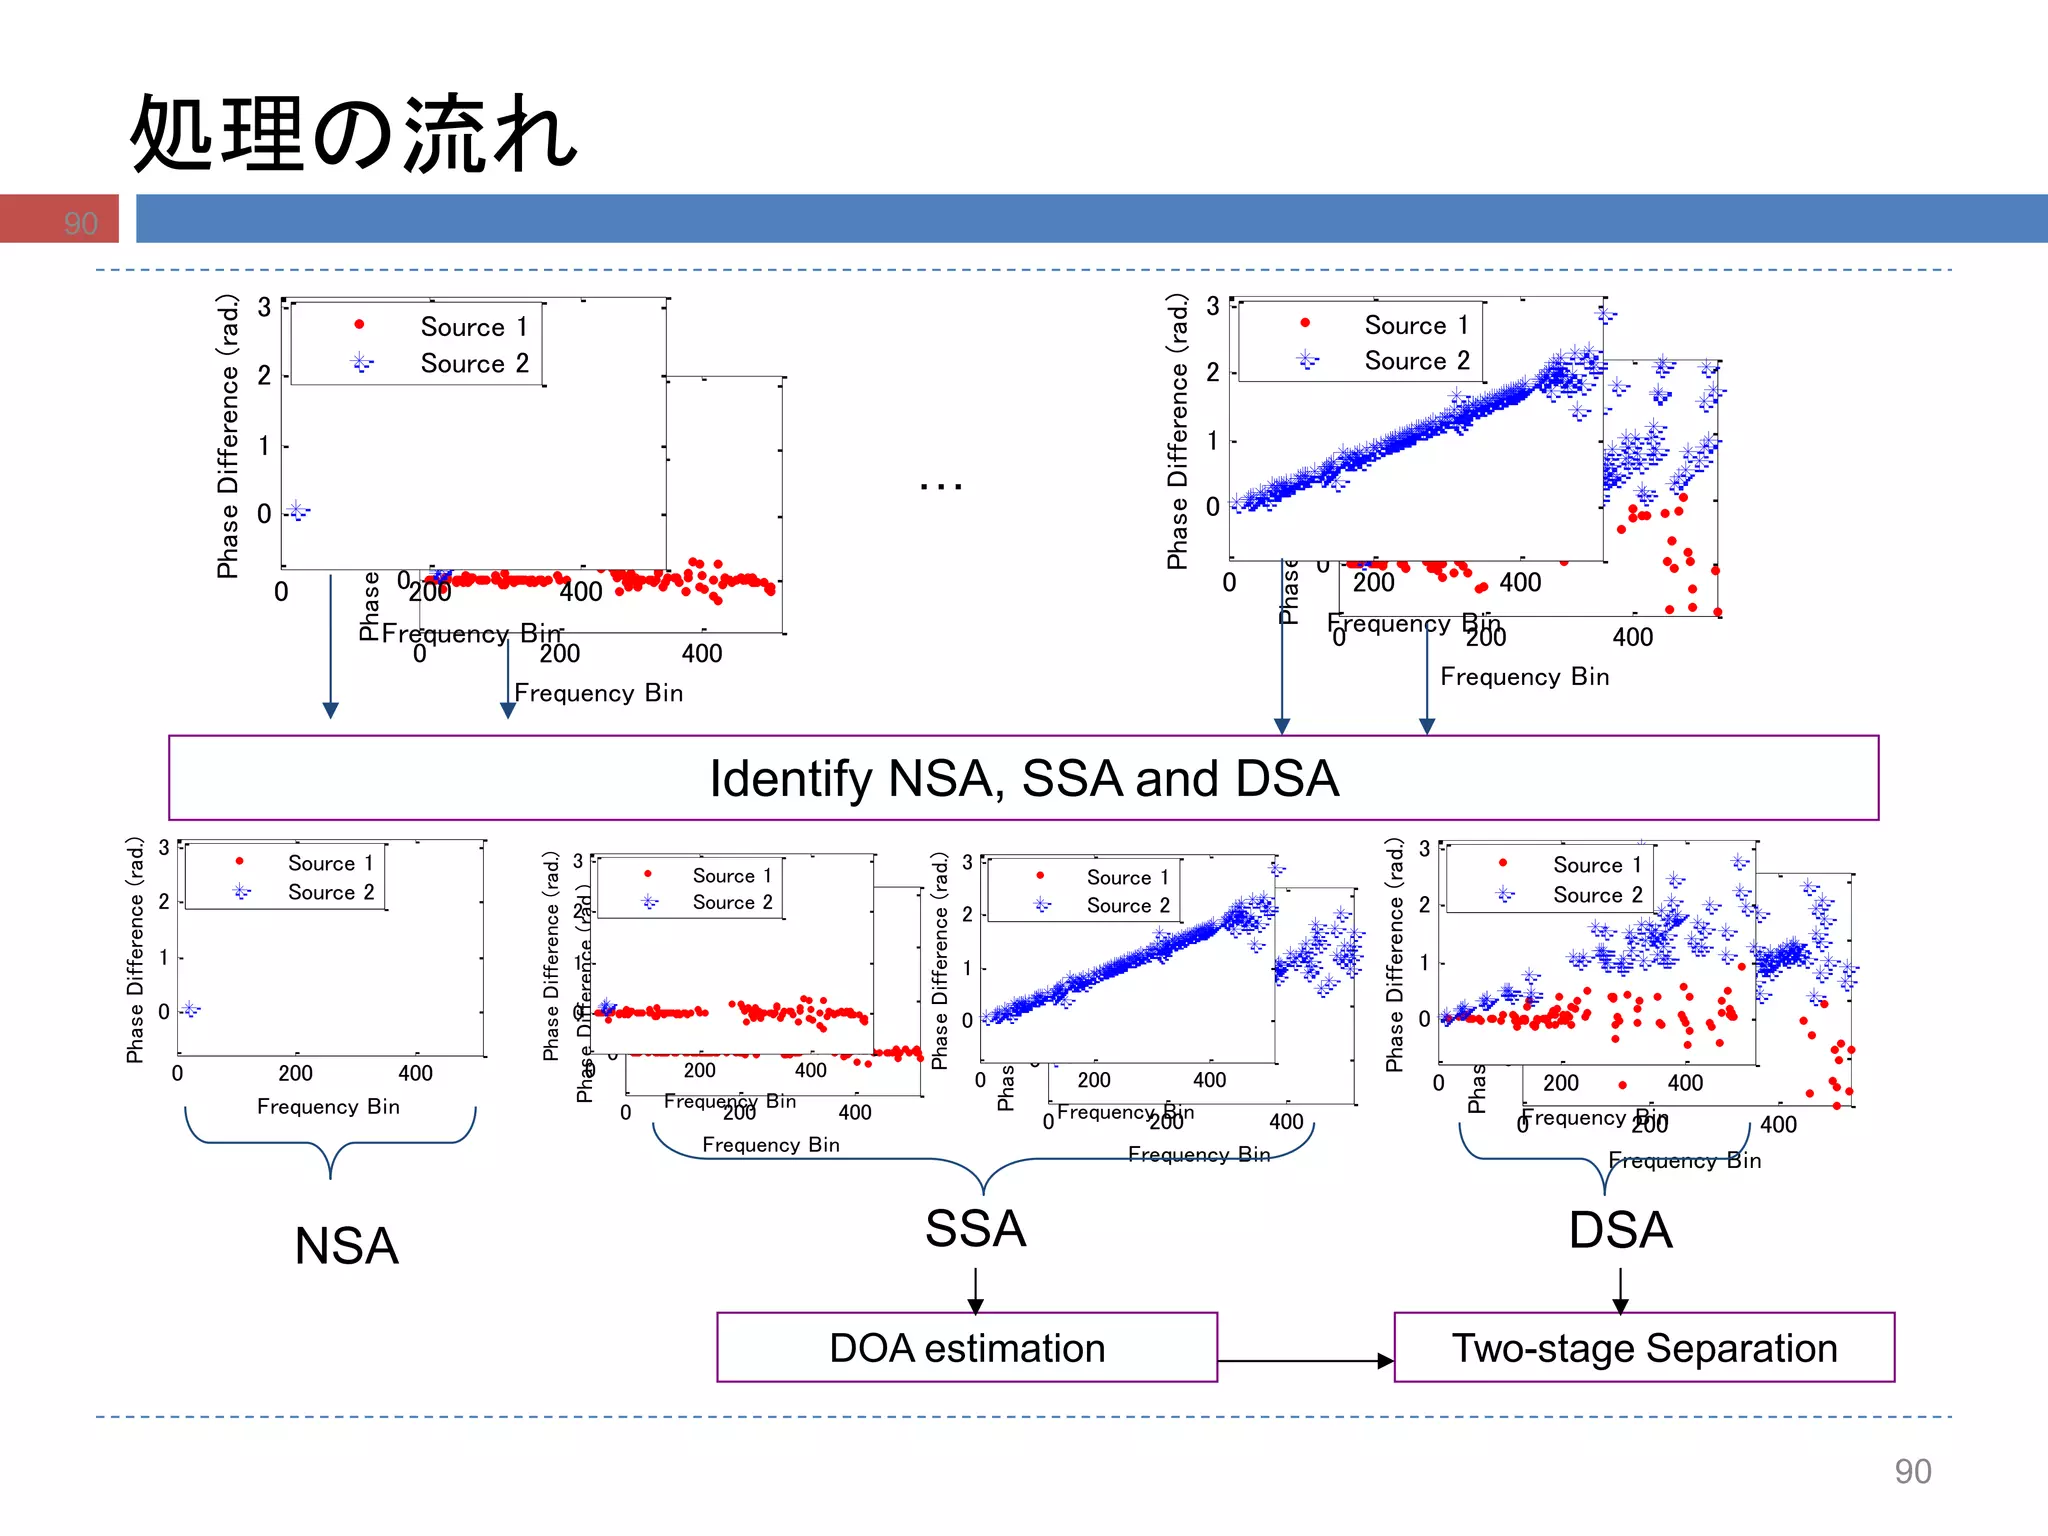
NSA SSA DSA
89
Non source active
Single source active
Double source active
89
90.
処理の流れ
0 200 400
0
1
2
3
FrequencyBin
PhaseDifference(rad.)
Source 1
Source 2
0 200 400
0
1
2
3
Frequency Bin
PhaseDifference(rad.)
Source 1
Source 2
0 200 400
0
1
2
3
Frequency Bin
PhaseDifference(rad.)
Source 1
Source 2
0 200 400
0
1
2
3
Frequency Bin
PhaseDifference(rad.)
Source 1
Source 2
0 200 400
0
1
2
3
Frequency Bin
PhaseDifference(rad.)
Source 1
Source 2
0 200 400
0
1
2
3
Frequency Bin
PhaseDifference(rad.)
Source 1
Source 2
0 200 400
0
1
2
3
Frequency Bin
PhaseDifference(rad.)
Source 1
Source 2
0 200 400
0
1
2
3
Frequency Bin
PhaseDifference(rad.)
Source 1
Source 2
0 200 400
0
1
2
3
Frequency Bin
PhaseDifference(rad.)
Source 1
Source 2
0 200 400
0
1
2
3
Frequency Bin
PhaseDifference(rad.)
Source 1
Source 2
…
Identify NSA, SSA and DSA
0 200 400
0
1
2
3
Frequency Bin
PhaseDifference(rad.)
Source 1
Source 2
NSA SSA DSA
DOA estimation Two-stage Separation
90
90
91.
Non source active(NSA)
91
The noise level is assumed to be sufficiently low with respect to the level of
the sources.
NSA criterion:
NSAframethkthenThkEif ,1)(
The average local power of frame k is defined as
2/
0
2
1 ],[
12/
1
:)(
L
l
lkX
L
kE
EETh 201
:0E
:E
Average noise value
Standard deviation
0 100 200 300 400 500
-0.5
0
0.5
1
1.5
2
2.5
3
Frequency Bin
PhaseDifference(rad.)
Source 1
Source 2
91
92.
0 100 200300 400 500 600
-0.5
0
0.5
1
1.5
2
2.5
3
Frequency Bin
PhaseDifference(rad.)
Source 1
Source 2
0 100 200 300 400 500 600
-0.5
0
0.5
1
1.5
2
2.5
3
Frequency Bin
PhaseDifference(rad.)
Source 1
Source 2
0 100 200 300 400 500 600
-0.5
0
0.5
1
1.5
2
2.5
3
Frequency Bin
PhaseDifference(rad.)
Source 1
Source 2
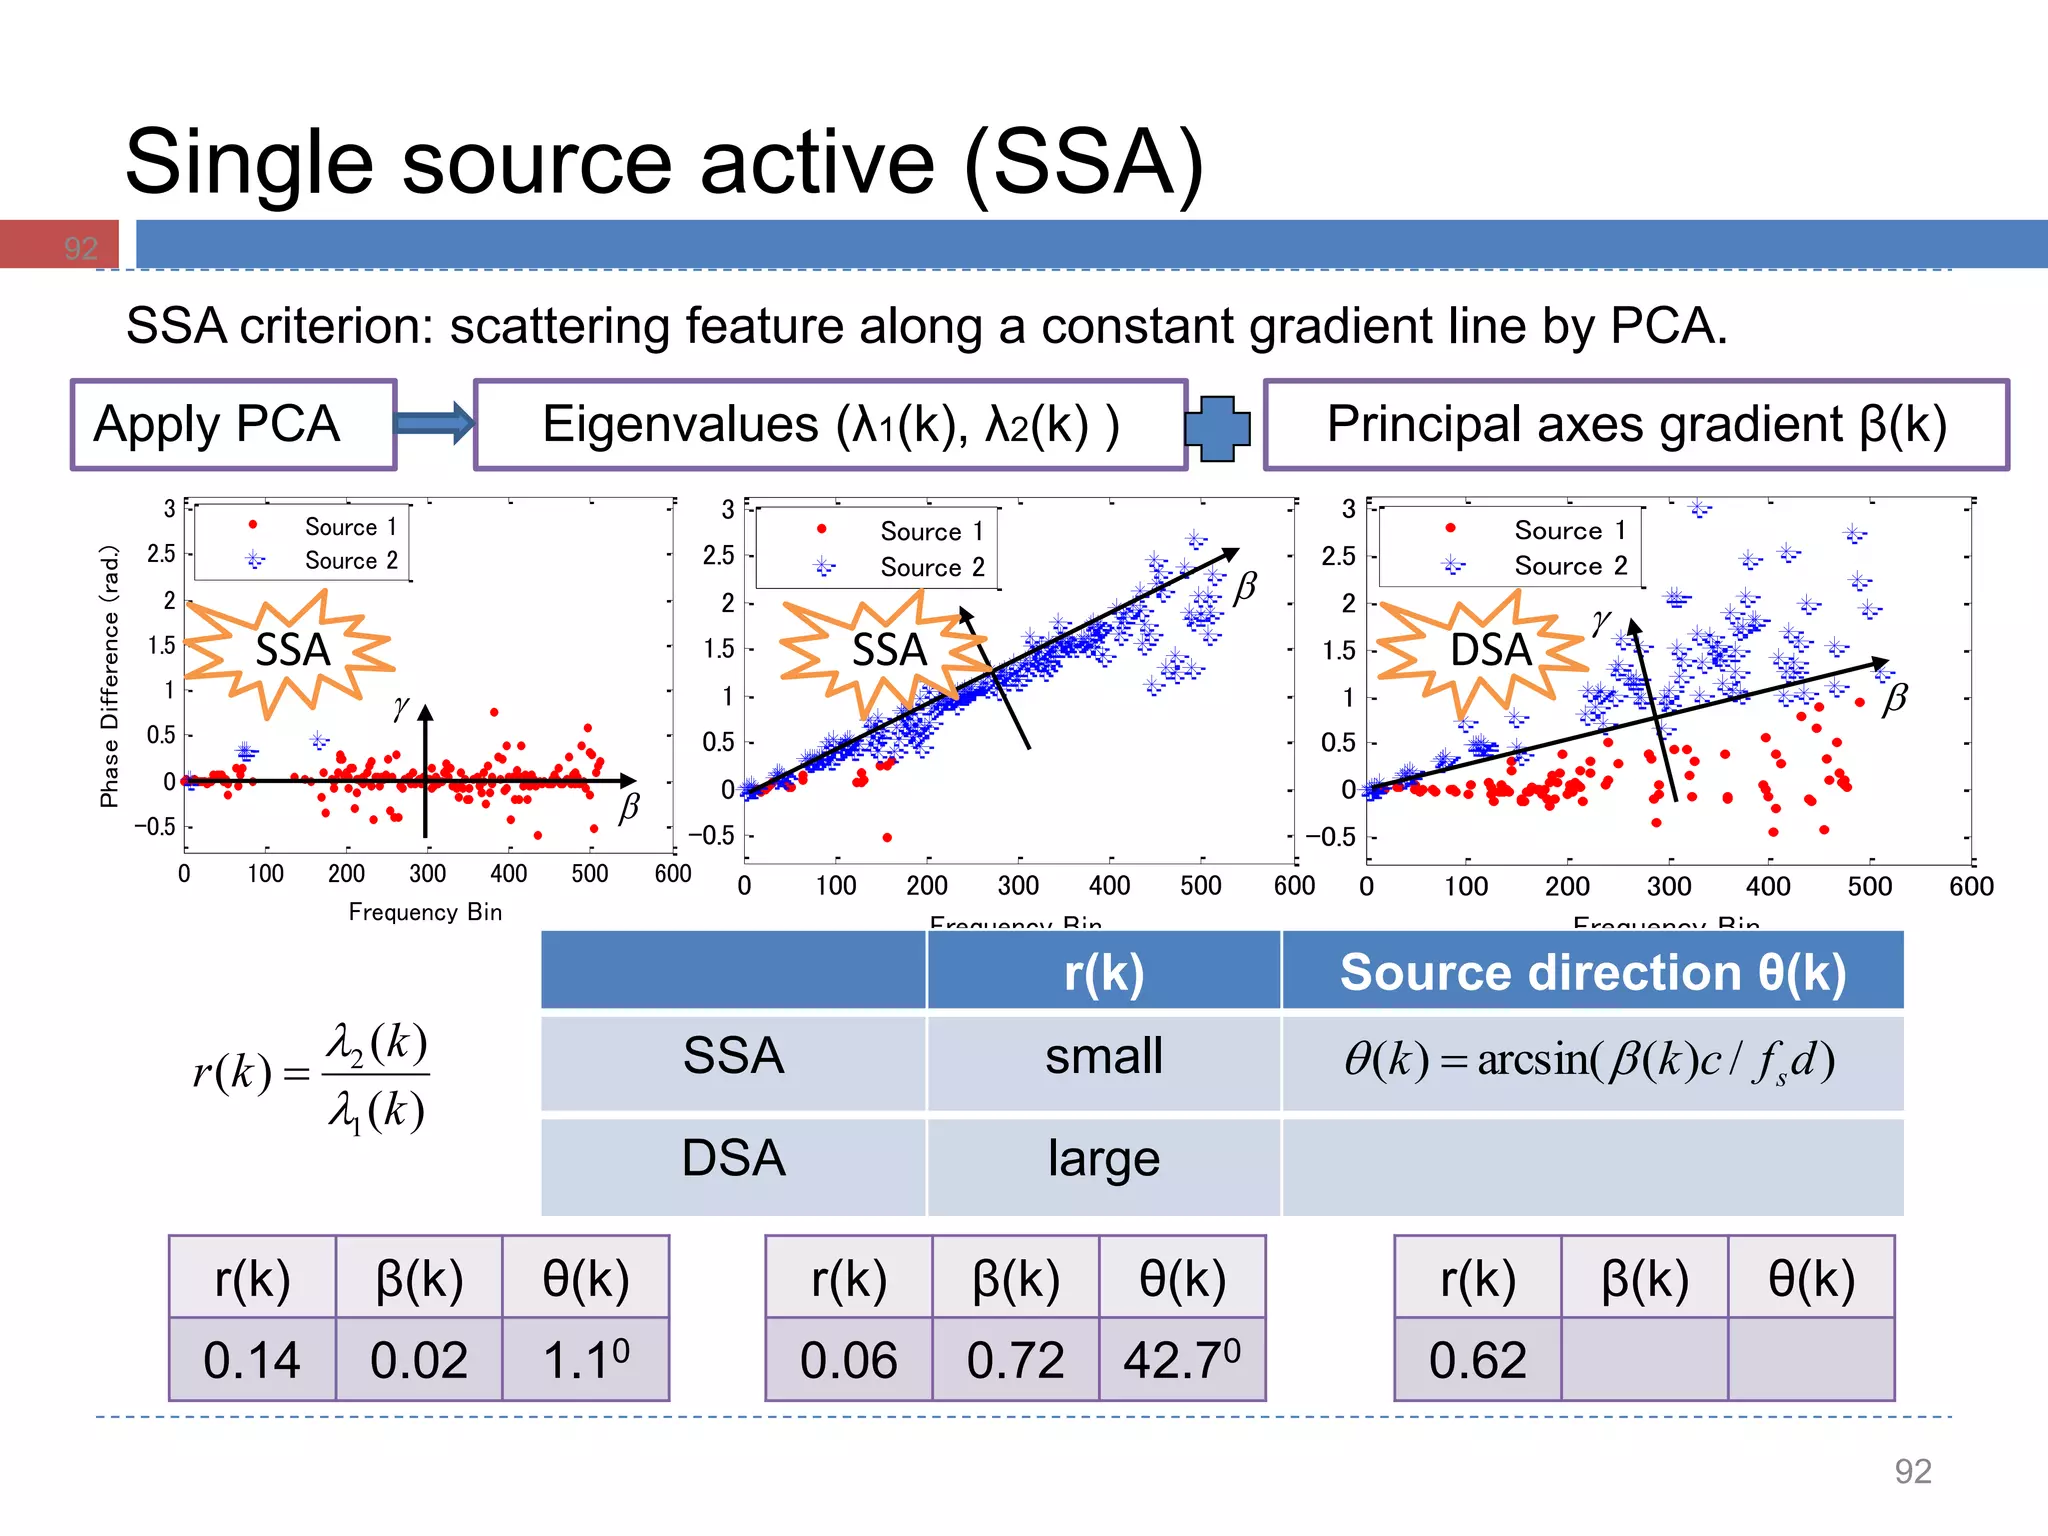
Single source active (SSA)
92
SSA criterion: scattering feature along a constant gradient line by PCA.
SSA DSASSA
r(k) β(k) θ(k)
0.14 0.02 1.10
r(k) β(k) θ(k)
0.06 0.72 42.70
r(k) β(k) θ(k)
0.62
Apply PCA Eigenvalues (λ1(k), λ2(k) ) Principal axes gradient β(k)
r(k) Source direction θ(k)
SSA small
DSA large
)(
)(
)(
1
2
k
k
kr
)/)(arcsin()( dfckk s
92
93.
SSA フレームの検出
0 0.51 1.5 2 2.5 3 3.5 4 4.5 5
x 10
4
-20
-10
0
10
20
0 0.5 1 1.5 2 2.5 3 3.5 4 4.5 5
x 10
4
-10
-5
0
5
10
0 20 40 60 80
0
0.2
0.4
0.6
0.8
1
Time frame
Theratioofeigenvaluesr
NSA
DSA
SSA
Total number of SSA frame 101
Correct identification by proposed method 75
Accuracy rate 74.2%
Original signal Estimated results
93
r(k)
94.
0 100 200300 400 500
-0.5
0
0.5
1
1.5
2
2.5
3
Frequency Bin
PhaseDifference(rad.)
Source 1
Source 2
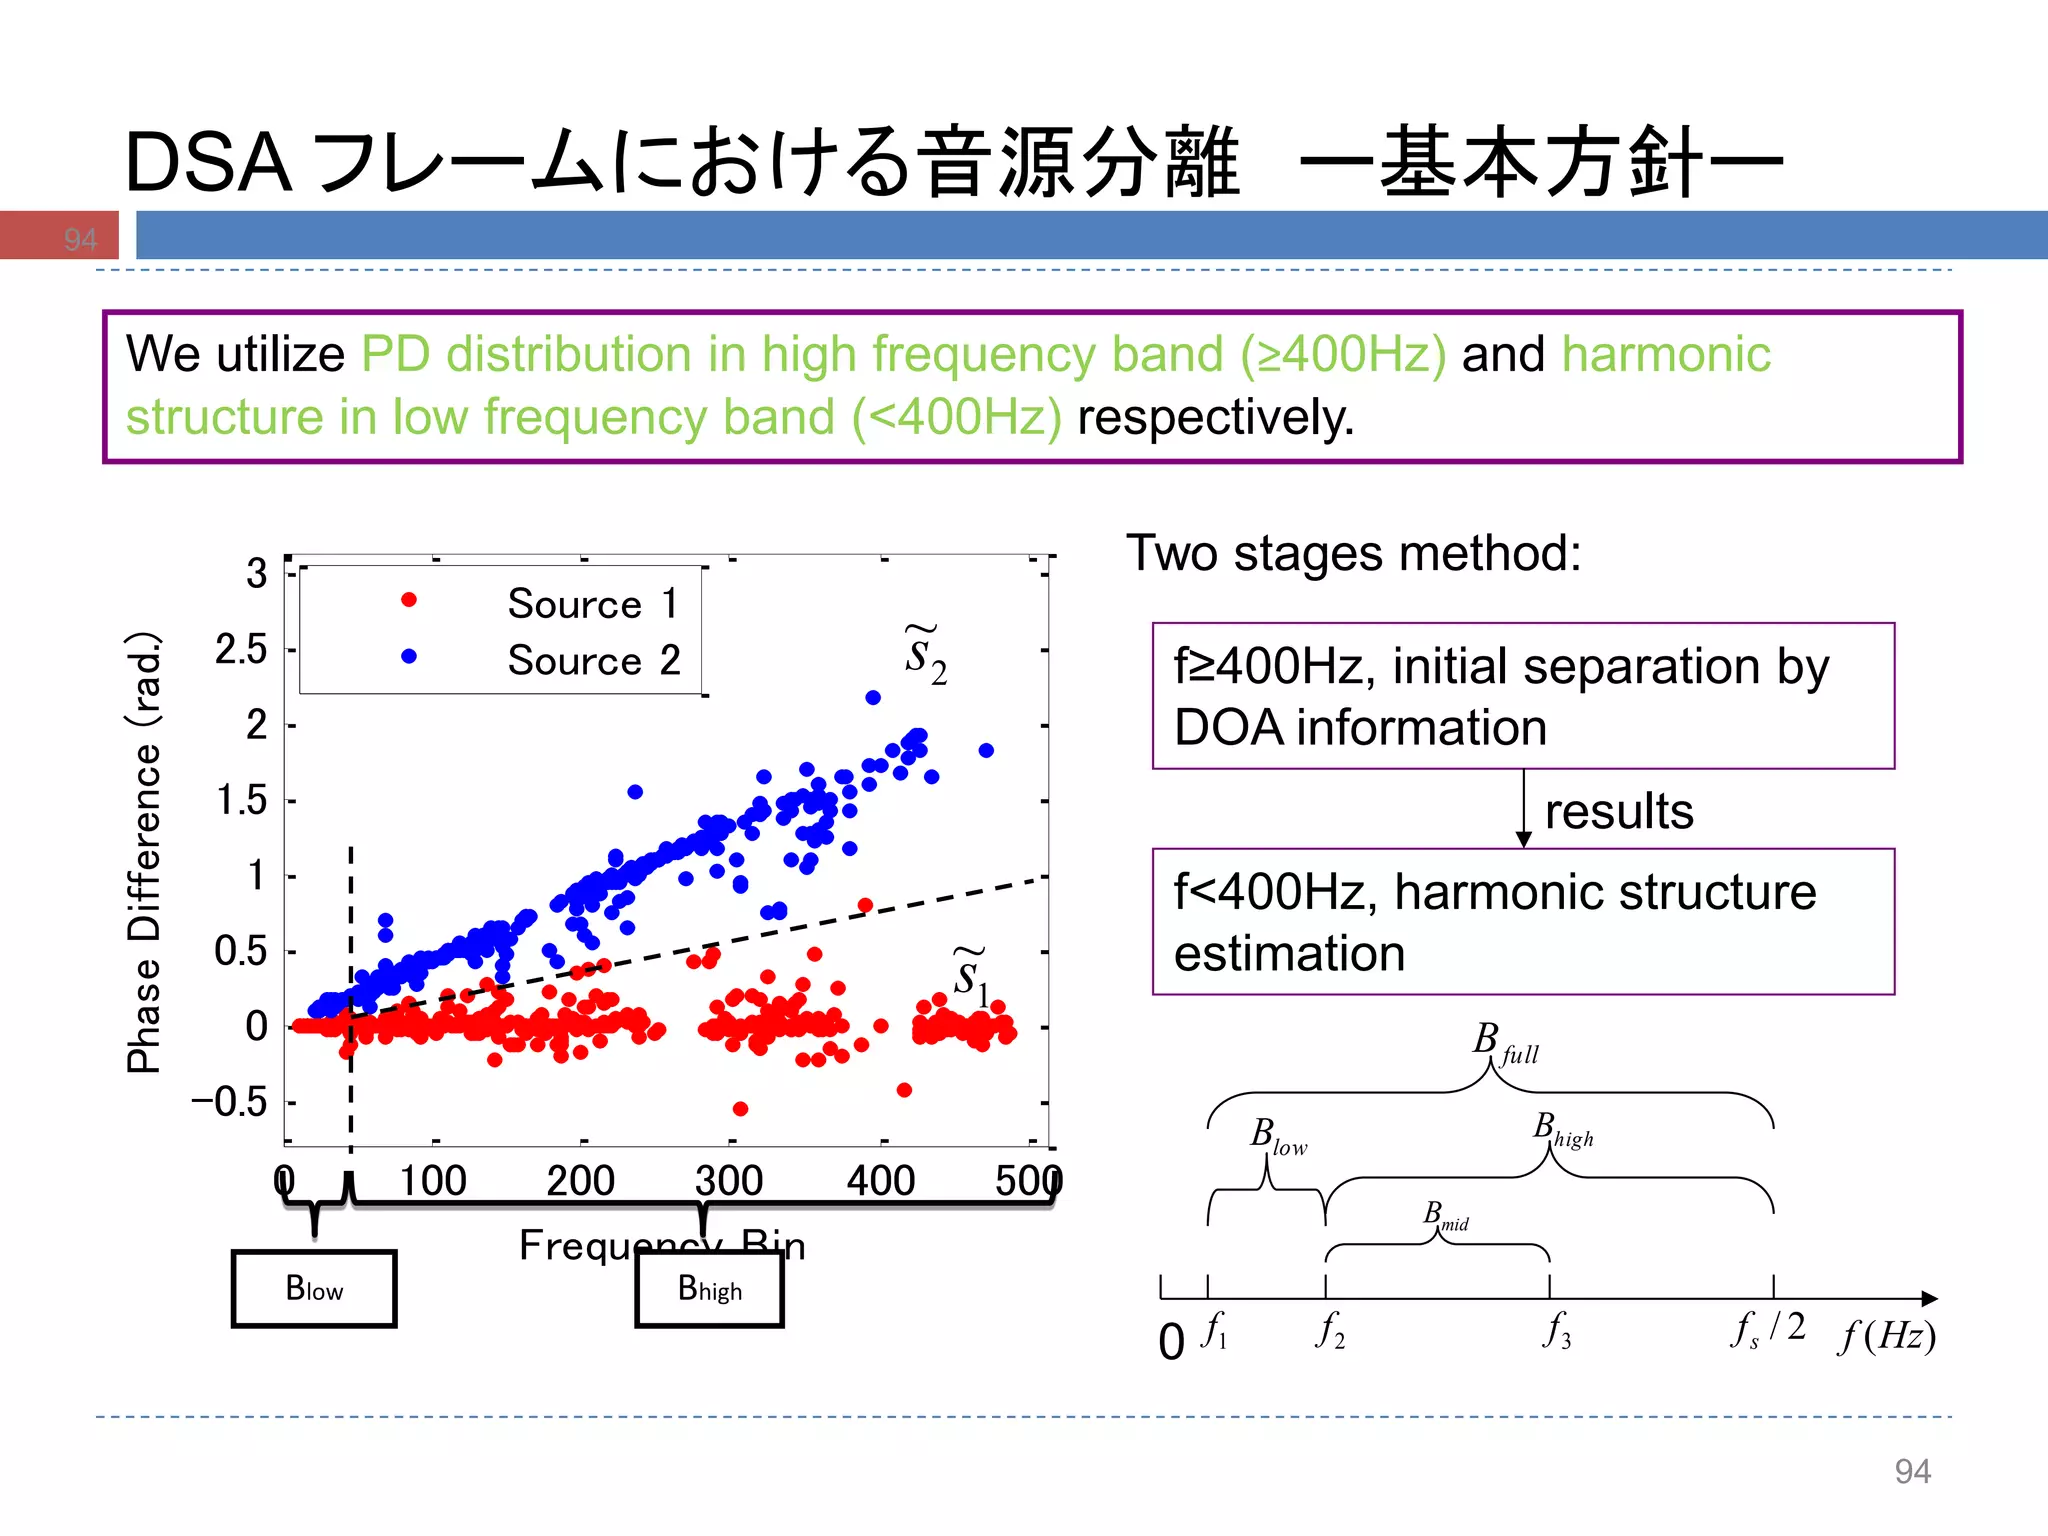
DSA フレームにおける音源分離 ー基本方針ー
94
We utilize PD distribution in high frequency band (≥400Hz) and harmonic
structure in low frequency band (<400Hz) respectively.
BhighBlow
2
~s
1
~s
)(Hzf0
midB
fullB
lowB highB
1f 2f 3f 2/sf
Two stages method:
f≥400Hz, initial separation by
DOA information
f<400Hz, harmonic structure
estimation
results
94
95.
0 100 200300 400 500
-0.5
0
0.5
1
1.5
2
2.5
3
Frequency Bin
PhaseDifference(rad.)
Source 1
Source 2
95
DSA フレームにおける音源分離
otherwise
Blllkiif
lkM
highc
c
i
0
,],[minarg1
],[
~ )2,1(
],[
~
],[],[
~
1 lkMlkXlkS ii
Local maximum frequencies of
),(),( 21 kbkb ii
Number of local maxima )(kqi
2
],[
~
max
],[
~
Th
vkS
lkS
i
v
i
2.02 Th
1080/ sfLl
初期推定 highB
極大値探索
midB
2
~s
1
~s
0 100 200 300 400 500 600 700 800 900
0
50
100
150
200
250
300
350
Frequency (Hz)
Power
],[
~
lkSi
96.
96
DSAフレームにおける音源分離
マスク生成と分離
調波構造の推定 lowB
2)(),()()( 12 kqkbkbkd iiii
nkdkbkg iiin )()()( 1
2)(,0
),()(
vkqvsmallest
vkgkg
i
inin
otherwise
nBlkq
andkglkgif
lkM lowi
inin
i
0
,3,2,1,,2)(
,2)()2(1
],[
~
],[],[],[ˆ
1 lkMlkXlkS ii
],[],[
~
],[ lkMlkMlkM iii
2)( kqif i 0 100 200 300 400 500 600 700 800 900
0
50
100
150
200
250
300
350
Frequency (Hz)
Power
If there are more than two peaks
If there is single or no peak, using
the nearest frame
97.
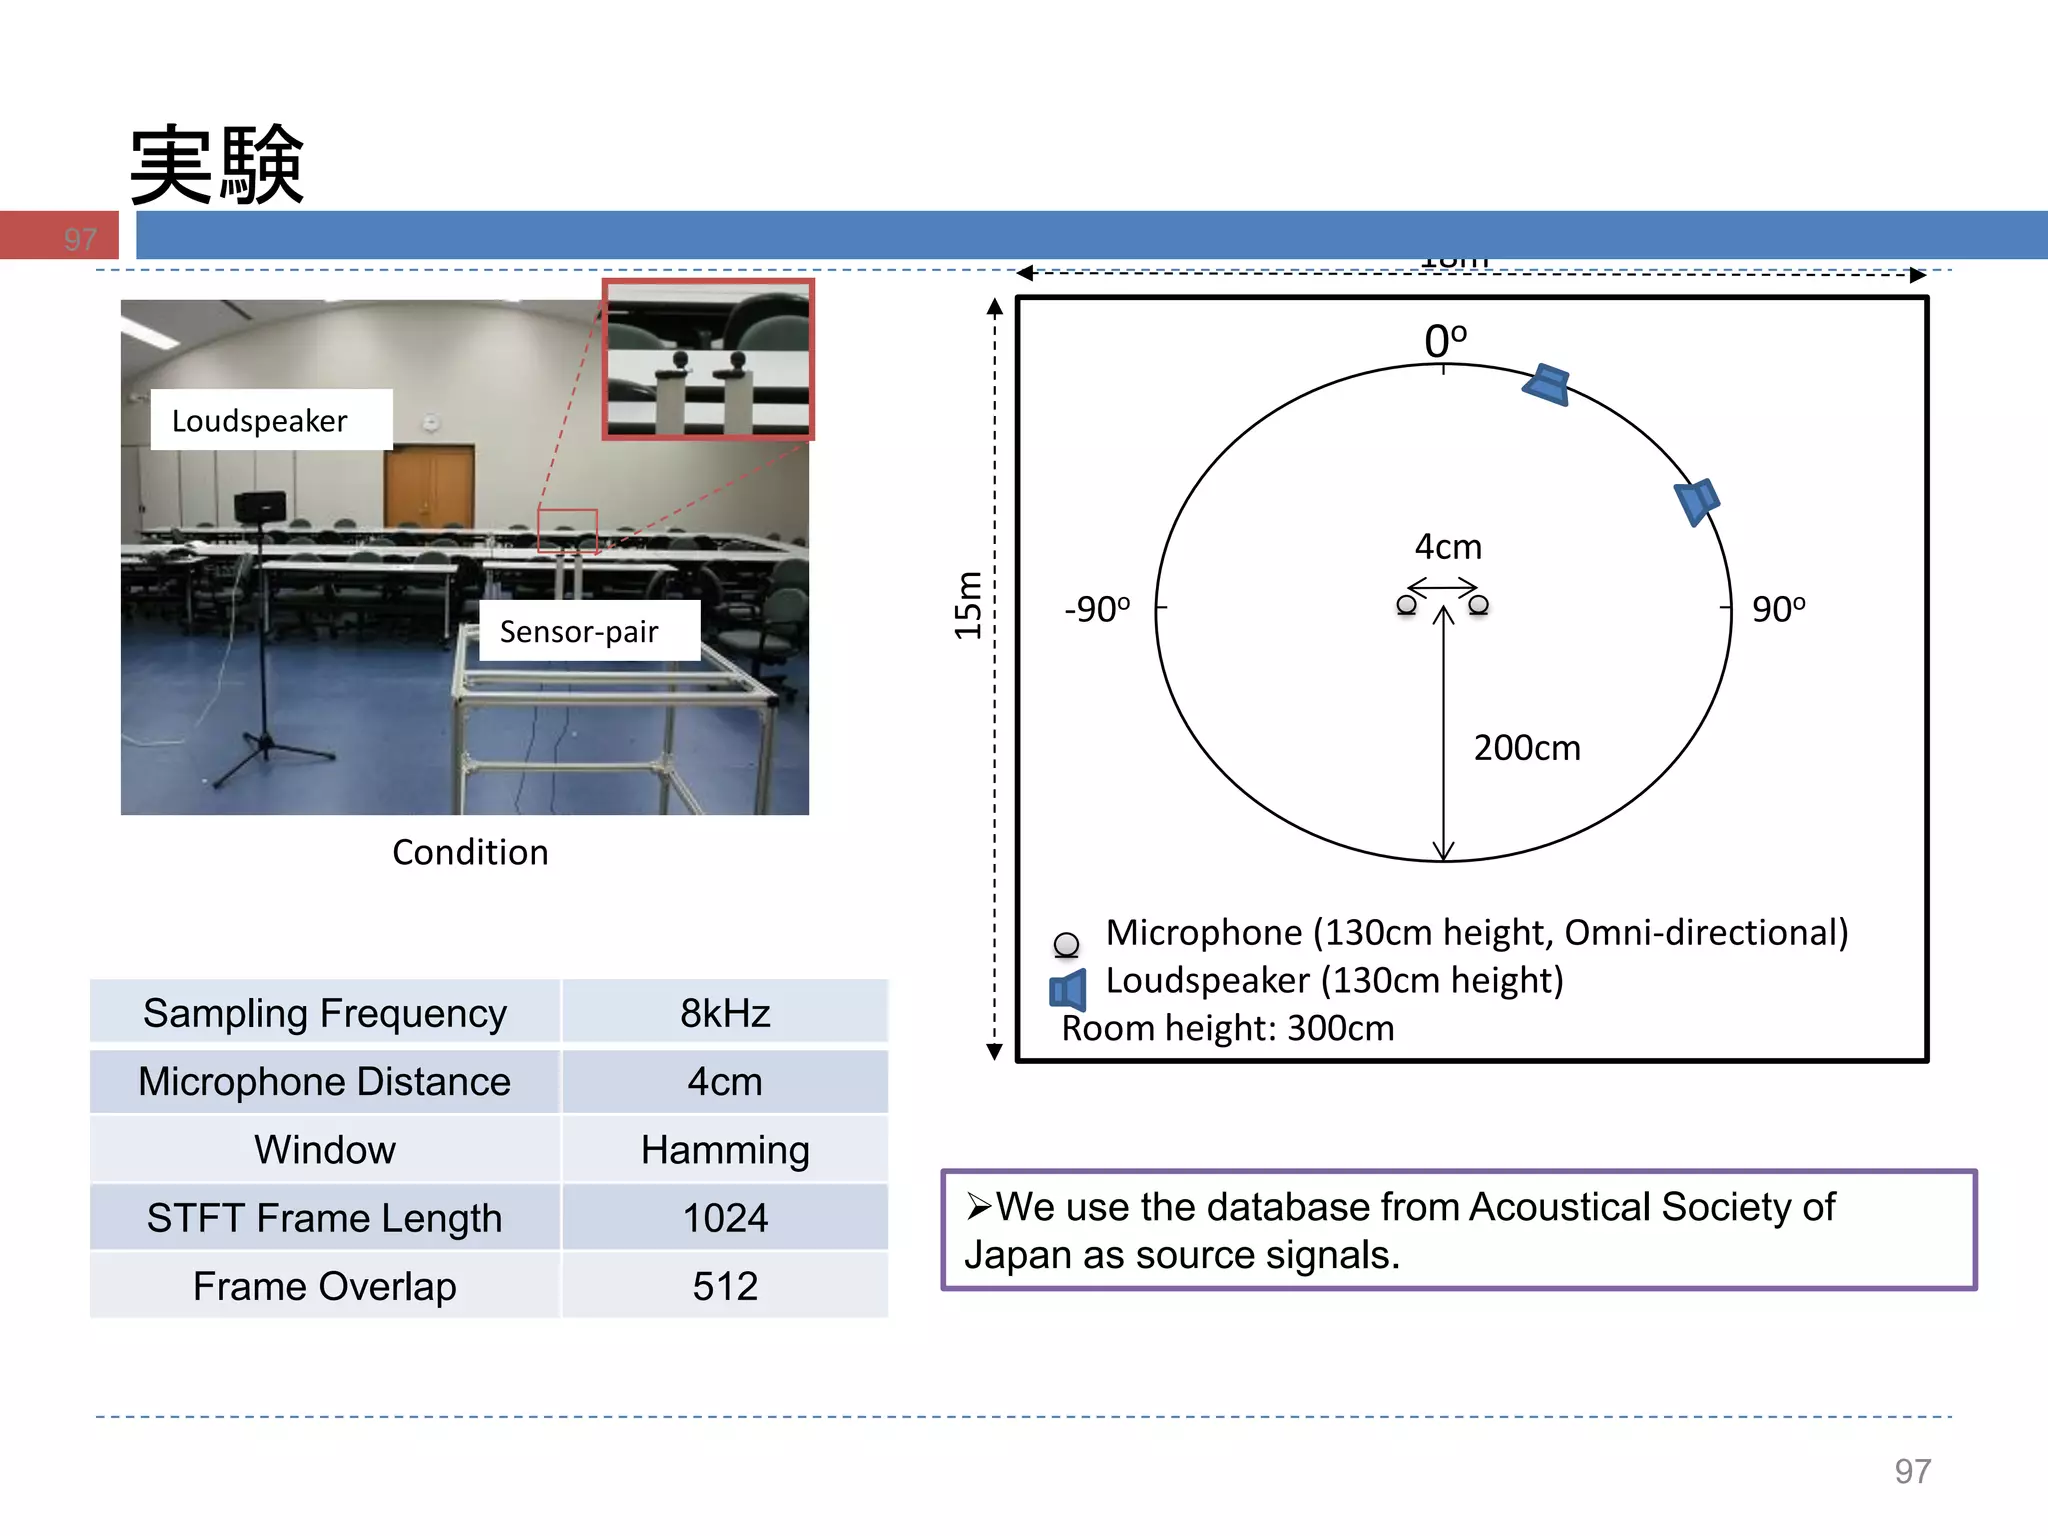
97
実験
Loudspeaker
Sensor-pair
Condition
We use thedatabase from Acoustical Society of
Japan as source signals.
Sampling Frequency 8kHz
Microphone Distance 4cm
Window Hamming
STFT Frame Length 1024
Frame Overlap 512
18m
15m
4cm
200cm
Microphone (130cm height, Omni-directional)
Loudspeaker (130cm height)
Room height: 300cm
0o
90o-90o
97
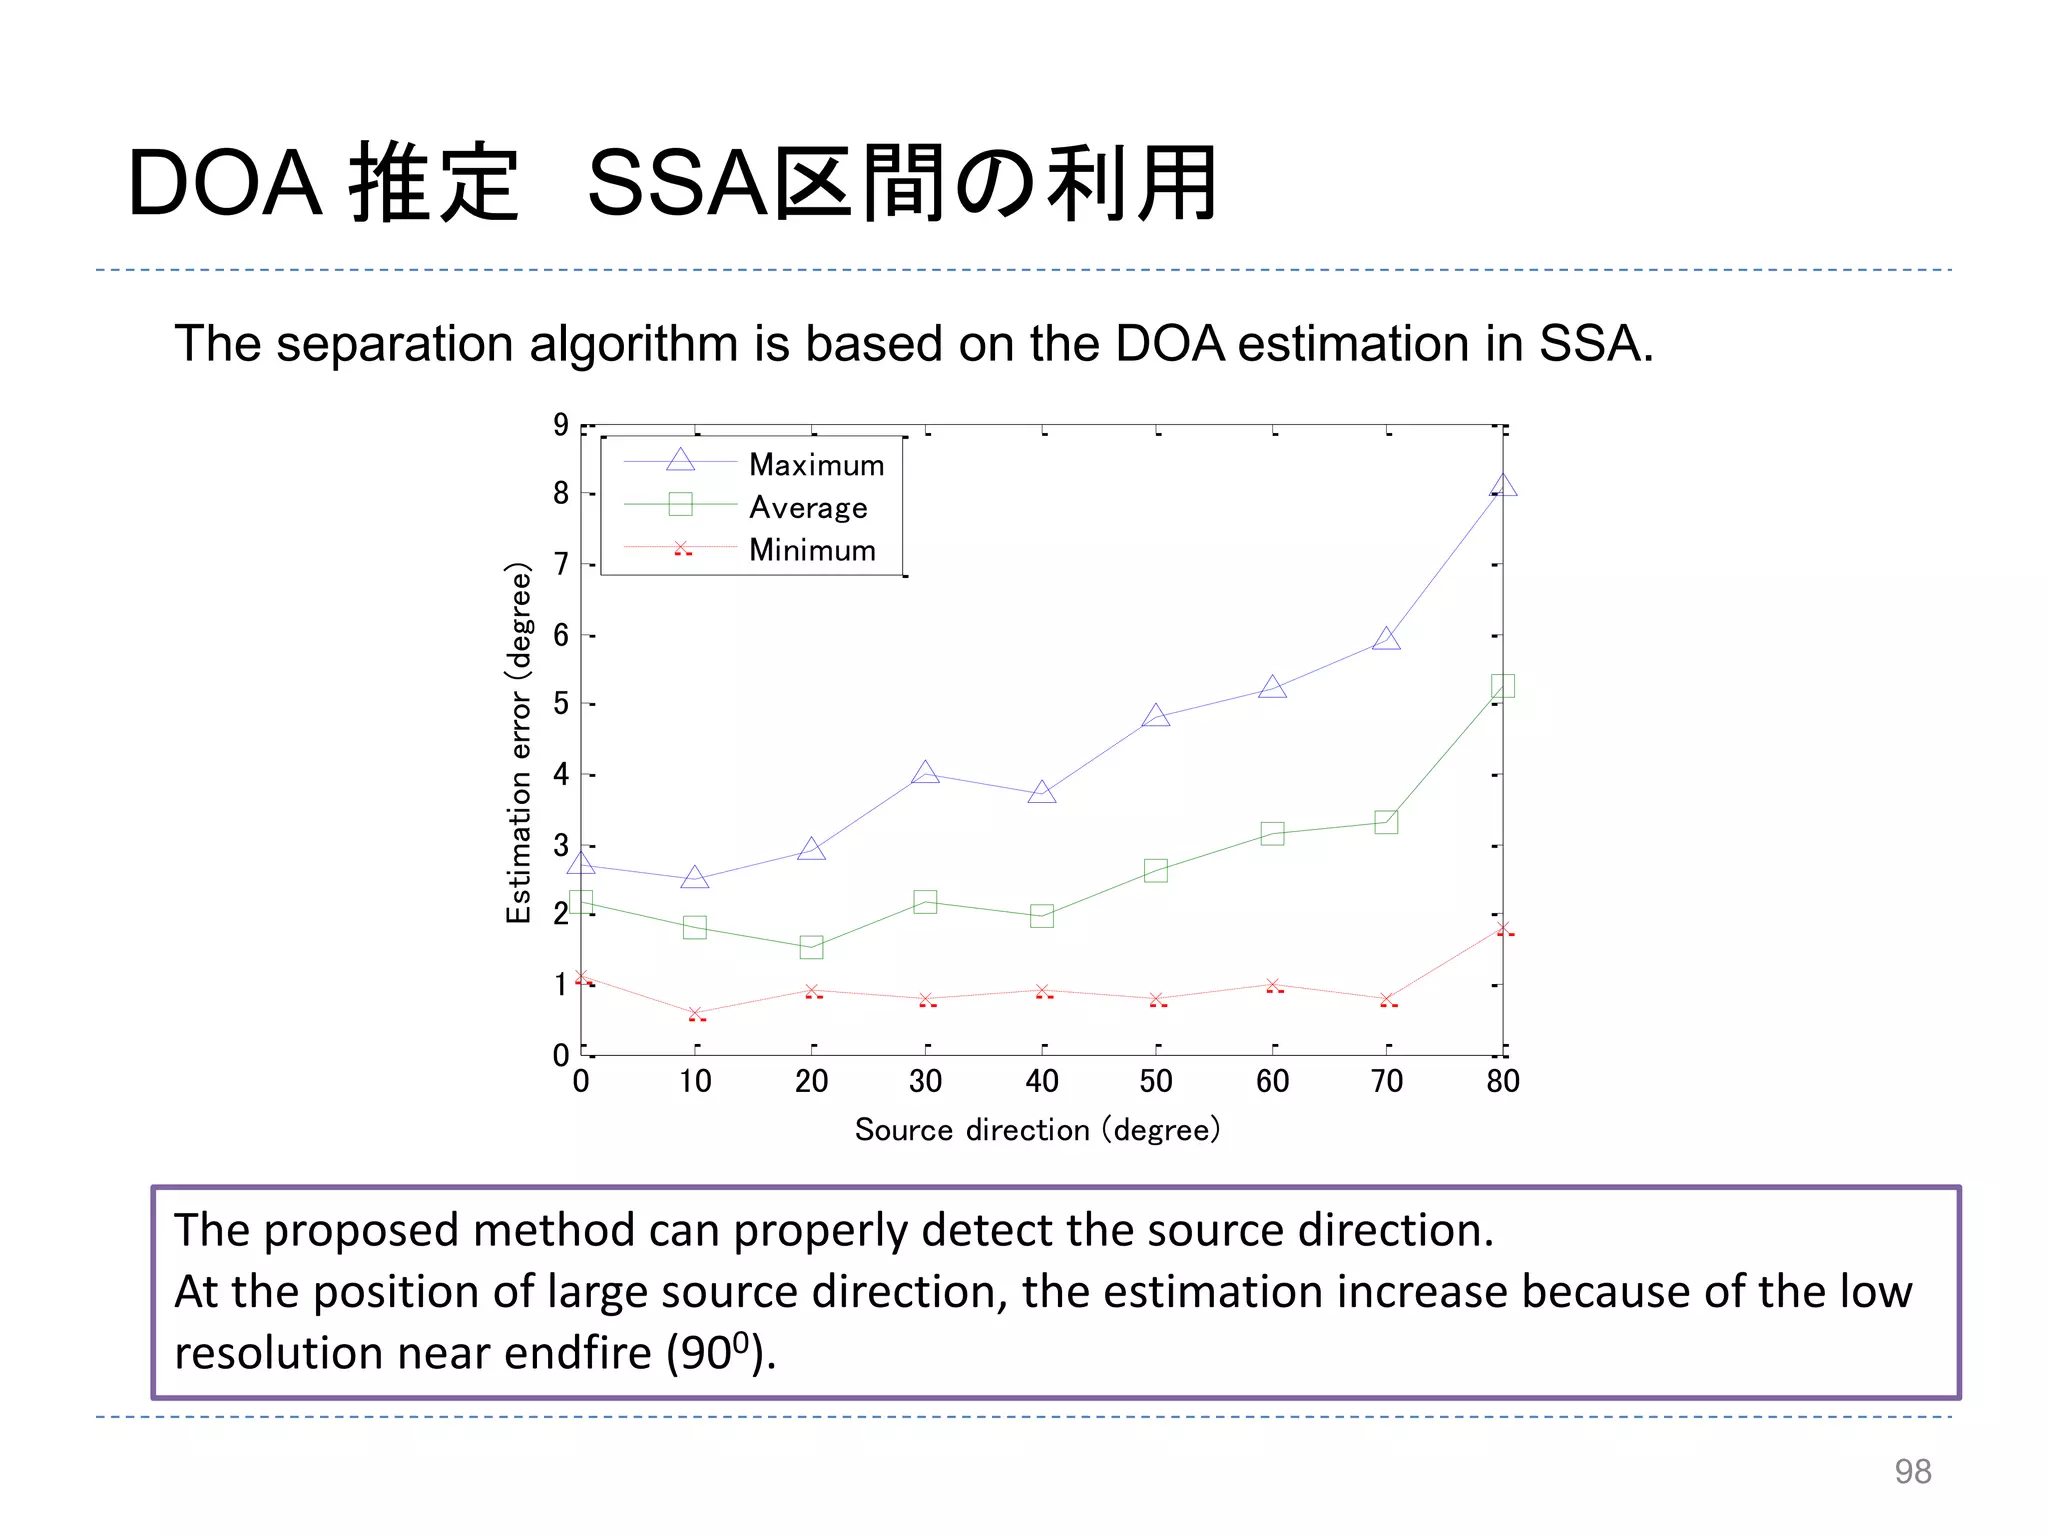
98.
98
DOA 推定 SSA区間の利用
010 20 30 40 50 60 70 80
0
1
2
3
4
5
6
7
8
9
Source direction (degree)
Estimationerror(degree)
Maximum
Average
Minimum
The proposed method can properly detect the source direction.
At the position of large source direction, the estimation increase because of the low
resolution near endfire (900).
The separation algorithm is based on the DOA estimation in SSA.
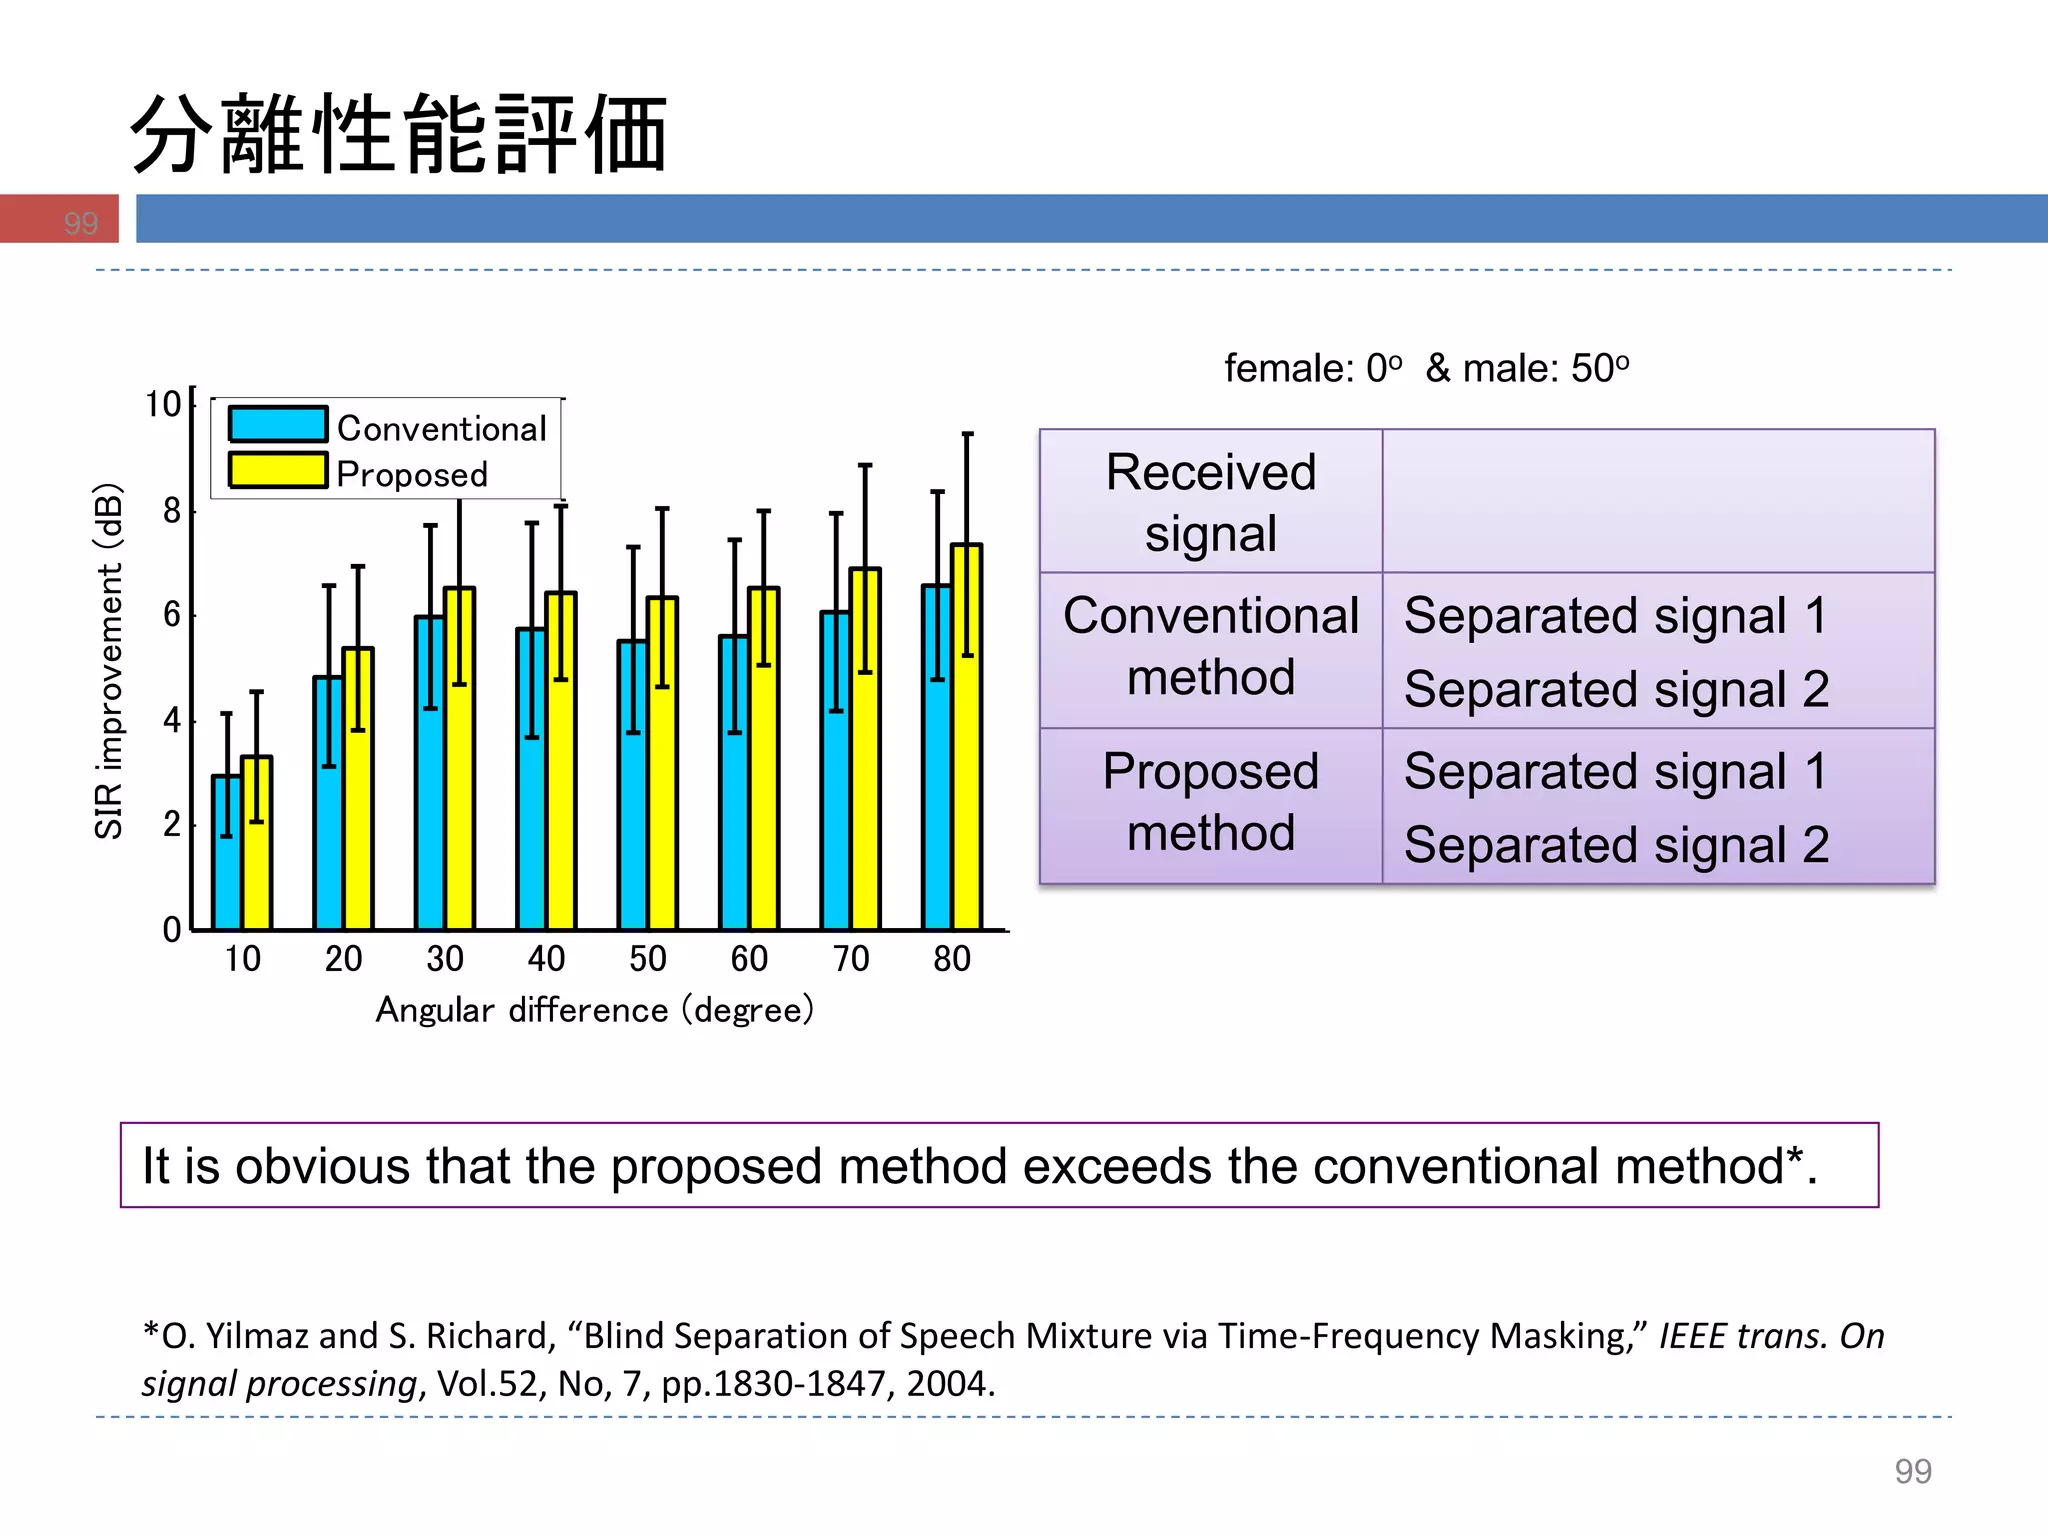
99.
99
分離性能評価
10 20 3040 50 60 70 80
0
2
4
6
8
10
Angular difference (degree)
SIRimprovement(dB)
Conventional
Proposed
*O. Yilmaz and S. Richard, “Blind Separation of Speech Mixture via Time-Frequency Masking,” IEEE trans. On
signal processing, Vol.52, No, 7, pp.1830-1847, 2004.
It is obvious that the proposed method exceeds the conventional method*.
Received
signal
Conventional
method
Separated signal 1
Separated signal 2
Proposed
method
Separated signal 1
Separated signal 2
female: 0o & male: 50o
99
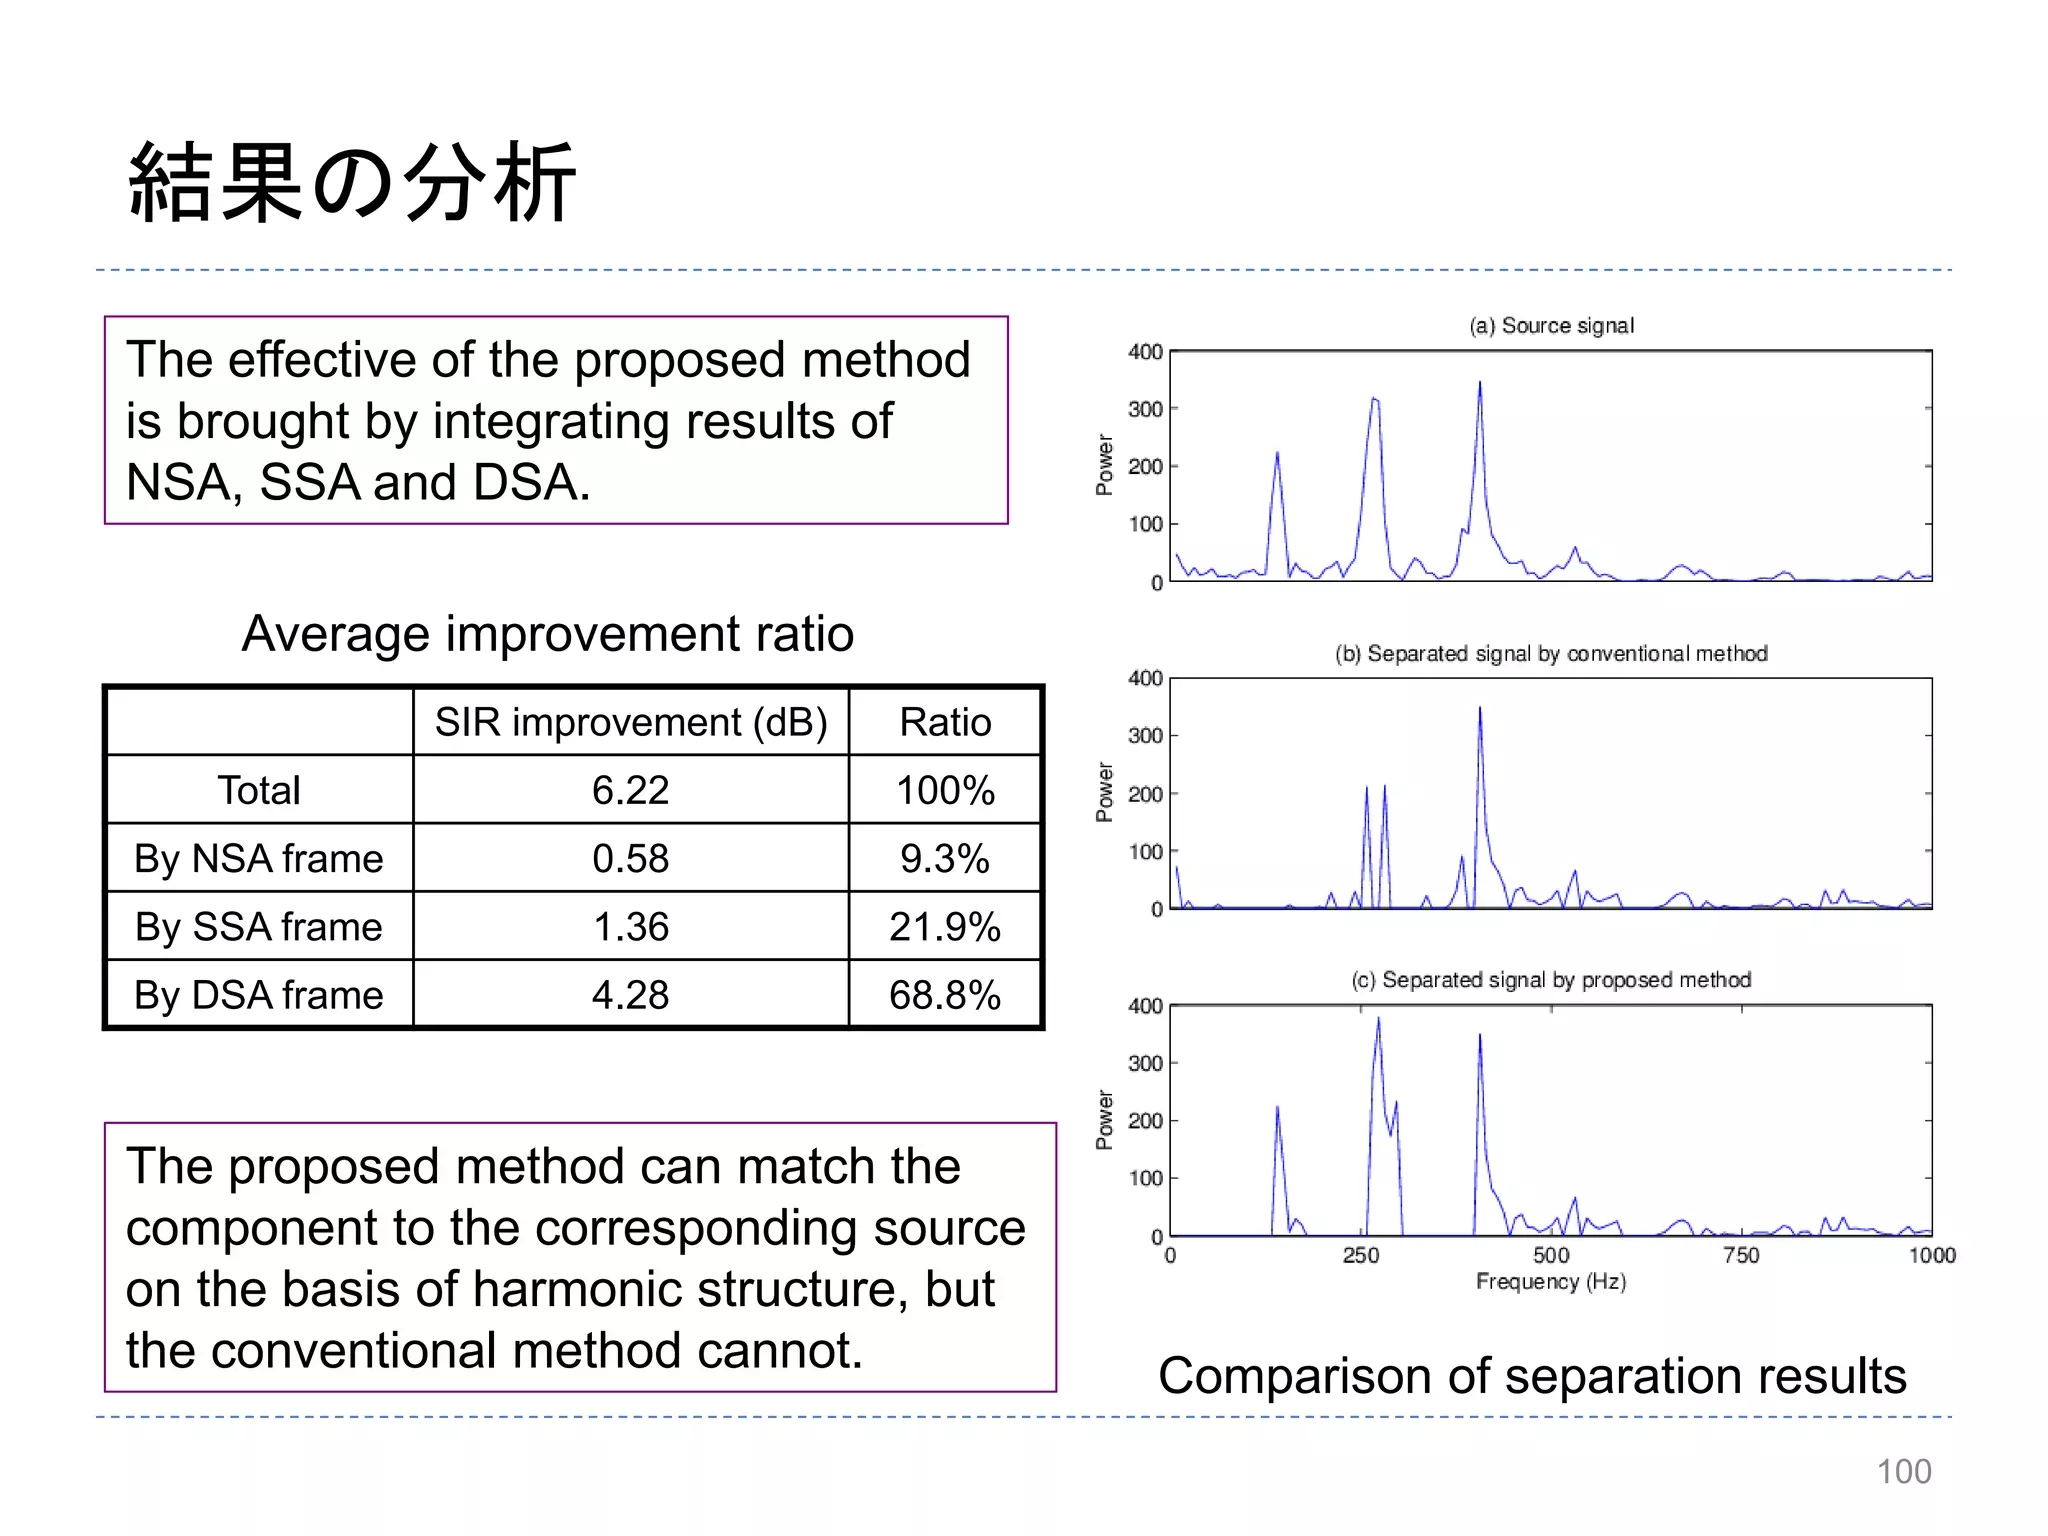
100.
結果の分析
Comparison of separationresults
The effective of the proposed method
is brought by integrating results of
NSA, SSA and DSA.
SIR improvement (dB) Ratio
Total 6.22 100%
By NSA frame 0.58 9.3%
By SSA frame 1.36 21.9%
By DSA frame 4.28 68.8%
The proposed method can match the
component to the corresponding source
on the basis of harmonic structure, but
the conventional method cannot.
Average improvement ratio
100
![15
cos
sinsin
cossin
),(
z
y
x
a
a
a
a
音声信号伝搬ベクトル
マイク位置ベクトル
15
Direction-Of-Arrival:DOA
𝑧
𝑥
𝑦
𝜃
𝜙
𝒂
𝒓 𝒎
source
m-th mic
reference mic
マイク位置行列 𝑹 =
𝒓 𝟐 − 𝒓 𝟏
⋮
𝒓 𝒎 − 𝒓 𝟏
=
𝒓 𝒙
𝒓 𝒚
𝒓 𝒛
𝒓 𝟏 = [0 0 0] 𝑇
: 𝑟𝑒𝑓𝑒𝑟𝑒𝑛𝑐𝑒 𝑚𝑖𝑐](https://image.slidesharecdn.com/random-130616204902-phpapp02/75/slide-15-2048.jpg)
![音源混合モデル
20
( ) ( ) ( )mi mi i
j
x h j s j
たたみ込み混合
: インパルス応答
音源 i からマイク m へ
( )mih j
0.02 0.04 0.06 0.08 0.1 0.12 0.14 0.16
0
5
10
x 10
-3
time (s)
TFcoeffs
Direct wave
Reflected waves
Example of a room impulse response
lj
mm ekSwinxlkX 2
)()(],[
時間-周波数領域表現
周波数域における瞬時混合モデル
N
i
imi
N
i
mim lkSlHlkXlkX
11
],[][],[],[
)(1 s
)(2 s
)(1 x
)(2 x
22h
12h
21h
11h
)(mih
20](https://image.slidesharecdn.com/random-130616204902-phpapp02/75/slide-20-2048.jpg)
![ICA アプローチ(周波数域ICA)
21
音源信号間の統計的独立性を仮定
],[1 lkX Degree of
independence
],[2 lkX
lWlW
lWlW
2221
1211
Separation filter at
frequency bin l
21](https://image.slidesharecdn.com/random-130616204902-phpapp02/75/slide-21-2048.jpg)
![W-Disjoint orthogonality (WDO性)
25
Even the received signals are mixture signals, each cell in time-frequency
domain is at most dominant by one source.
スペクトログラムの積はほぼゼロとなる.
Time
index
Frequency index
],[1 lkS ],[2 lkS
0],[],[ 21 lkSlkS
25](https://image.slidesharecdn.com/random-130616204902-phpapp02/75/slide-25-2048.jpg)
![T-FセルにおけるDOAと時間差・位相差
26
𝑧
𝑥
𝑦
𝜃
𝜙
𝒂
𝒓 𝒎
source
m-th mic
reference mic
STFT
観測位相差ベクトル 𝝋(𝑘, 𝑙) = [𝜑12 𝜑13 𝜑14]
周波数𝑙
時間𝑘
𝜑12 𝑘, 𝑙 = ∠
𝑋1(𝑘, 𝑙)
𝑋2(𝑘, 𝑙)
𝜑13 = ∠
𝑋1(𝑘, 𝑙)
𝑋3(𝑘, 𝑙)
𝜑14 = ∠
𝑋1(𝑘, 𝑙)
𝑋4(𝑘, 𝑙)
𝑋2(𝑘, 𝑙)𝑋1(𝑘, 𝑙) 𝑋3(𝑘, 𝑙) 𝑋4(𝑘, 𝑙)
mic1
mic2
mic3
mic4
遅延時間ベクトル 𝜹 = −
𝑹𝒂
𝑐
観測遅延時間ベクトル 𝜹(𝑘, 𝑙) =
1
∆𝜔𝑙
𝝋(𝑘, 𝑙)
∆𝜔 =
2𝜋𝑓𝑠
𝐿
𝑓𝑠: サンプリング周波数[Hz]
𝑙: 周波数ビン
𝐿: STFT窓長 𝑐: 音速[m s]
マイク位置行列 𝑹 =
𝒓 𝟐 − 𝒓 𝟏
⋮
𝒓 𝒎 − 𝒓 𝟏
=
𝒓 𝒙
𝒓 𝒚
𝒓 𝒛
𝒓 𝟏 = [0 0 0] 𝑇
: 𝑟𝑒𝑓𝑒𝑟𝑒𝑛𝑐𝑒 𝑚𝑖𝑐
音声信号伝搬ベクトル
𝒂 𝜙, 𝜃 =
𝑎 𝑥
𝑎 𝑦
𝑎 𝑧
=
sin𝜃cos𝜙
sin𝜃sin𝜙
cos𝜃
𝒂を求める](https://image.slidesharecdn.com/random-130616204902-phpapp02/75/slide-26-2048.jpg)
![時間-周波数マスキング法+DOA推定
DUET (Degenerate Unmixing
Estimation Technique) [2004]
MENUET (Multiple sENsor
dUET) [2007]
],[
],[
arg
2
1
,
],[
],[
],[
],[
1
2
2
1
1
2
lkX
lkX
llkX
lkX
lkX
lkX
Features
ClusteringHistogram k-means
],[
],[
arg
2
1
,
],[
],[
,
],[
],[
1
2
1
21
lkX
lkX
dlclkA
lkX
lkA
lkX
30
M
im
m lkXlkA
2
],[],[
c: sound velocity
d: microphone distance
-5 0 5
-6
-4
-2
0
2
4
6
Cluster 1
Cluster 2
Centroids](https://image.slidesharecdn.com/random-130616204902-phpapp02/75/slide-30-2048.jpg)
![0 2 4 6 40 60 80 100
0
0.2
0.4
0.6
0.8
1
1.2
Amplitude |Xm
[k,l]|
PDestimationerror(rad.)
Average
Individual speaker
1) 信頼度とT-Fセル選択
信頼のおける位相差を与える時間-周波数セルの選択
Strategy 1: パワーによる方法
Strategy 2: 時間-周波数領域との一致性による方法
34
34](https://image.slidesharecdn.com/random-130616204902-phpapp02/75/slide-34-2048.jpg)
![3535
Strategy 2: T-F ブロックにおける一致性
Time frame
Frequencybin
2
],[
]),[],[(1],[
qp
lkqplk
])},[],,[min(exp{],[ lklklk ft
Standard deviation
信頼度 指数
region for consistency check
Yylyklkt |,:],[
Zzzlklkf |,:],[](https://image.slidesharecdn.com/random-130616204902-phpapp02/75/slide-35-2048.jpg)
![3737
2)カーネル密度推定(KDE)によるアプローチ
cdT /
Lfs /2
00 sinTB
),0(~][ 2
Nl
independent to l
lB0
)(sin)( 1
lT
Random variable
][l
n])[( 0 llB
Phase Difference (ideal)
Phase Difference Error
Direction angle
0 100 200 300 400 500
-0.8
-0.6
-0.4
-0.2
0
0.2
0.4
0.6
0.8
Frequency bin l
PDestimationerror(rad.)
Average
Standard deviation
Individual direction
Experimental verification of phase
difference error which is
independent to frequency bin.
37](https://image.slidesharecdn.com/random-130616204902-phpapp02/75/slide-37-2048.jpg)
![誤差伝搬モデル
If the random variable is given by and is
sufficient small, the probability function of is given by
),0(~][ 2
Nl
])[,(~ 2][
lN nn
l
n
nlT
ln
cos
1
][
][l
][l
n
1. DOA 推定誤差分布の定式化
2. 誤差分布の違いをカーネル密度推定に利用する
PD distribution
DOA estimation distribution
38
0 100 200 300 400 500
-0.5
0
0.5
1
1.5
2
2.5
3
Frequency Bin
PhaseDifference(rad.)
Source 1
Source 2](https://image.slidesharecdn.com/random-130616204902-phpapp02/75/slide-38-2048.jpg)
![KDEにおけるバンド幅
0 200 400 600 800 1000 1200
0
0.2
0.4
0.6
0.8
1
1.2
1.4
誤差大
→バンド幅大
(低信頼度)
誤差小
→バンド幅小
(高信頼度)
I
l
l
i
i
lli
lli
)(
,)(
)
2
)(
exp(
2
1
2
xx
xK
ガウスカーネル
カーネル数
M
i i
l
i
i l
K
lM
p
i
1
][
)
][
(
][
11
)(
40](https://image.slidesharecdn.com/random-130616204902-phpapp02/75/slide-40-2048.jpg)

![42
DOA 推定 –KDE法–
42
M
i i
l
i
i l
K
lM
p
i
1
][
)
][
(
][
11
)(
in lTlT
l
cos
1
cos
1
][
Probability density function
Kernel density function
Estimated angle by each cell
Bandwidth of kernel
Bandwidth control parameter
)(
p
K
][ il
i
][ il
The DOA estimation error is related with source direction and frequency .
5.0 2 5
42
i l
42](https://image.slidesharecdn.com/random-130616204902-phpapp02/75/slide-42-2048.jpg)
![48
Diffuse noise に対するロバスト性
0 100 200 300 400 500 600
0
0.2
0.4
0.6
0.8
1
Frequency bin
Amplitude
Theoretical line sinc(Tl)
generated cross-correlation
white Gaussian noise
],[
],[
],[
2
1
lkN
lkN
lkN
1)(sin
)(sin1
][
2
Tlc
Tlc
NNEV H
Correlation matrix
],[],[],[ lkNlkXlkX
In the diffuse noise, there is equal probability of energy flow in all directions.
The noise appears to have no single source and correlated between sensors.
Tl
Tl
Tlc
)sin(
)(sin
cdT /
Lfs /2
)(12 lV
)(11 lV](https://image.slidesharecdn.com/random-130616204902-phpapp02/75/slide-48-2048.jpg)
![(再)T-Fセルにおける到来方向推定
51
𝑧
𝑥
𝑦
𝜃
𝜙
𝒂
𝒓 𝒎
source
m-th mic
reference mic
STFT
観測位相差ベクトル 𝝋(𝑘, 𝑙) = [𝜑12 𝜑13 𝜑14]
周波数𝑙
時間𝑘
𝜑12 𝑘, 𝑙 = ∠
𝑋1(𝑘, 𝑙)
𝑋2(𝑘, 𝑙)
𝜑13 = ∠
𝑋1(𝑘, 𝑙)
𝑋3(𝑘, 𝑙)
𝜑14 = ∠
𝑋1(𝑘, 𝑙)
𝑋4(𝑘, 𝑙)
𝑋2(𝑘, 𝑙)𝑋1(𝑘, 𝑙) 𝑋3(𝑘, 𝑙) 𝑋4(𝑘, 𝑙)
mic1
mic2
mic3
mic4
遅延時間ベクトル 𝜹 = −
𝑹𝒂
𝑐
観測遅延時間ベクトル 𝜹(𝑘, 𝑙) =
1
∆𝜔𝑙
𝝋(𝑘, 𝑙)
∆𝜔 =
2𝜋𝑓𝑠
𝐿
𝑓𝑠: サンプリング周波数[Hz]
𝑙: 周波数ビン
𝐿: STFT窓長 𝑐: 音速[m s]
マイク位置行列 𝑹 =
𝒓 𝟐 − 𝒓 𝟏
⋮
𝒓 𝒎 − 𝒓 𝟏
=
𝒓 𝒙
𝒓 𝒚
𝒓 𝒛
𝒓 𝟏 = [0 0 0] 𝑇
: 𝑟𝑒𝑓𝑒𝑟𝑒𝑛𝑐𝑒 𝑚𝑖𝑐
音声信号伝搬ベクトル
𝒂 𝜙, 𝜃 =
𝑎 𝑥
𝑎 𝑦
𝑎 𝑧
=
sin𝜃cos𝜙
sin𝜃sin𝜙
cos𝜃
𝒂を一般化逆行列より求める](https://image.slidesharecdn.com/random-130616204902-phpapp02/75/slide-51-2048.jpg)
![56
2) 伝搬ベクトル分布の推定
-1.5
-1
-0.5
0
0.5
1
1.5
-1.5
-1
-0.5
0
0.5
transformed c12
transformed c13
PD誤差分布はガウス分布に従うと仮定
nn ,,
,,
),()(
),(),(
x
dx
dl
nn
x
ξ
)(
ˆ
,
)(
ˆ
)()(
11
),(ˆ
][][
1 i
l
i
i
l
i
I
i ii ll
K
llI
p
ii
平均:
偏差:
カーネル密度推定法によるDOA推定
PD誤差モデル
推定密度関数
0 200 400 600 800 1000 1200
0
0.2
0.4
0.6
0.8
1
1.2
1.4
誤差大
→バンド幅大
(低信頼度)
誤差小
→バンド幅小
(高信頼度)
I
l
l
i
i
lli
lli
)(
,)(
)
2
)(
exp(
2
1
2
xx
xK
ガウスカーネル ガウスカーネルで
ヒストグラム化
0
10
20
30
40
50
0
50
100
0
0.2
0.4
0.6
0.8
1
[deg] [deg]
estimatedp(,)
0.1
L
lf
l s 2
)(
カーネル数
56](https://image.slidesharecdn.com/random-130616204902-phpapp02/75/slide-56-2048.jpg)
![58
検証(正四面体アレー)
真値 30,45 60,60 90,150 120,120 240,135
method1 114,118 116,123 119,123 123,121 125,125
method2 47,61 109,129 137,72 232,131 307,79
propose
d
33,44 61,58 93,151 121,122 241,135
正四面体マイクロホンアレーにおけるDOA推定誤差[度]検証
従来法使用領域 提案法使用領域
method1:ヒストグラム method2: k-means法](https://image.slidesharecdn.com/random-130616204902-phpapp02/75/slide-58-2048.jpg)
![-50 0 50
0
0.2
0.4
0.6
0.8
1
DOA [deg]
histogram
(a) DOA histogram (original)
-50 0 50
0
0.2
0.4
0.6
0.8
1
DOA [deg]
histogram
(b) DOA histogram (after selection)
-50 0 50
0
0.2
0.4
0.6
0.8
1
DOA [deg]
estimatedp()
(c) estimated density function
1. セルセレクションによる影響
・STFT計算や反響の影響等で大きな
誤差をもち正確な位相差を示さない
セルを除外
2. カーネル密度推定による影響
・ガウスカーネルによる平滑化
・所望ピークが顕著に出現
59
効果](https://image.slidesharecdn.com/random-130616204902-phpapp02/75/slide-59-2048.jpg)
![エリアシングを許容するDOA推定(音源分離)
拡張Hough変換(ヒストグラム)による手法[27]
B. Loesch and B. Yang, “ Blind Source Separation based on Time-Frequency Sparseness in the Presence of Spatial
Aliasing ”LATENTVARIABLE ANALYSIS AND SIGNAL SEPARATION, Lecture Notesin Computer Science, 2010, Volume
6365/2010
逐次的位相差補正処理による手法[28]
いずれか一組のセンサが非エリアシング条件を満たすことを利用
Loeschらによる手法[23]2010 *
State vectorを用いた評価関数による任意マイク配置におけるDOA推定と分離
Sawadaらによる手法[21]2007
低域から順次解決するDOA推定と分離手法](https://image.slidesharecdn.com/random-130616204902-phpapp02/75/slide-62-2048.jpg)


![シミュレーション結果
70
4音源
5音源
音源数 方位角 仰角
3音源 93.1 100
4音源 80.9 96.2
5音源 78.1 97.8
平均誤差[deg]
音源数 方位角 仰角
3音源 2.6 0.8
4音源 6.6 1.3
5音源 7.3 1.4
実線:真の軌跡
プロット:推定値
20
-20
360
0
20
-20
360
0
FER[%]](https://image.slidesharecdn.com/random-130616204902-phpapp02/75/slide-70-2048.jpg)
![実環境実験
71
サンプリング周波数 8000 Hz
STFT点数 1024
STFTの窓関数 Hamming
時間フレーム送り量 512
マイク配置 正四面体
マイク間距離 4 cm
部屋の寸法 17×15×3.5 m3
マイクと音源の距離 1 m
結果
マイクロホンアレー
方位角[deg]
仰角[deg]](https://image.slidesharecdn.com/random-130616204902-phpapp02/75/slide-71-2048.jpg)
![実験結果
FER =
5°以内に誤差が収まったフレーム数
推定が行われた時間フレーム数
× 100
2音源 3音源
一定距離 95% 90%
接近 92% 60%
各動きパターンにおけるFER(±5°)
各動きパターンにおける誤差平均[度]
2音源 3音源
一定距離 1.36 2.47
接近 3.94 4.19
77
77](https://image.slidesharecdn.com/random-130616204902-phpapp02/75/slide-77-2048.jpg)
![0 100 200 300 400 500
-0.5
0
0.5
1
1.5
2
2.5
3
Frequency Bin
PhaseDifference(rad.)
Source 1
Source 2
0 100 200 300 400 500
-0.5
0
0.5
1
1.5
2
2.5
3
Frequency Bin
PhaseDifference(rad.)
Source 1
Source 2
基本方針
],[
],[
arg],[,
1
2
lkX
lkX
lkl
Frame-by-frame approach
分離問題 DOA推定問題
0 100 200 300 400 500
-0.5
0
0.5
1
1.5
2
2.5
3
Frequency Bin
PhaseDifference(rad.)
Source 1
Source 2
0 100 200 300 400 500
-0.5
0
0.5
1
1.5
2
2.5
3
Frequency Bin
PhaseDifference(rad.)
Source 1
Source 2
...
0 100 200 300 400 500
-0.5
0
0.5
1
1.5
2
2.5
3
Frequency Bin
PhaseDifference(rad.)
Source 1
Source 2
PD error
distribution
DOA error
distribution
位相差 vs. 周波数 (PD-F) 分布
88
88](https://image.slidesharecdn.com/random-130616204902-phpapp02/75/slide-88-2048.jpg)
![Non source active (NSA)
91
The noise level is assumed to be sufficiently low with respect to the level of
the sources.
NSA criterion:
NSAframethkthenThkEif ,1)(
The average local power of frame k is defined as
2/
0
2
1 ],[
12/
1
:)(
L
l
lkX
L
kE
EETh 201
:0E
:E
Average noise value
Standard deviation
0 100 200 300 400 500
-0.5
0
0.5
1
1.5
2
2.5
3
Frequency Bin
PhaseDifference(rad.)
Source 1
Source 2
91](https://image.slidesharecdn.com/random-130616204902-phpapp02/75/slide-91-2048.jpg)
![0 100 200 300 400 500
-0.5
0
0.5
1
1.5
2
2.5
3
Frequency Bin
PhaseDifference(rad.)
Source 1
Source 2
95
DSA フレームにおける音源分離
otherwise
Blllkiif
lkM
highc
c
i
0
,],[minarg1
],[
~ )2,1(
],[
~
],[],[
~
1 lkMlkXlkS ii
Local maximum frequencies of
),(),( 21 kbkb ii
Number of local maxima )(kqi
2
],[
~
max
],[
~
Th
vkS
lkS
i
v
i
2.02 Th
1080/ sfLl
初期推定 highB
極大値探索
midB
2
~s
1
~s
0 100 200 300 400 500 600 700 800 900
0
50
100
150
200
250
300
350
Frequency (Hz)
Power
],[
~
lkSi](https://image.slidesharecdn.com/random-130616204902-phpapp02/75/slide-95-2048.jpg)
![96
DSAフレームにおける音源分離
マスク生成と分離
調波構造の推定 lowB
2)(),()()( 12 kqkbkbkd iiii
nkdkbkg iiin )()()( 1
2)(,0
),()(
vkqvsmallest
vkgkg
i
inin
otherwise
nBlkq
andkglkgif
lkM lowi
inin
i
0
,3,2,1,,2)(
,2)()2(1
],[
~
],[],[],[ˆ
1 lkMlkXlkS ii
],[],[
~
],[ lkMlkMlkM iii
2)( kqif i 0 100 200 300 400 500 600 700 800 900
0
50
100
150
200
250
300
350
Frequency (Hz)
Power
If there are more than two peaks
If there is single or no peak, using
the nearest frame](https://image.slidesharecdn.com/random-130616204902-phpapp02/75/slide-96-2048.jpg)


![[DL輪読会]Monaural Audio Source Separationusing Variational Autoencoders](https://cdn.slidesharecdn.com/ss_thumbnails/20190717dlmonauralaudiosourceseparationusingvariationalautoencodersver2-190719035345-thumbnail.jpg?width=640&height=640&fit=bounds)


![音声分析合成[3].pptx](https://cdn.slidesharecdn.com/ss_thumbnails/random-220616064407-3408f742-thumbnail.jpg?width=640&height=640&fit=bounds)


