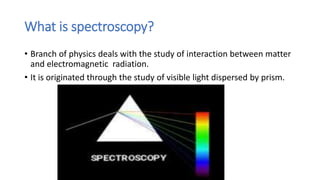
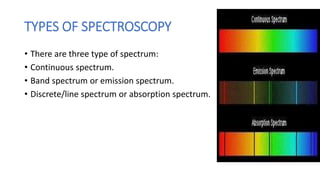
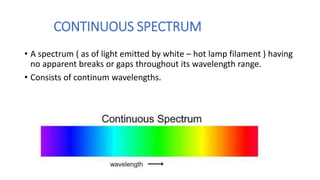
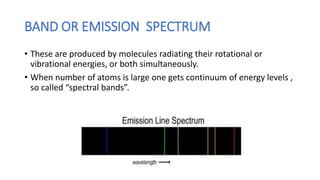
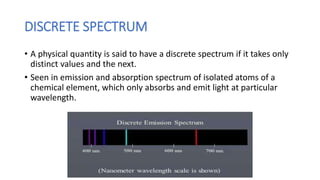
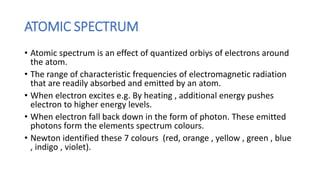
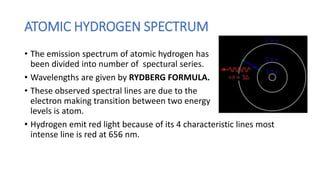
SPECTROSCOPY & ATOMIC
SPECTRUM
BY : SAIRA KANWAL AWAN
What is spectroscopy?
• Branch of physics deals with the study of interaction between matter
and electromagnetic radiation.
• It is originated through the study of visible light dispersed by prism.
HISTORY
• In 1814 JOSEPH FRAUENHOFER an optician in MUNICH ,
discovered many dark lines crossing the spectrum of sun.
• In 1814 Fraunhofer invented the spectrum.
• It used to measure the properties of light.
• It works by breaking light into different wavelengths.These are made
of prisms as light passes through glass , different wavelengths slow
down by different amounts and are burnt into their colours.
SPECTRUM & SPECTROMETER
• Spectrometer: An instrument used to measure the wavelengths of
light.
• Spectrum: A plot of the colour profile (wavelengths present).
TYPES OF SPECTROSCOPY
• There are three type of spectrum:
• Continuous spectrum.
• Band spectrum or emission spectrum.
• Discrete/line spectrum or absorption spectrum.
CONTINUOUS SPECTRUM
• A spectrum ( as of light emitted by white – hot lamp filament ) having
no apparent breaks or gaps throughout its wavelength range.
• Consists of continum wavelengths.
BAND OR EMISSION SPECTRUM
• These are produced by molecules radiating their rotational or
vibrational energies, or both simultaneously.
• When number of atoms is large one gets continuum of energy levels ,
so called “spectral bands”.
DISCRETE SPECTRUM
• A physical quantity is said to have a discrete spectrum if it takes only
distinct values and the next.
• Seen in emission and absorption spectrum of isolated atoms of a
chemical element, which only absorbs and emit light at particular
wavelength.
ATOMIC SPECTRUM
• Atomic spectrum is an effect of quantized orbiys of electrons around
the atom.
• The range of characteristic frequencies of electromagnetic radiation
that are readily absorbed and emitted by an atom.
• When electron excites e.g. By heating , additional energy pushes
electron to higher energy levels.
• When electron fall back down in the form of photon. These emitted
photons form the elements spectrum colours.
• Newton identified these 7 colours (red, orange , yellow , green , blue
, indigo , violet).
ATOMIC HYDROGEN SPECTRUM
• The emission spectrum of atomic hydrogen has
been divided into number of spectural series.
• Wavelengths are given by RYDBERG FORMULA.
• These observed spectral lines are due to the
electron making transition between two energy
levels is atom.
• Hydrogen emit red light because of its 4 characteristic lines most
intense line is red at 656 nm.
REGULARITIES IN HYDROGEN SPECTRUM
• Spectral lines lie in three regions Visible region , Ultraviolet region ,
Infrared region.
• Ultraviolet consists of Lyman series.
• Visible region consists of Balmer series.
• Infrared region consists of Pashen series , Bracket series , Pfund
series.
• The spacing of spectral lines decreaaes as we go towards
wavelengths.
• The wavelengths (colours) themselves approach a limit called Series
limit.
LYMAN SERIES
• Spectral lines for Lyman series is transition from n > 2 to n= 1 , which
lies in the UV region.
• Longest wavelength corresponding m = 2 is 121.57 nm.
• Shorter wavelength is m = infinity is 91.18 nm.
• These wavelengths are the reasons for Lyman series to fall on UV
region.
BALMER SERIES
• In 1885 , Balmer developed an empirical formula for wavelengths of
spectral lines of hydrogen spectrum.
PASCHEN SERIES

SPECTROSCOPY AND ATOMIC SPECTRUM

  • 1.
  • 3.
    What is spectroscopy? •Branch of physics deals with the study of interaction between matter and electromagnetic radiation. • It is originated through the study of visible light dispersed by prism.
  • 4.
    HISTORY • In 1814JOSEPH FRAUENHOFER an optician in MUNICH , discovered many dark lines crossing the spectrum of sun. • In 1814 Fraunhofer invented the spectrum. • It used to measure the properties of light. • It works by breaking light into different wavelengths.These are made of prisms as light passes through glass , different wavelengths slow down by different amounts and are burnt into their colours.
  • 5.
    SPECTRUM & SPECTROMETER •Spectrometer: An instrument used to measure the wavelengths of light. • Spectrum: A plot of the colour profile (wavelengths present).
  • 6.
    TYPES OF SPECTROSCOPY •There are three type of spectrum: • Continuous spectrum. • Band spectrum or emission spectrum. • Discrete/line spectrum or absorption spectrum.
  • 7.
    CONTINUOUS SPECTRUM • Aspectrum ( as of light emitted by white – hot lamp filament ) having no apparent breaks or gaps throughout its wavelength range. • Consists of continum wavelengths.
  • 8.
    BAND OR EMISSIONSPECTRUM • These are produced by molecules radiating their rotational or vibrational energies, or both simultaneously. • When number of atoms is large one gets continuum of energy levels , so called “spectral bands”.
  • 9.
    DISCRETE SPECTRUM • Aphysical quantity is said to have a discrete spectrum if it takes only distinct values and the next. • Seen in emission and absorption spectrum of isolated atoms of a chemical element, which only absorbs and emit light at particular wavelength.
  • 10.
    ATOMIC SPECTRUM • Atomicspectrum is an effect of quantized orbiys of electrons around the atom. • The range of characteristic frequencies of electromagnetic radiation that are readily absorbed and emitted by an atom. • When electron excites e.g. By heating , additional energy pushes electron to higher energy levels. • When electron fall back down in the form of photon. These emitted photons form the elements spectrum colours. • Newton identified these 7 colours (red, orange , yellow , green , blue , indigo , violet).
  • 11.
    ATOMIC HYDROGEN SPECTRUM •The emission spectrum of atomic hydrogen has been divided into number of spectural series. • Wavelengths are given by RYDBERG FORMULA. • These observed spectral lines are due to the electron making transition between two energy levels is atom. • Hydrogen emit red light because of its 4 characteristic lines most intense line is red at 656 nm.
  • 12.
    REGULARITIES IN HYDROGENSPECTRUM • Spectral lines lie in three regions Visible region , Ultraviolet region , Infrared region. • Ultraviolet consists of Lyman series. • Visible region consists of Balmer series. • Infrared region consists of Pashen series , Bracket series , Pfund series. • The spacing of spectral lines decreaaes as we go towards wavelengths. • The wavelengths (colours) themselves approach a limit called Series limit.
  • 13.
    LYMAN SERIES • Spectrallines for Lyman series is transition from n > 2 to n= 1 , which lies in the UV region. • Longest wavelength corresponding m = 2 is 121.57 nm. • Shorter wavelength is m = infinity is 91.18 nm. • These wavelengths are the reasons for Lyman series to fall on UV region.
  • 14.
    BALMER SERIES • In1885 , Balmer developed an empirical formula for wavelengths of spectral lines of hydrogen spectrum.
  • 15.