WHAT IS ASPECTRUM?
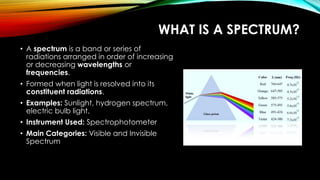
• A spectrum is a band or series of
radiations arranged in order of increasing
or decreasing wavelengths or
frequencies.
• Formed when light is resolved into its
constituent radiations.
• Examples: Sunlight, hydrogen spectrum,
electric bulb light.
• Instrument Used: Spectrophotometer
• Main Categories: Visible and Invisible
Spectrum
3.
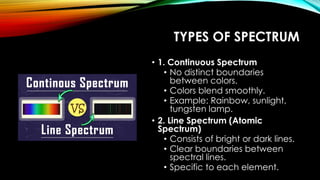
TYPES OF SPECTRUM
•1. Continuous Spectrum
• No distinct boundaries
between colors.
• Colors blend smoothly.
• Example: Rainbow, sunlight,
tungsten lamp.
• 2. Line Spectrum (Atomic
Spectrum)
• Consists of bright or dark lines.
• Clear boundaries between
spectral lines.
• Specific to each element.
4.
CONTINUOUS SPECTRUM
• Definition:No dark/bright
spaces; colours merge.
• Produced By: Sunlight,
electric light (tungsten
lamp).
• Example: Rainbow
5.
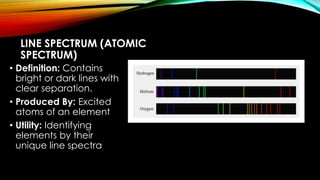
LINE SPECTRUM (ATOMIC
SPECTRUM)
•Definition: Contains
bright or dark lines with
clear separation.
• Produced By: Excited
atoms of an element
• Utility: Identifying
elements by their
unique line spectra
6.
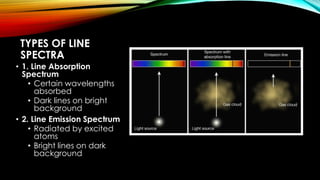
TYPES OF LINE
SPECTRA
•1. Line Absorption
Spectrum
• Certain wavelengths
absorbed
• Dark lines on bright
background
• 2. Line Emission Spectrum
• Radiated by excited
atoms
• Bright lines on dark
background
7.
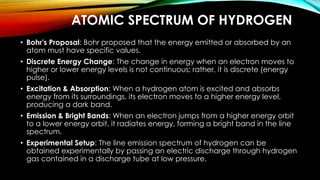
ATOMIC SPECTRUM OFHYDROGEN
• Bohr's Proposal: Bohr proposed that the energy emitted or absorbed by an
atom must have specific values.
• Discrete Energy Change: The change in energy when an electron moves to
higher or lower energy levels is not continuous; rather, it is discrete (energy
pulse).
• Excitation & Absorption: When a hydrogen atom is excited and absorbs
energy from its surroundings, its electron moves to a higher energy level,
producing a dark band.
• Emission & Bright Bands: When an electron jumps from a higher energy orbit
to a lower energy orbit, it radiates energy, forming a bright band in the line
spectrum.
• Experimental Setup: The line emission spectrum of hydrogen can be
obtained experimentally by passing an electric discharge through hydrogen
gas contained in a discharge tube at low pressure.
9.
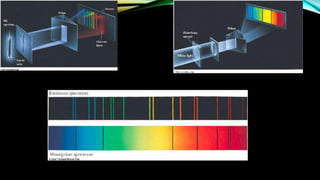
• Spectroscopic Analysis:The emitted light radiations are examined using a
spectroscope.
• Atomic Spectrum: The bright lines recorded on the photographic plate
constitute the atomic spectrum of hydrogen
• Balmer's Observation (1884): J. J. Balmer observed four prominent colored
lines in the visible hydrogen spectrum: red, blue-green, blue-violet, and
violet.
• Balmer Series: This series of four lines in the visible spectrum was named the
Balmer Series.
• Additional Spectral Series: Besides the Balmer Series, four other spectral series
were discovered in the infrared and ultraviolet regions of the hydrogen
spectrum.
• Total Spectral Series: In total, there are five spectral series in the atomic
spectrum of hydrogen, each named after their discoverers.
10.
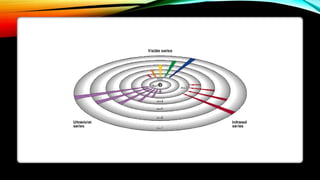
SPECTRAL SERIES OFHYDROGEN
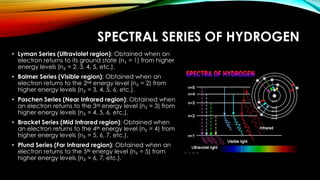
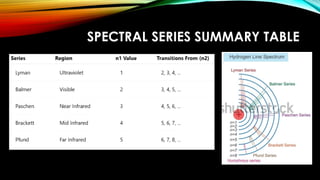
• Lyman Series (Ultraviolet region): Obtained when an
electron returns to its ground state (n₁ = 1) from higher
energy levels (n₂ = 2, 3, 4, 5, etc.).
• Balmer Series (Visible region): Obtained when an
electron returns to the 2ⁿᵈ energy level (n₂ = 2) from
higher energy levels (n₂ = 3, 4, 5, 6, etc.).
• Paschen Series (Near Infrared region): Obtained when
an electron returns to the 3ʳᵈ energy level (n₂ = 3) from
higher energy levels (n₂ = 4, 5, 6, etc.).
• Bracket Series (Mid Infrared region): Obtained when
an electron returns to the 4ᵗʰ energy level (n₂ = 4) from
higher energy levels (n₂ = 5, 6, 7, etc.).
• Pfund Series (Far Infrared region): Obtained when an
electron returns to the 5ᵗʰ energy level (n₂ = 5) from
higher energy levels (n₂ = 6, 7, etc.).
12.
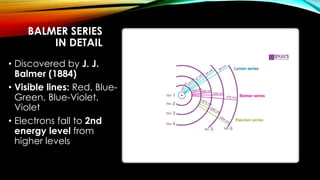
BALMER SERIES
IN DETAIL
•Discovered by J. J.
Balmer (1884)
• Visible lines: Red, Blue-
Green, Blue-Violet,
Violet
• Electrons fall to 2nd
energy level from
higher levels
RECAP AND REAL-WORLD
APPLICATIONS
•Spectra help us:
• Identify elements in stars
• Understand atomic structure
• Develop lasers and lighting
tech
• Spectrum = Fingerprint of atoms
15.
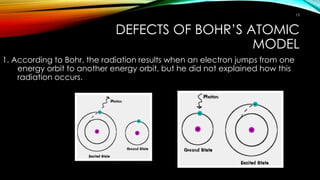
DEFECTS OF BOHR’SATOMIC
MODEL
1. According to Bohr, the radiation results when an electron jumps from one
energy orbit to another energy orbit, but he did not explained how this
radiation occurs.
15
16.
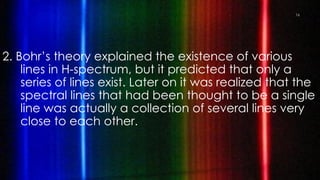
2. Bohr’s theoryexplained the existence of various
lines in H-spectrum, but it predicted that only a
series of lines exist. Later on it was realized that the
spectral lines that had been thought to be a single
line was actually a collection of several lines very
close to each other.
16
17.
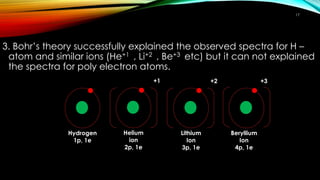
3. Bohr’s theorysuccessfully explained the observed spectra for H –
atom and similar ions (He+1 , Li+2 , Be+3 etc) but it can not explained
the spectra for poly electron atoms.
Hydrogen
1p, 1e
Helium
ion
2p, 1e
+1
Beryllium
Ion
4p, 1e
+3
Lithium
Ion
3p, 1e
+2
17
18.
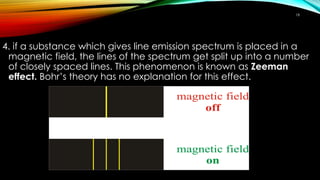
4. if asubstance which gives line emission spectrum is placed in a
magnetic field, the lines of the spectrum get split up into a number
of closely spaced lines. This phenomenon is known as Zeeman
effect. Bohr’s theory has no explanation for this effect.
18
19.
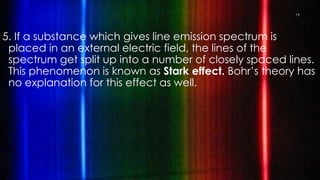
5. If asubstance which gives line emission spectrum is
placed in an external electric field, the lines of the
spectrum get split up into a number of closely spaced lines.
This phenomenon is known as Stark effect. Bohr’s theory has
no explanation for this effect as well.
19
20.
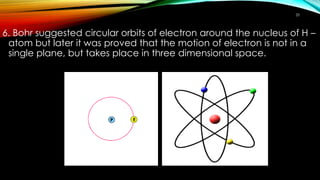
6. Bohr suggestedcircular orbits of electron around the nucleus of H –
atom but later it was proved that the motion of electron is not in a
single plane, but takes place in three dimensional space.
20
21.
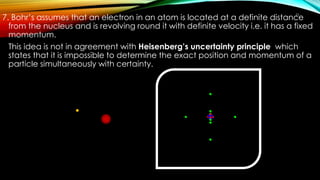
7. Bohr’s assumesthat an electron in an atom is located at a definite distance
from the nucleus and is revolving round it with definite velocity i.e. it has a fixed
momentum.
This idea is not in agreement with Heisenberg’s uncertainty principle which
states that it is impossible to determine the exact position and momentum of a
particle simultaneously with certainty.
21