Downloaded 10 times


![Page14
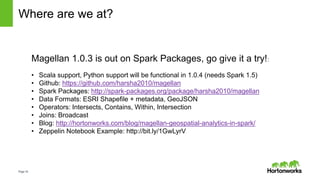
How does it work?
Custom Data Types for Shapes:
• Point, Line, PolyLine, Polygon extend Shape
• Local Computations using ESRI Java API
• No need for Scala -> SQL serialization
Expressions for Operators:
• Literals e.g point(-122.4, 37.6)
• Boolean Expressions e.g Intersects, Contains
• Binary Expressions e.g Intersection
Custom Data Sources:
• Schema = [point, polyline, polygon, metadata]
• Metadata = Map[String, String]
• GeoJSON and Shapefile implementations
Custom Strategies for Spatial Join:
• Broadcast Cartesian Join
• Geohash Join (in progress)
• Plug into Catalyst as experimental strategies](https://image.slidesharecdn.com/sparksummiteurope2015-magellan-151028124443-lva1-app6892/85/Spark-summit-europe-2015-magellan-14-320.jpg)
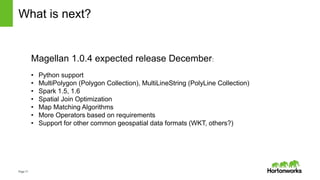


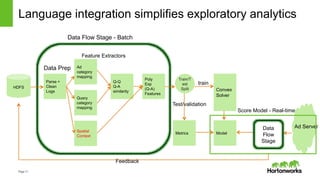
Magellan is a geospatial analytics library for Apache Spark that allows users to perform spatial queries and analysis on large geospatial datasets in a scalable manner. It provides custom data types and expressions to represent spatial objects like points, polygons and perform spatial operations. Magellan reads geospatial file formats like Shapefiles and GeoJSON, integrates with Spark SQL to allow spatial joins, and aims to simplify building geospatial applications at scale on Spark. The current version supports basic functionality and future versions will add more operators, optimizations, and support for additional formats and use cases.


![제 23회 보아즈(BOAZ) 빅데이터 컨퍼런스 - [MBOAX] : ABSA를 활용한 소비자 반응 분석 기반 운영 효율화 대시보드 설계](https://cdn.slidesharecdn.com/ss_thumbnails/3-1boaz23rdconferencemboax-260203102709-9d519923-thumbnail.jpg?width=640&height=640&fit=bounds)


