Download to read offline


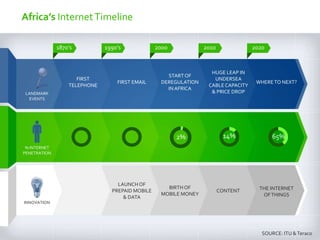

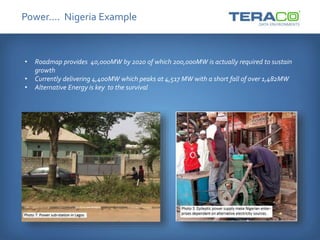
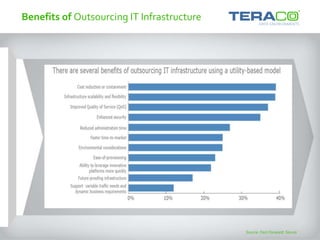
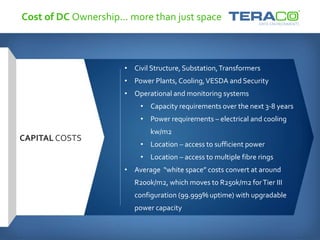
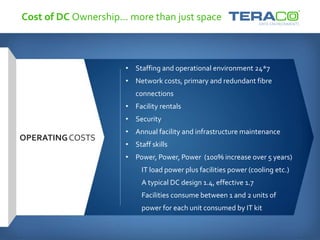


This document summarizes the development of internet infrastructure in Africa over time. It discusses key events like the introduction of deregulation in 2000, the huge increase in undersea cable capacity in 2010, and the growth of mobile money and the internet of things. It also provides country-specific examples about the necessity of deregulation in South Africa and challenges around unreliable power supply in South Africa, Kenya, and Nigeria. The document outlines the high capital and operating costs associated with building and maintaining data center infrastructure and argues that outsourcing to neutral providers can help reduce costs through economies of scale and access to reliable power.


