Download as PDF, PPTX
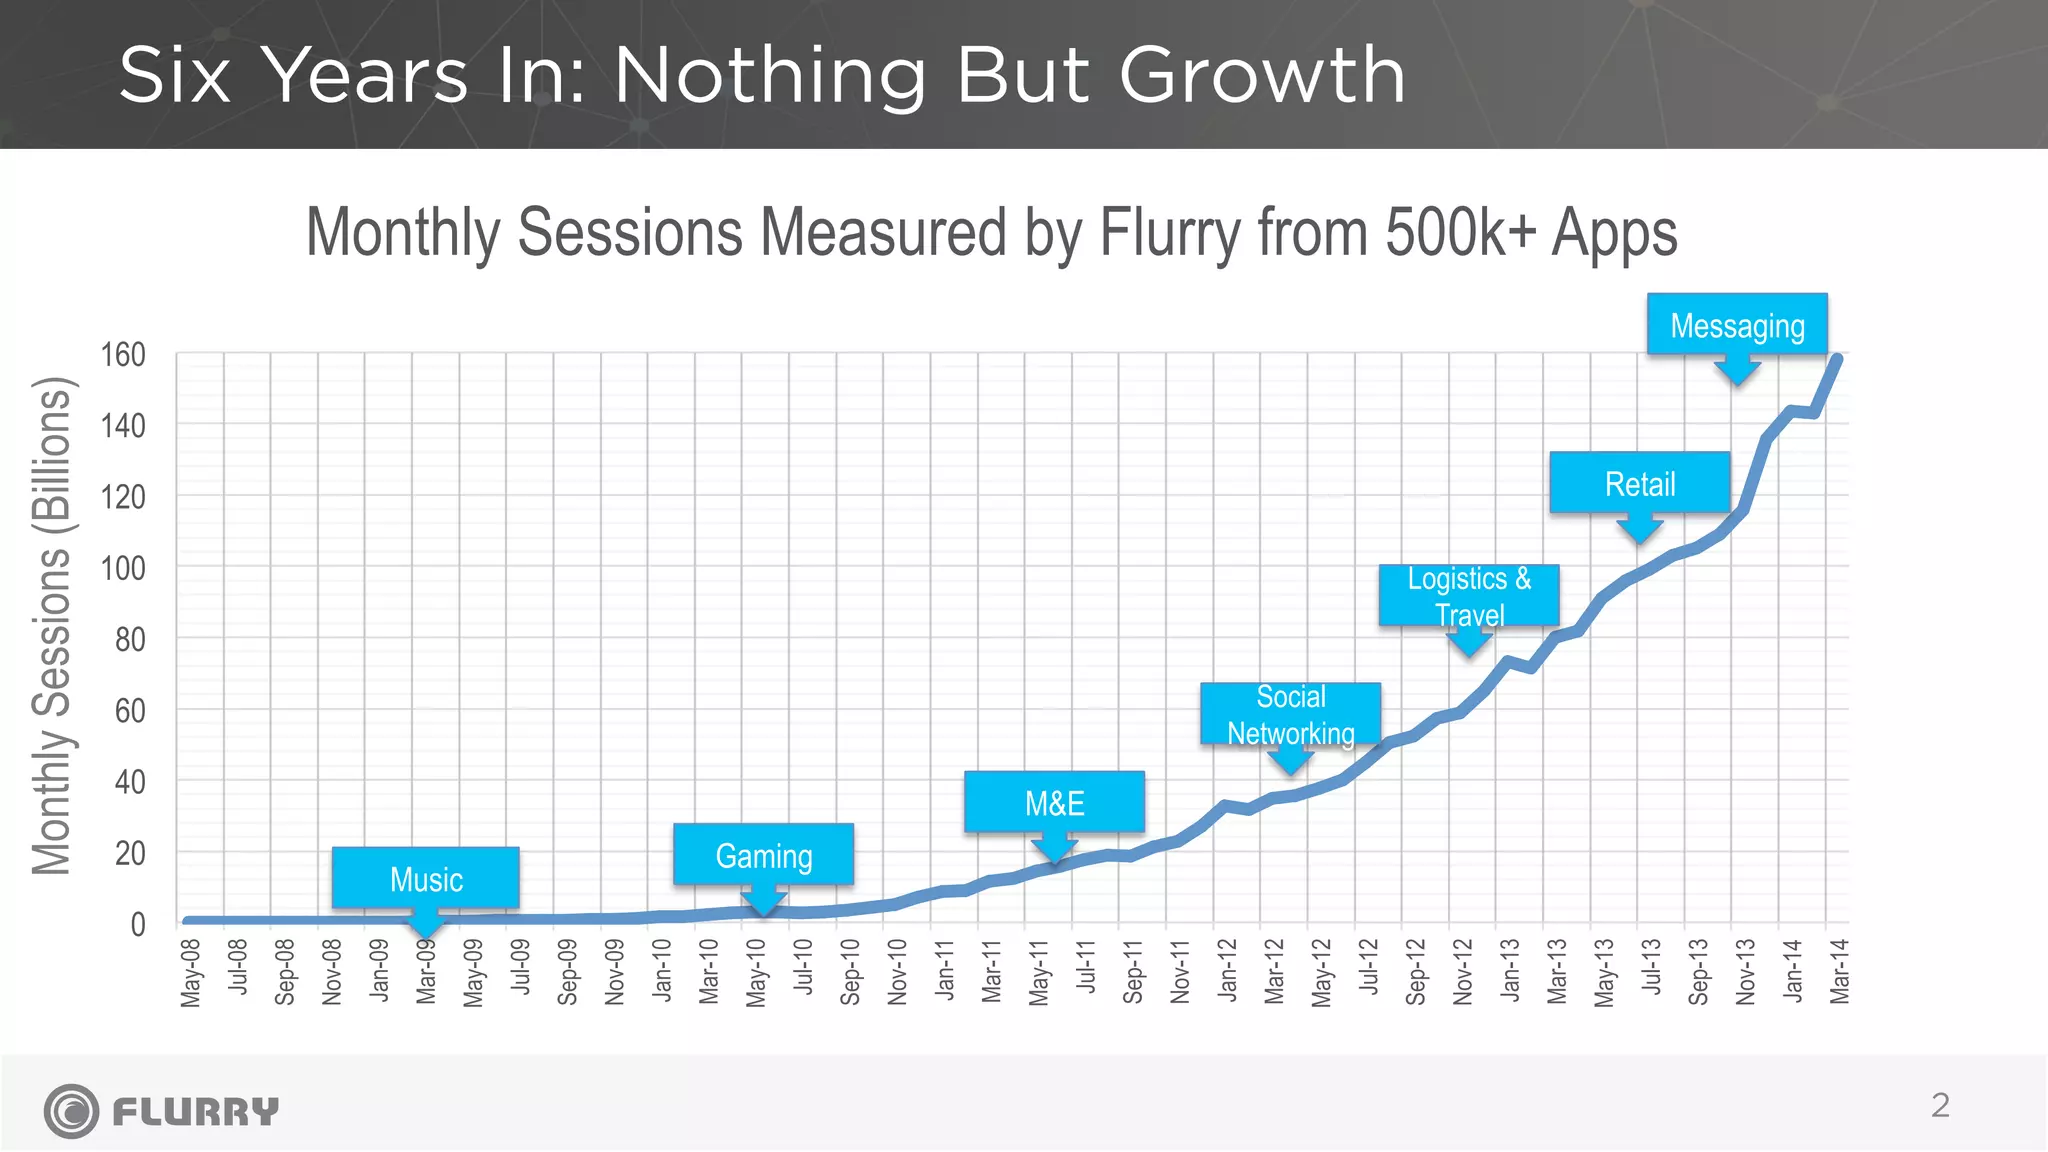
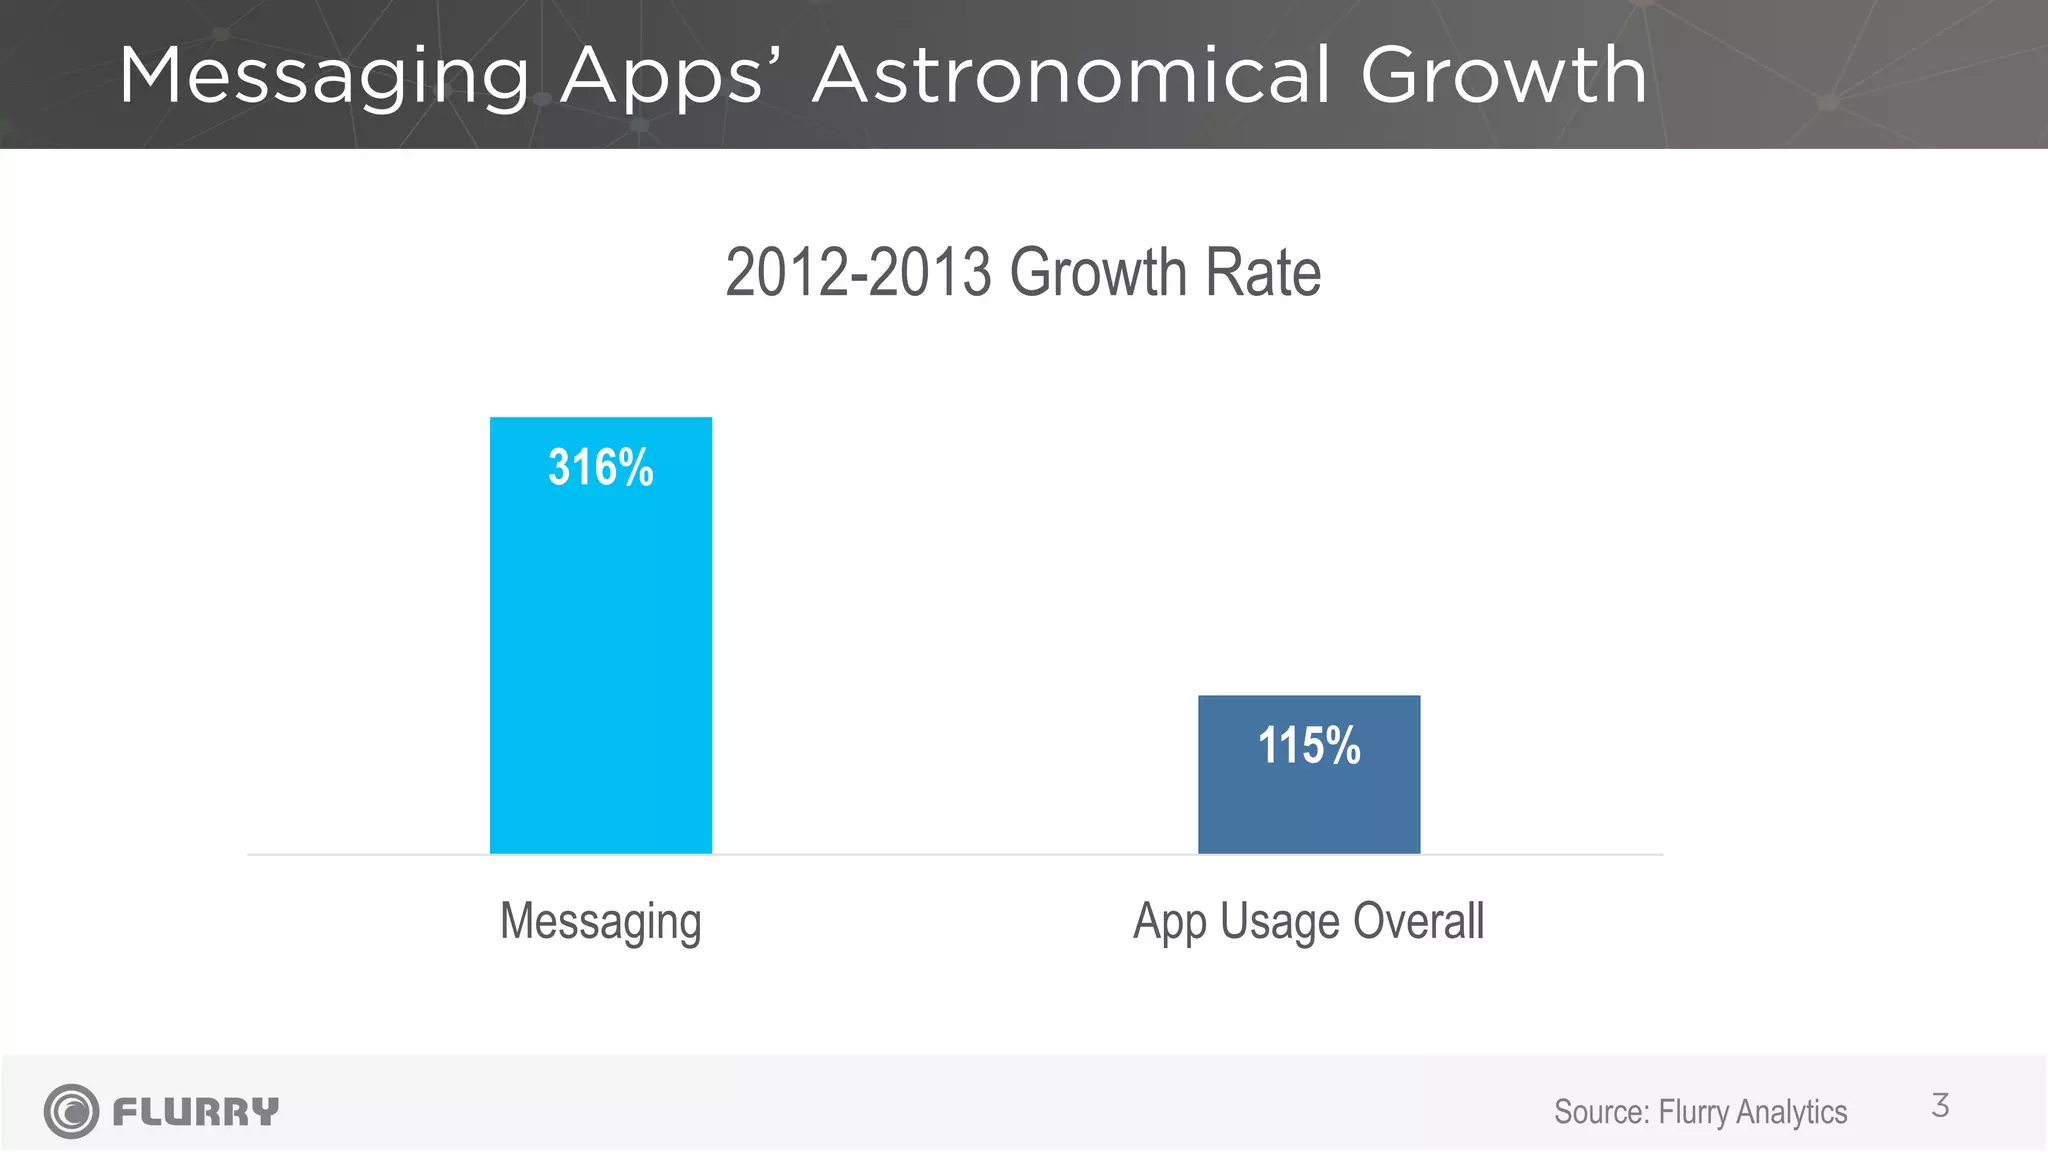
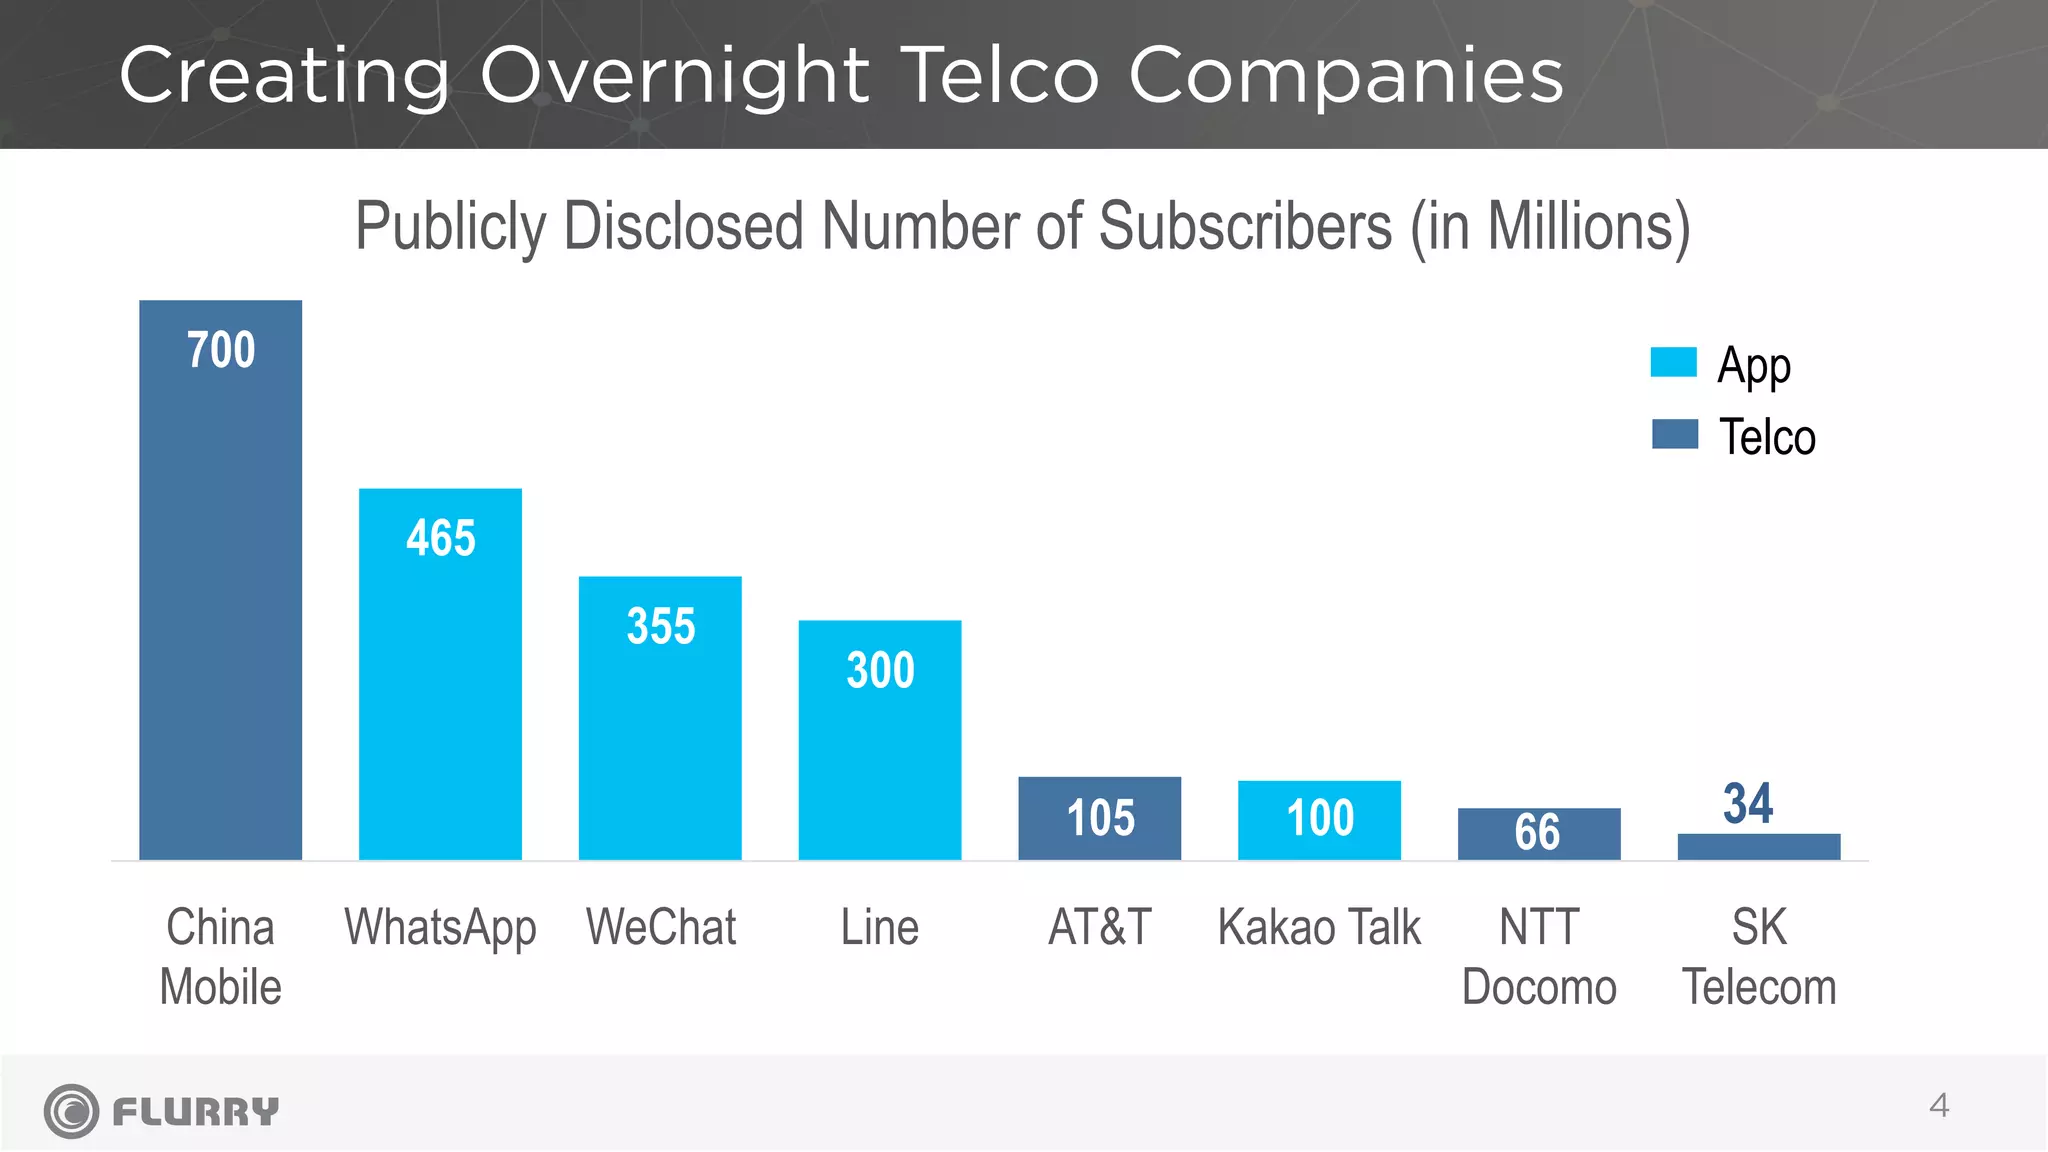
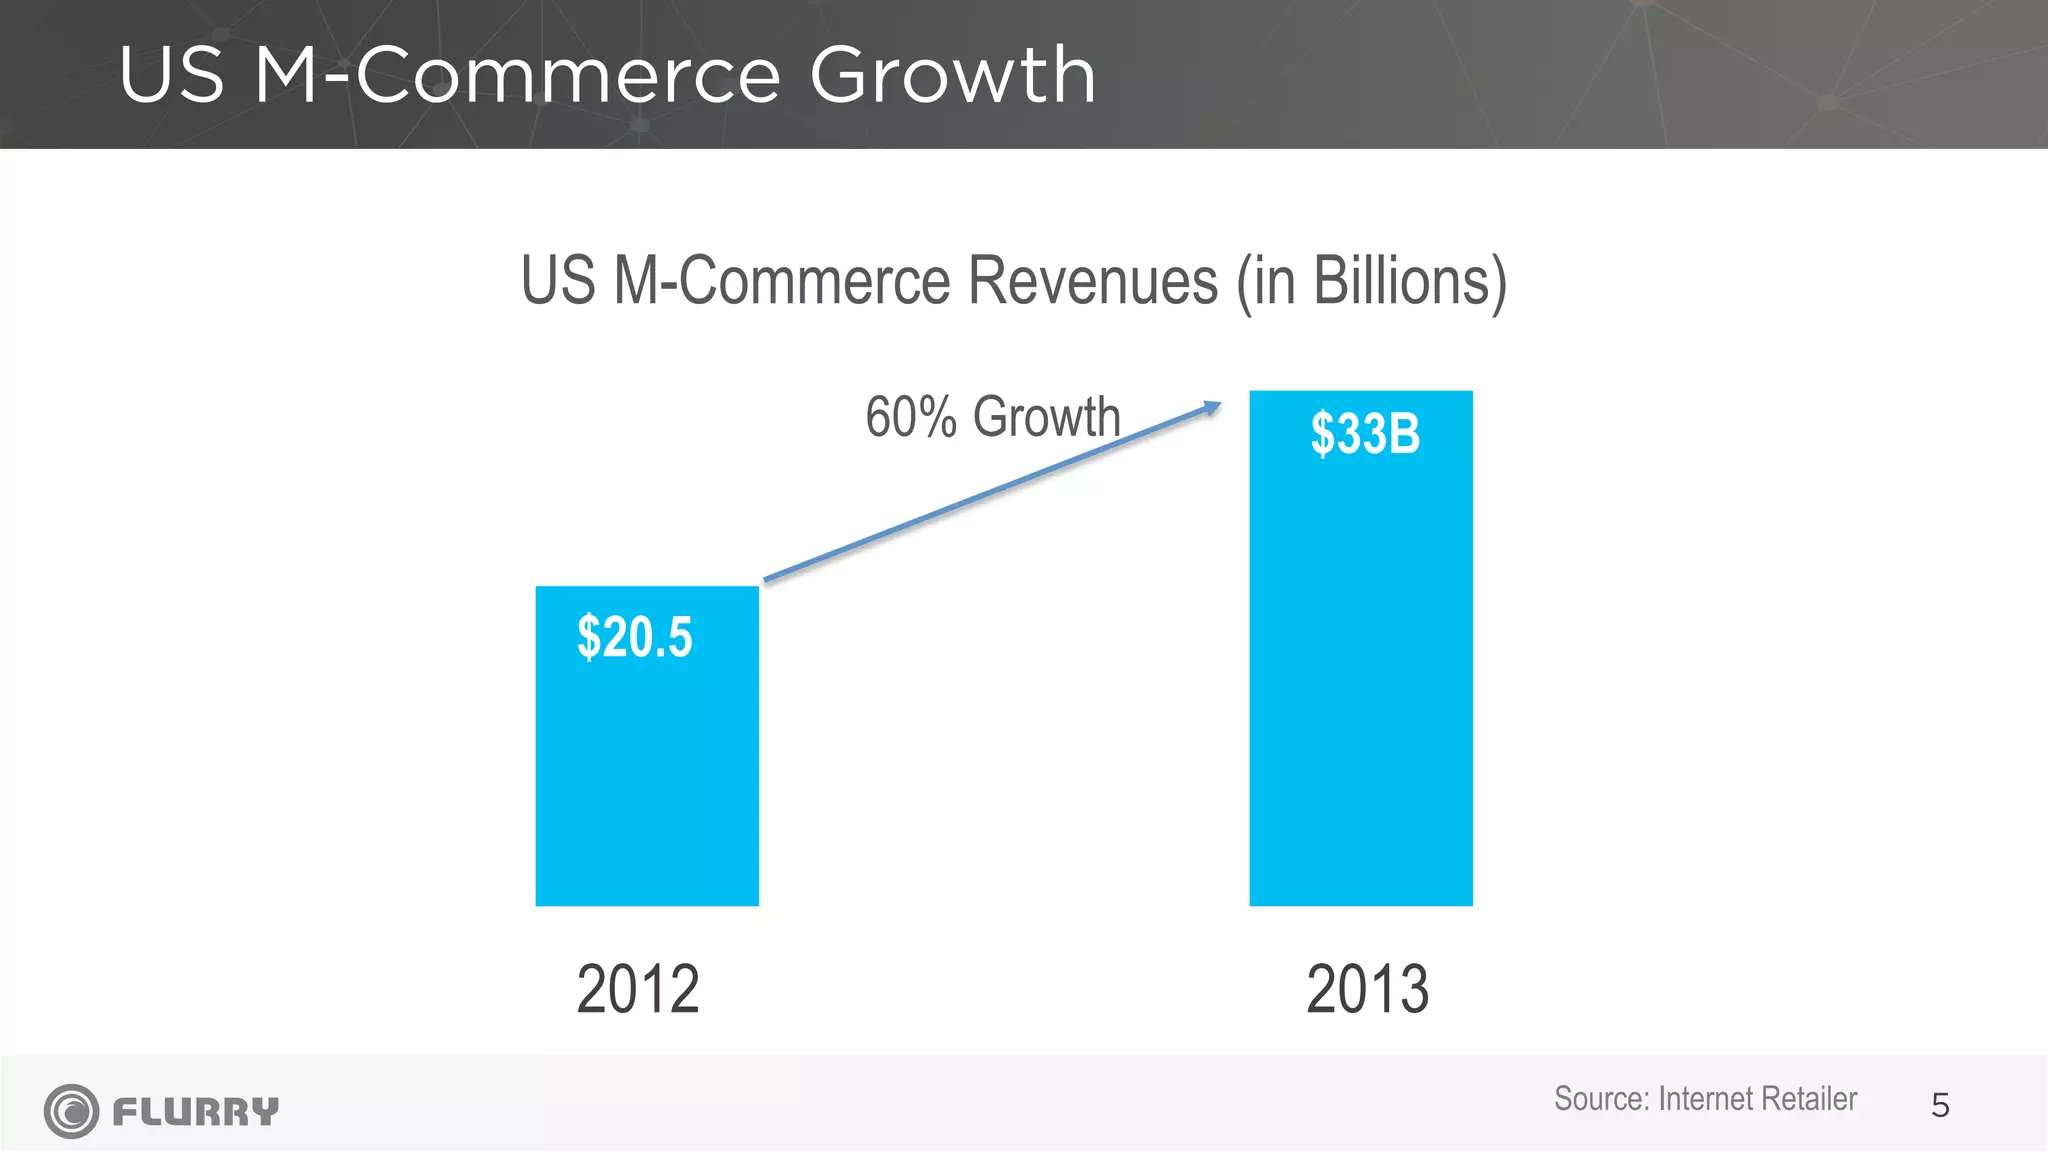
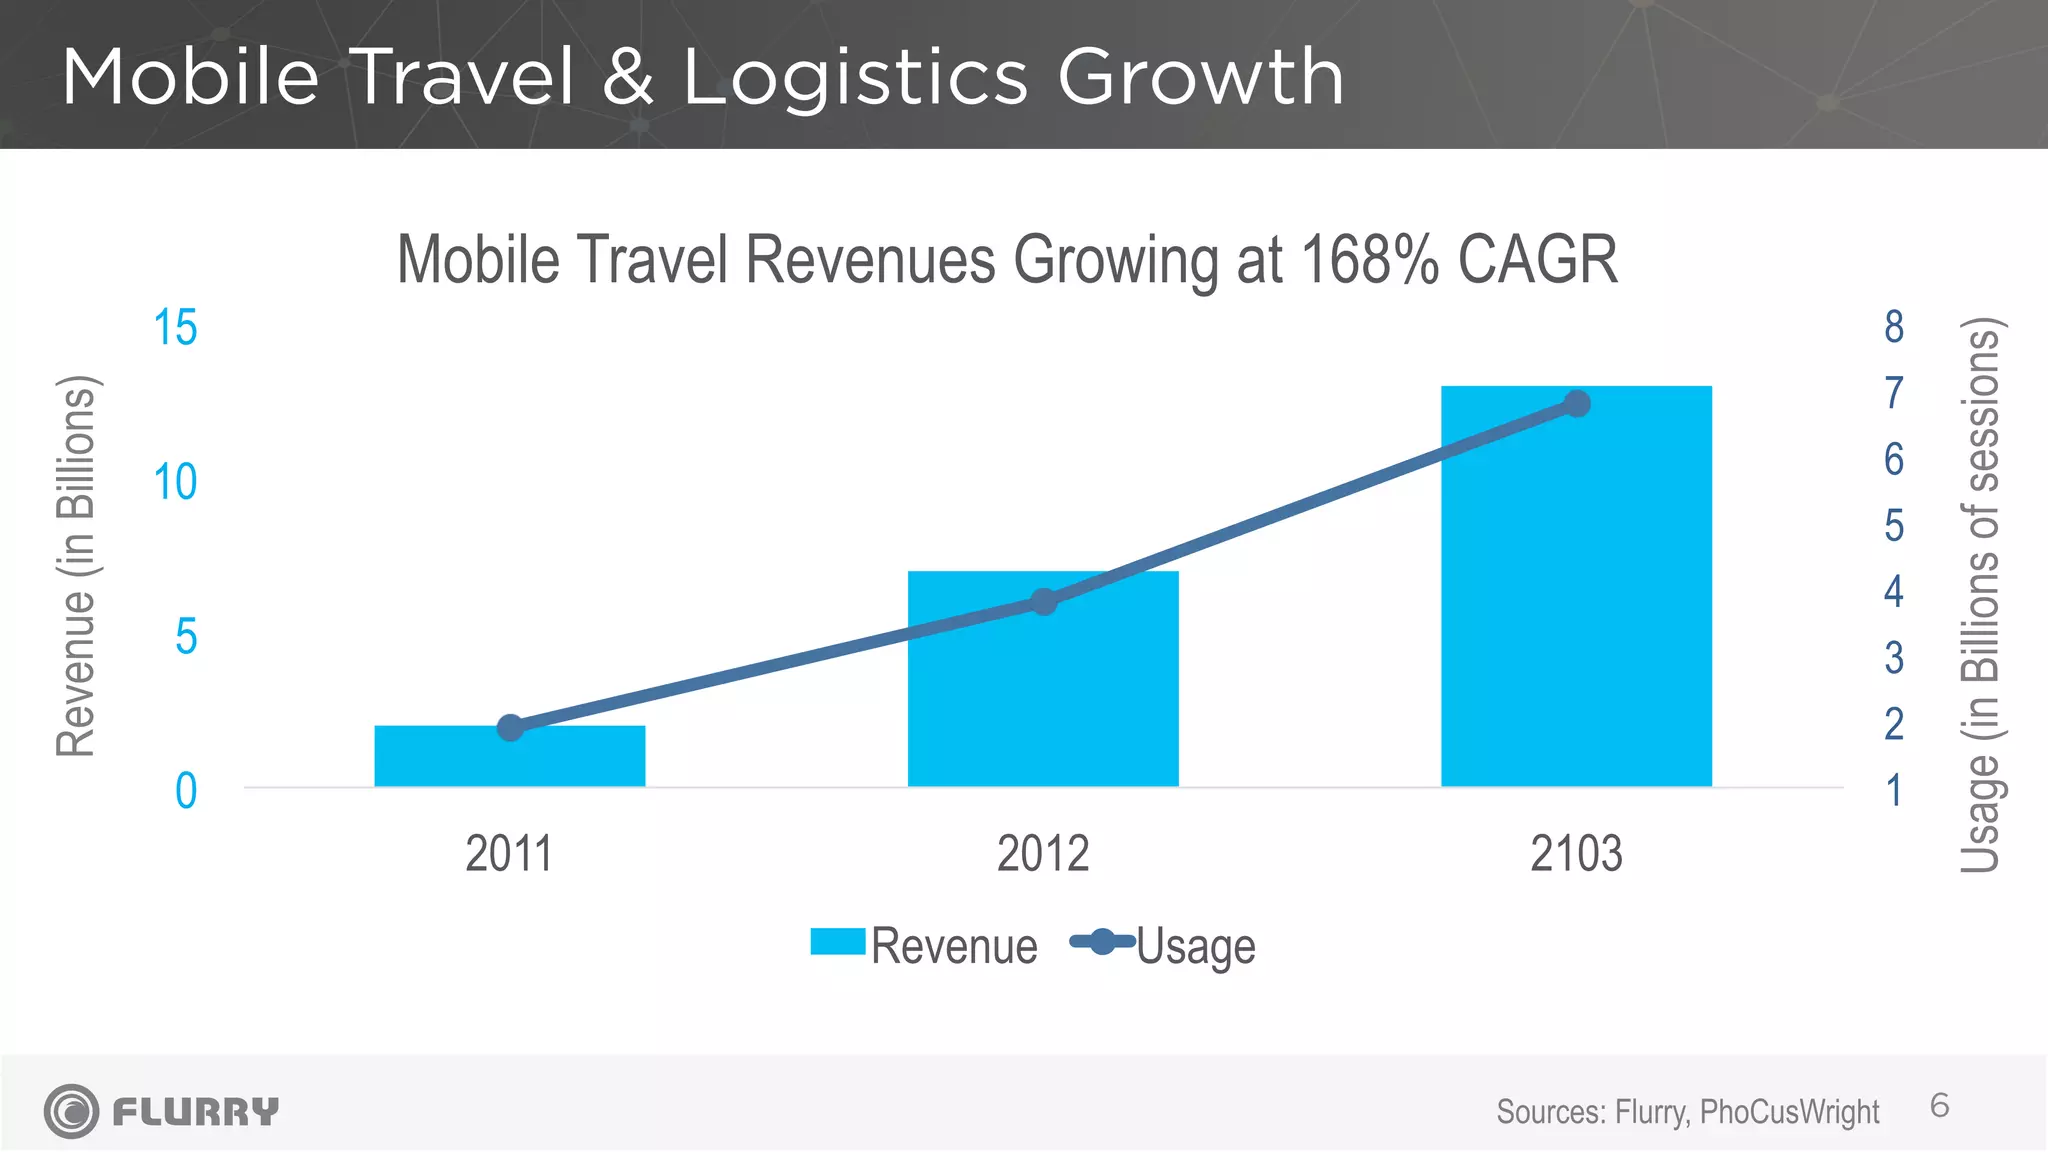
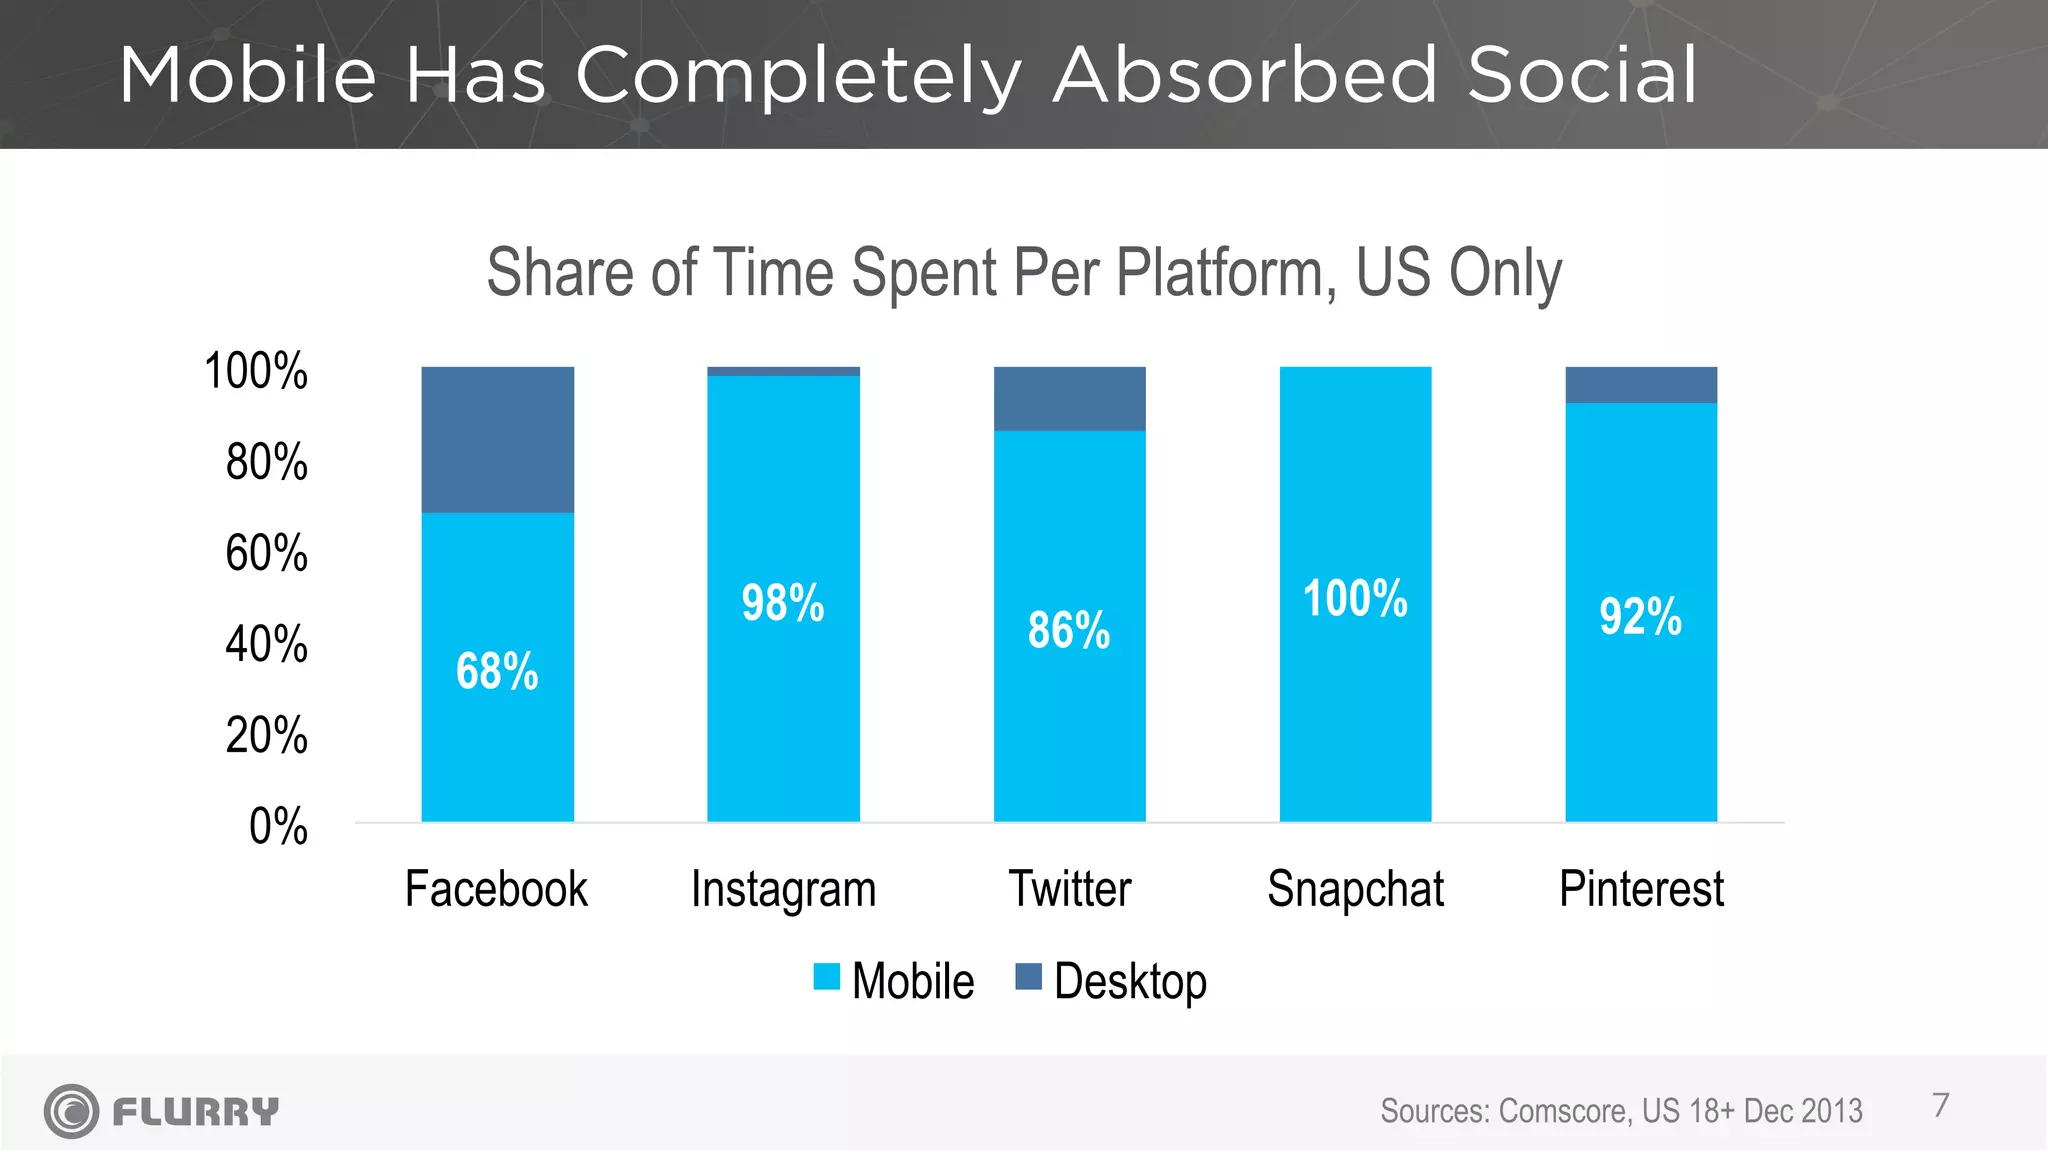
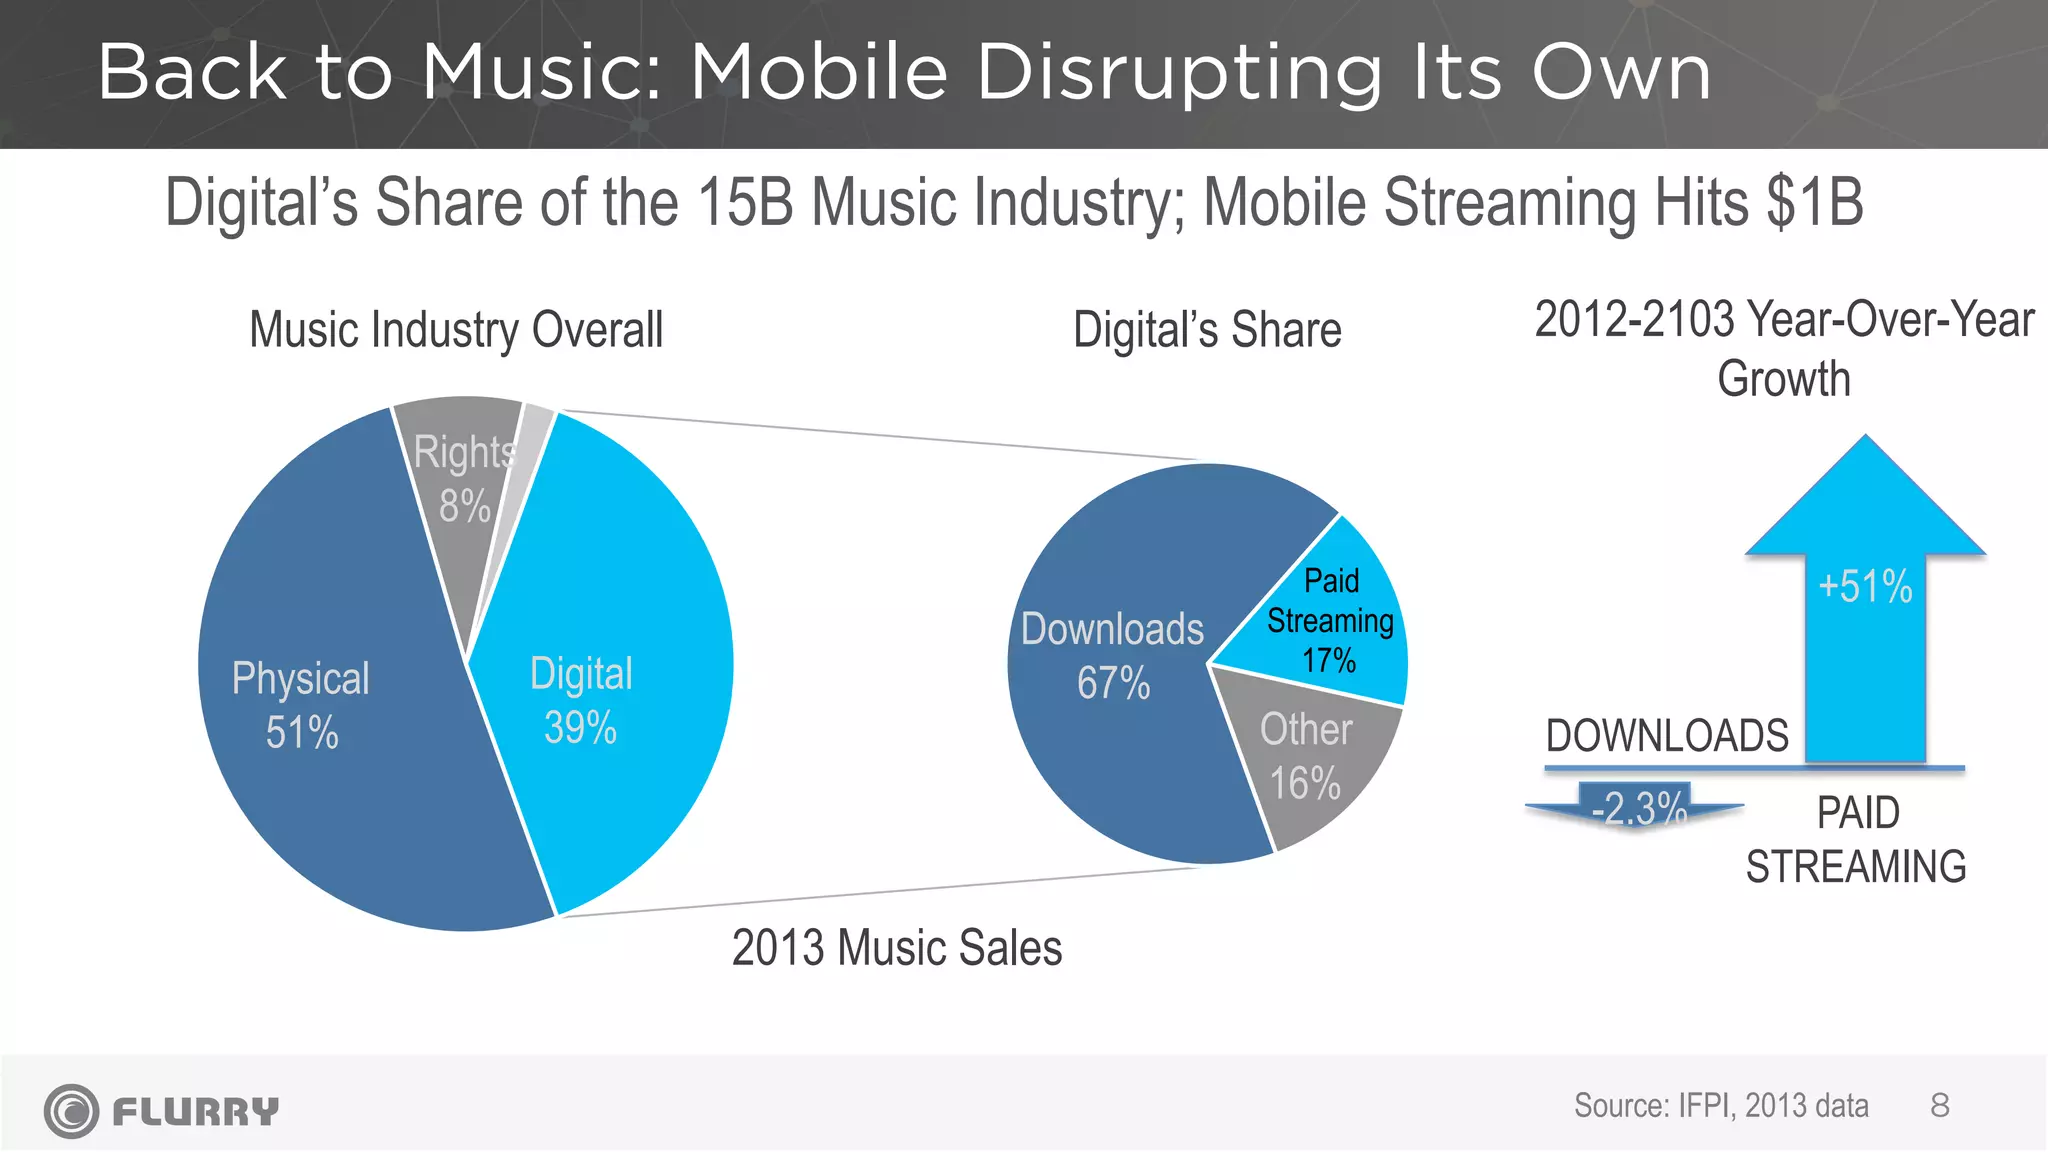
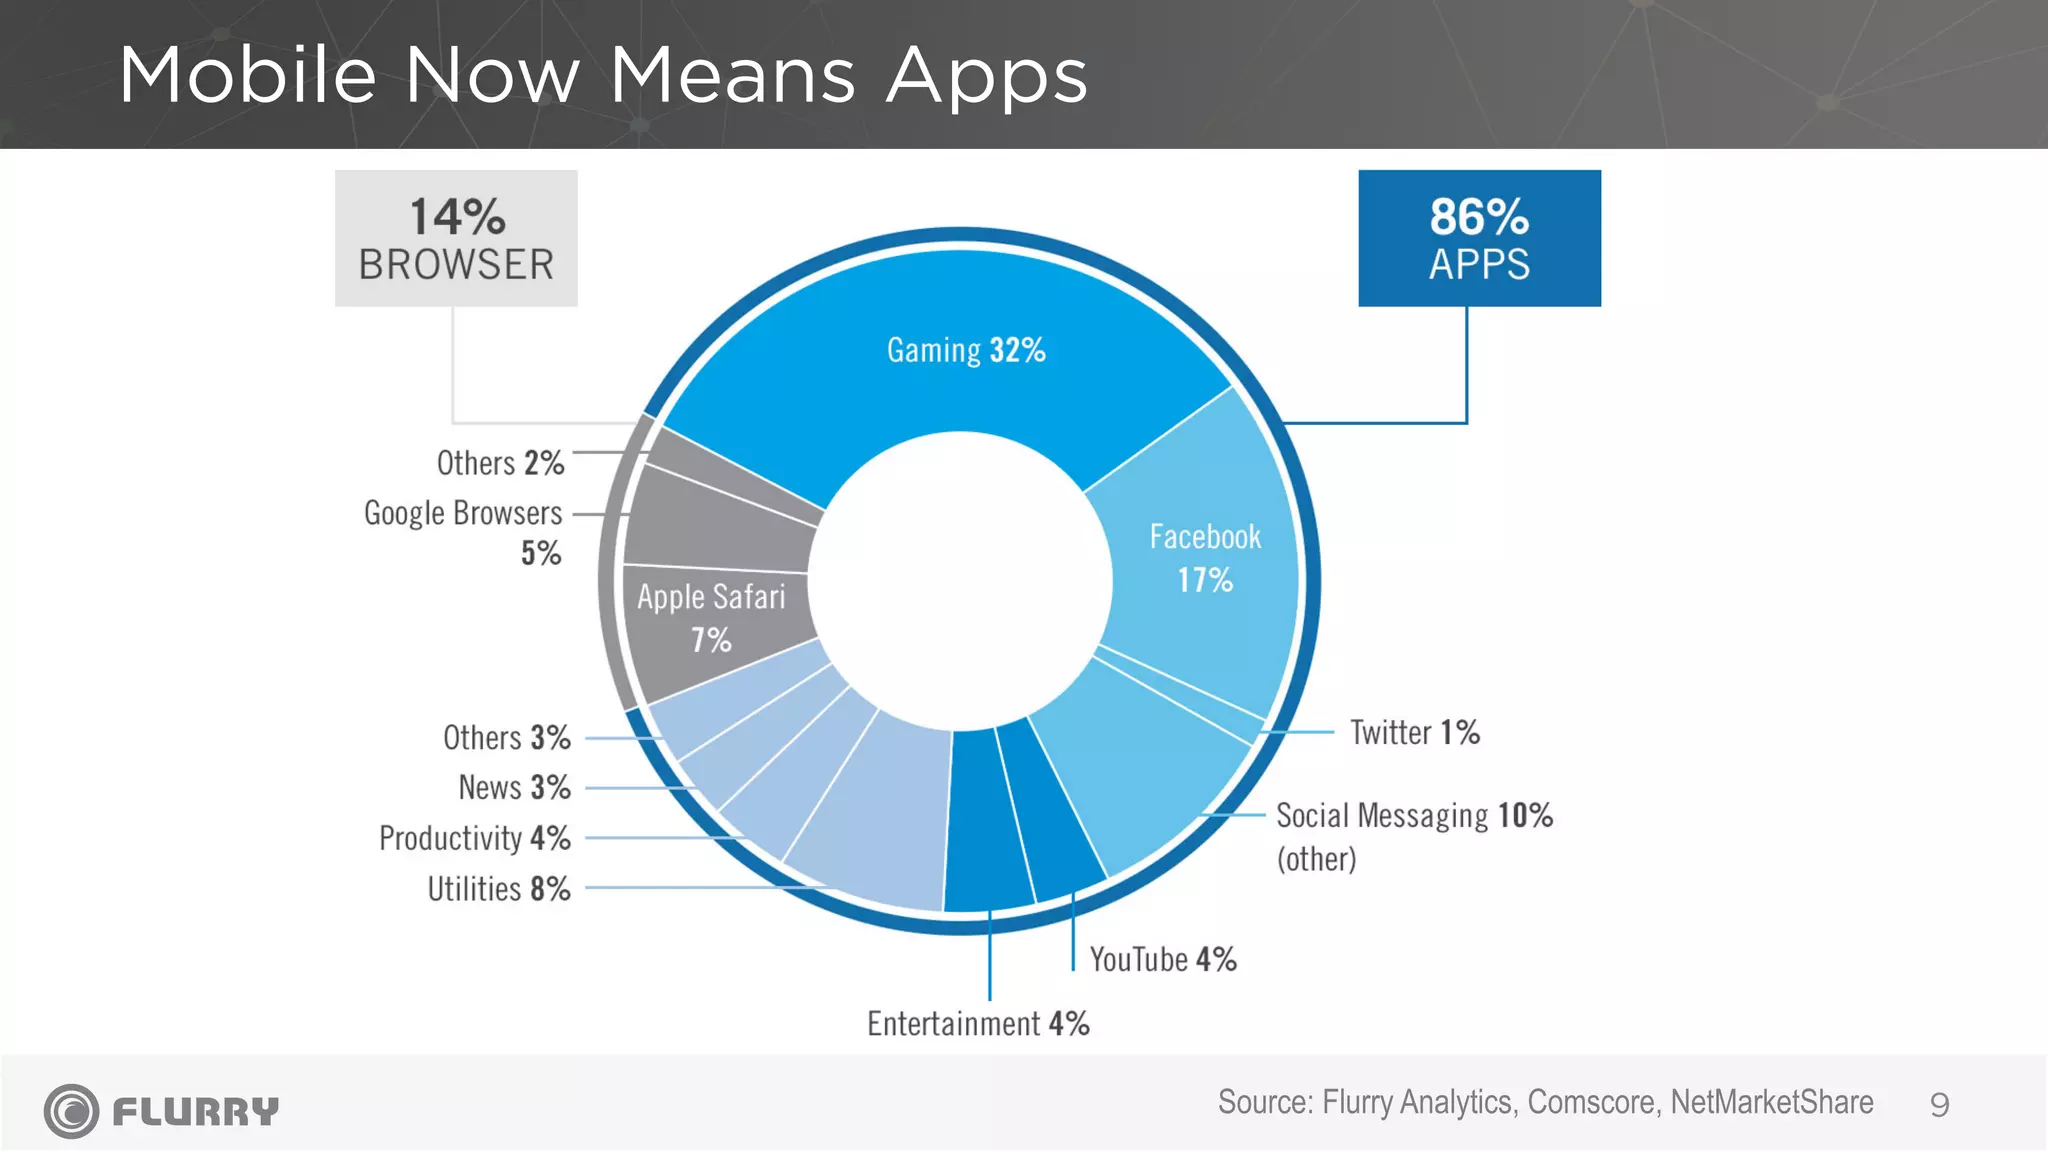
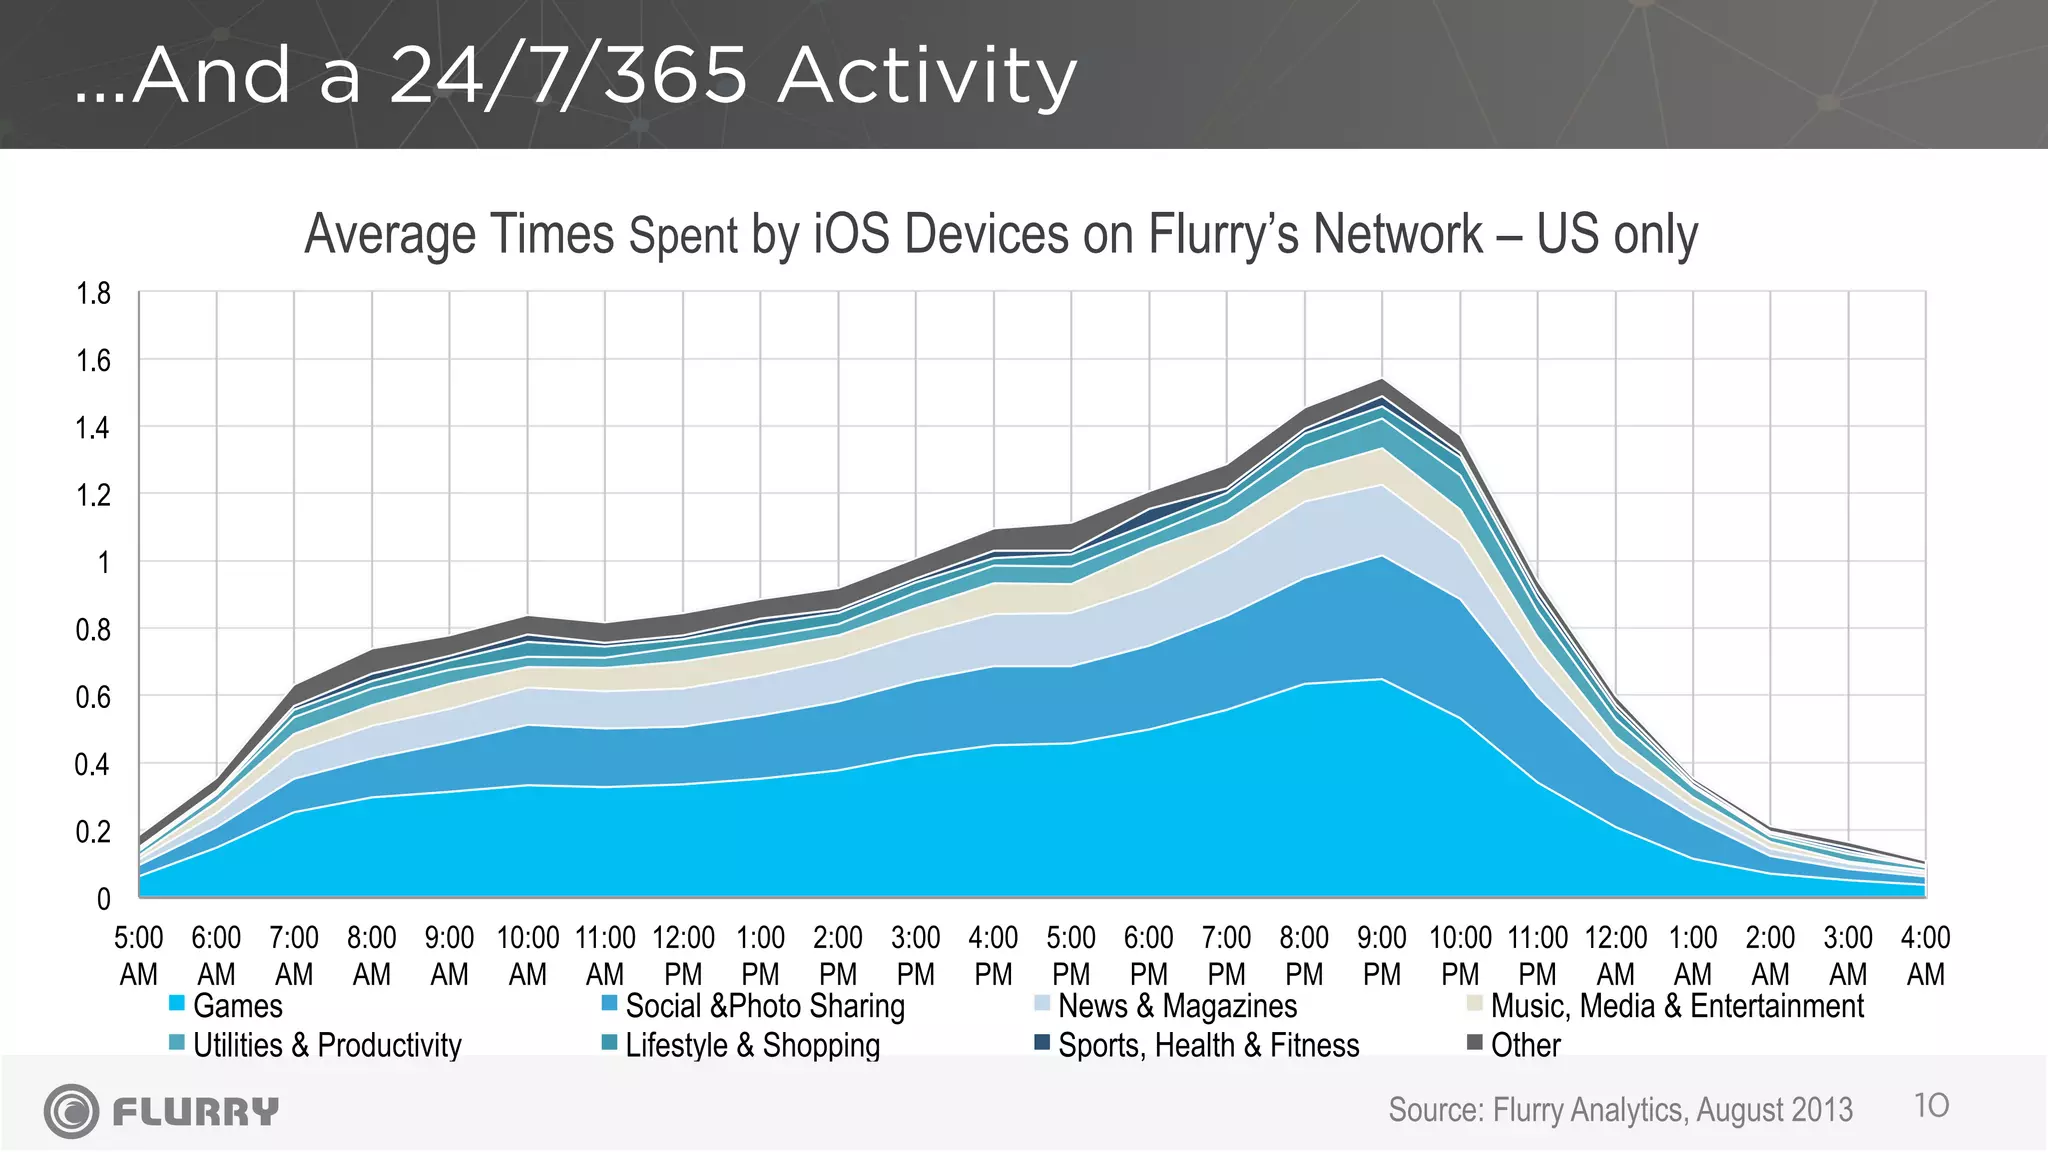
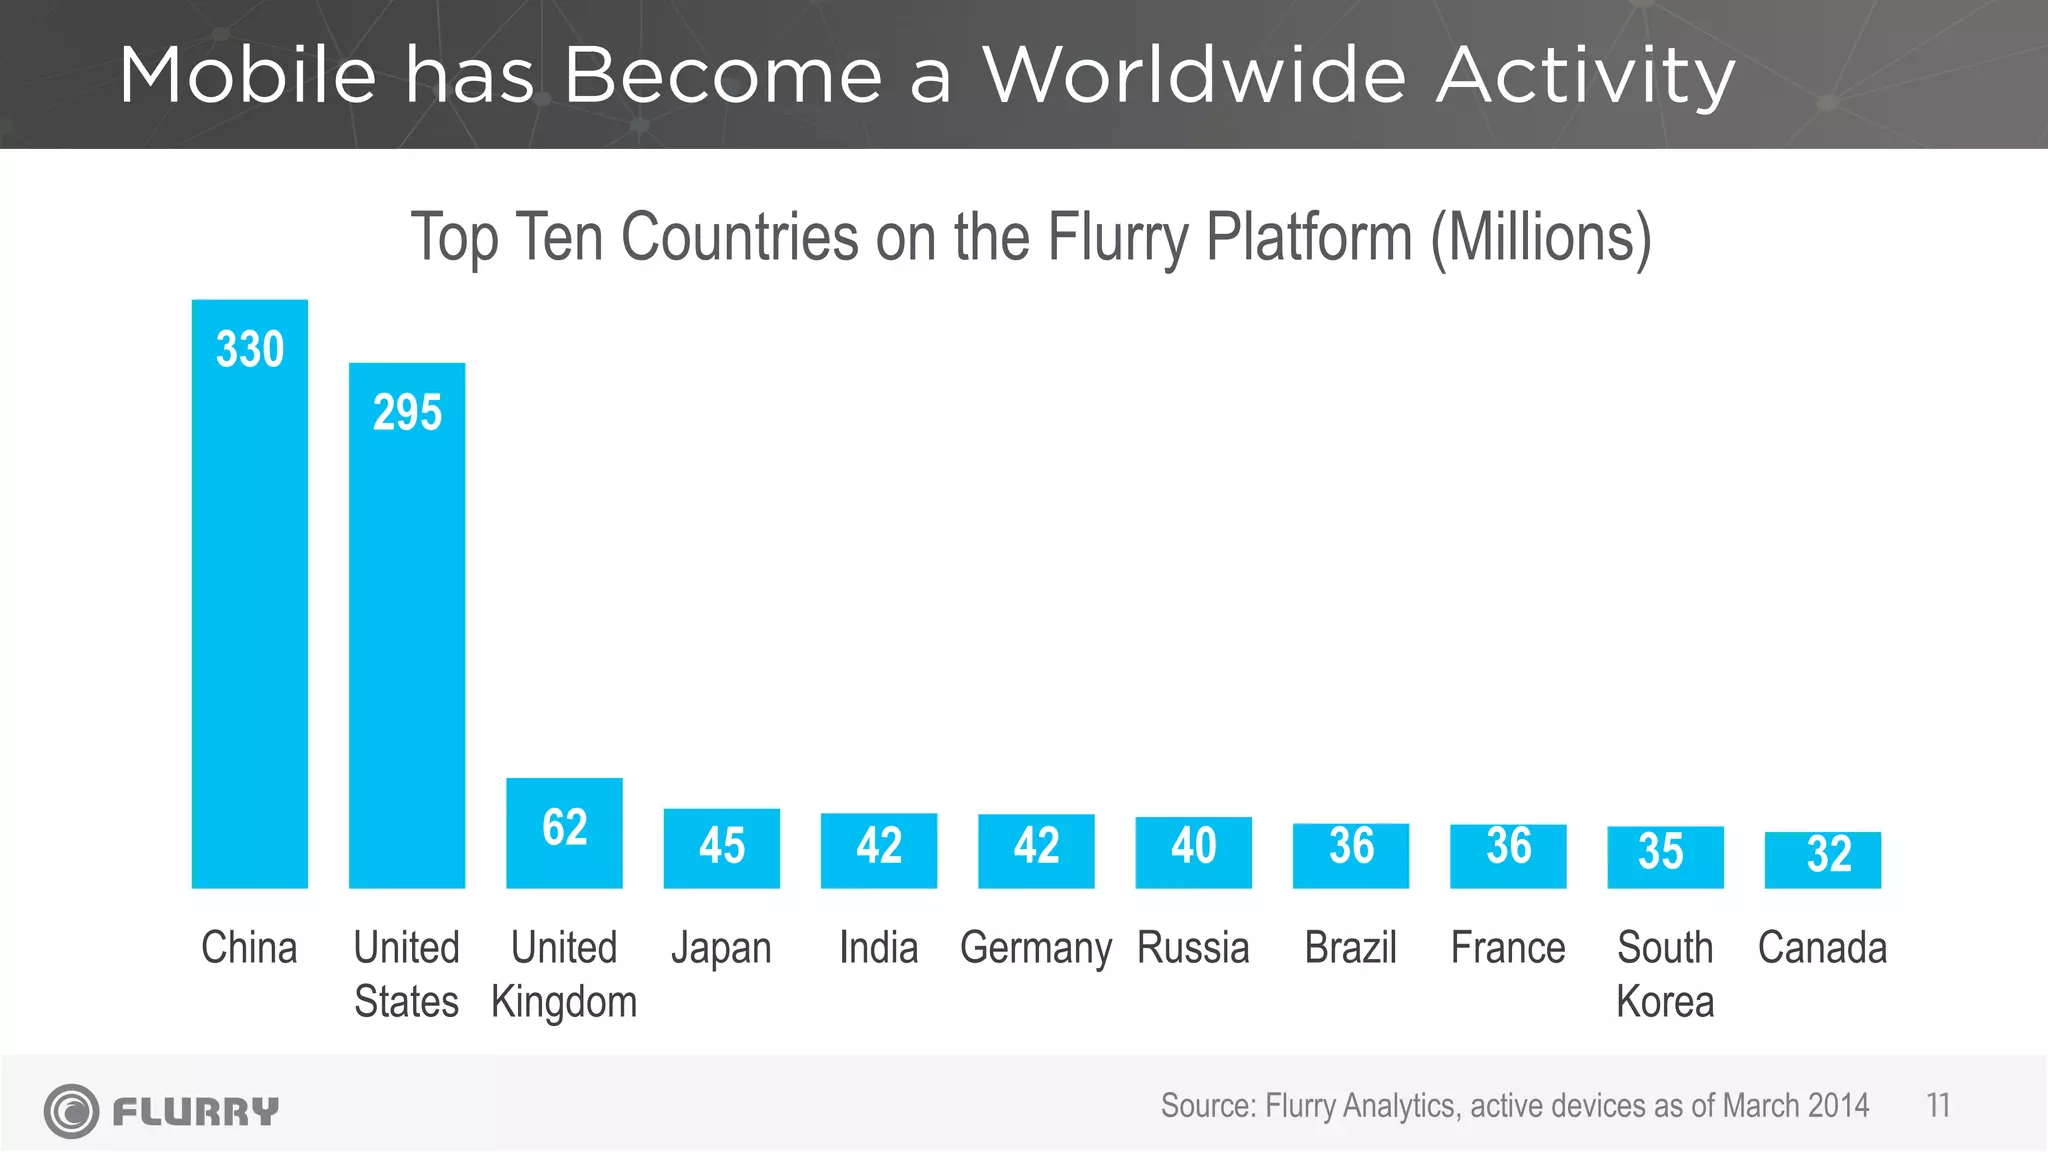
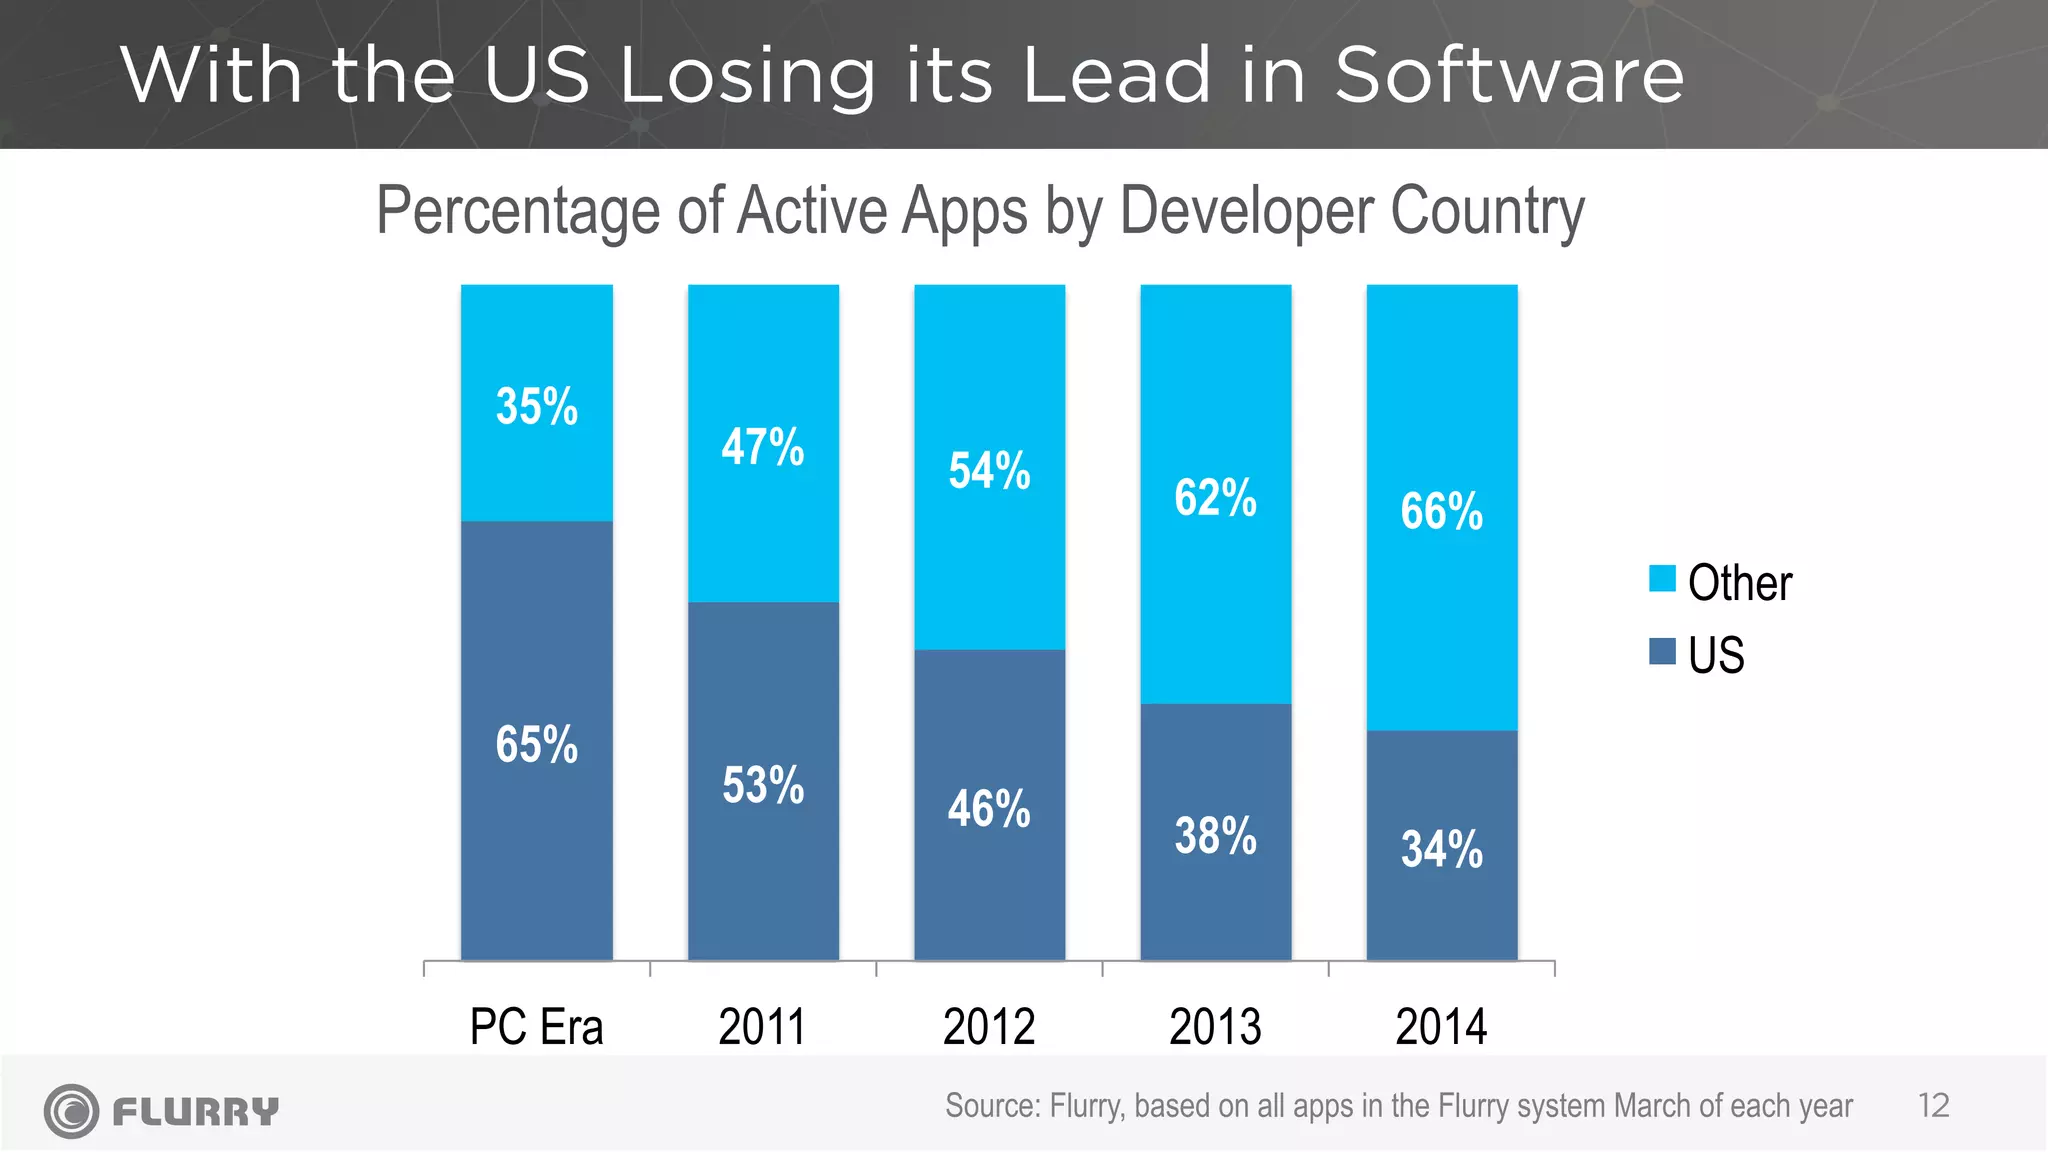
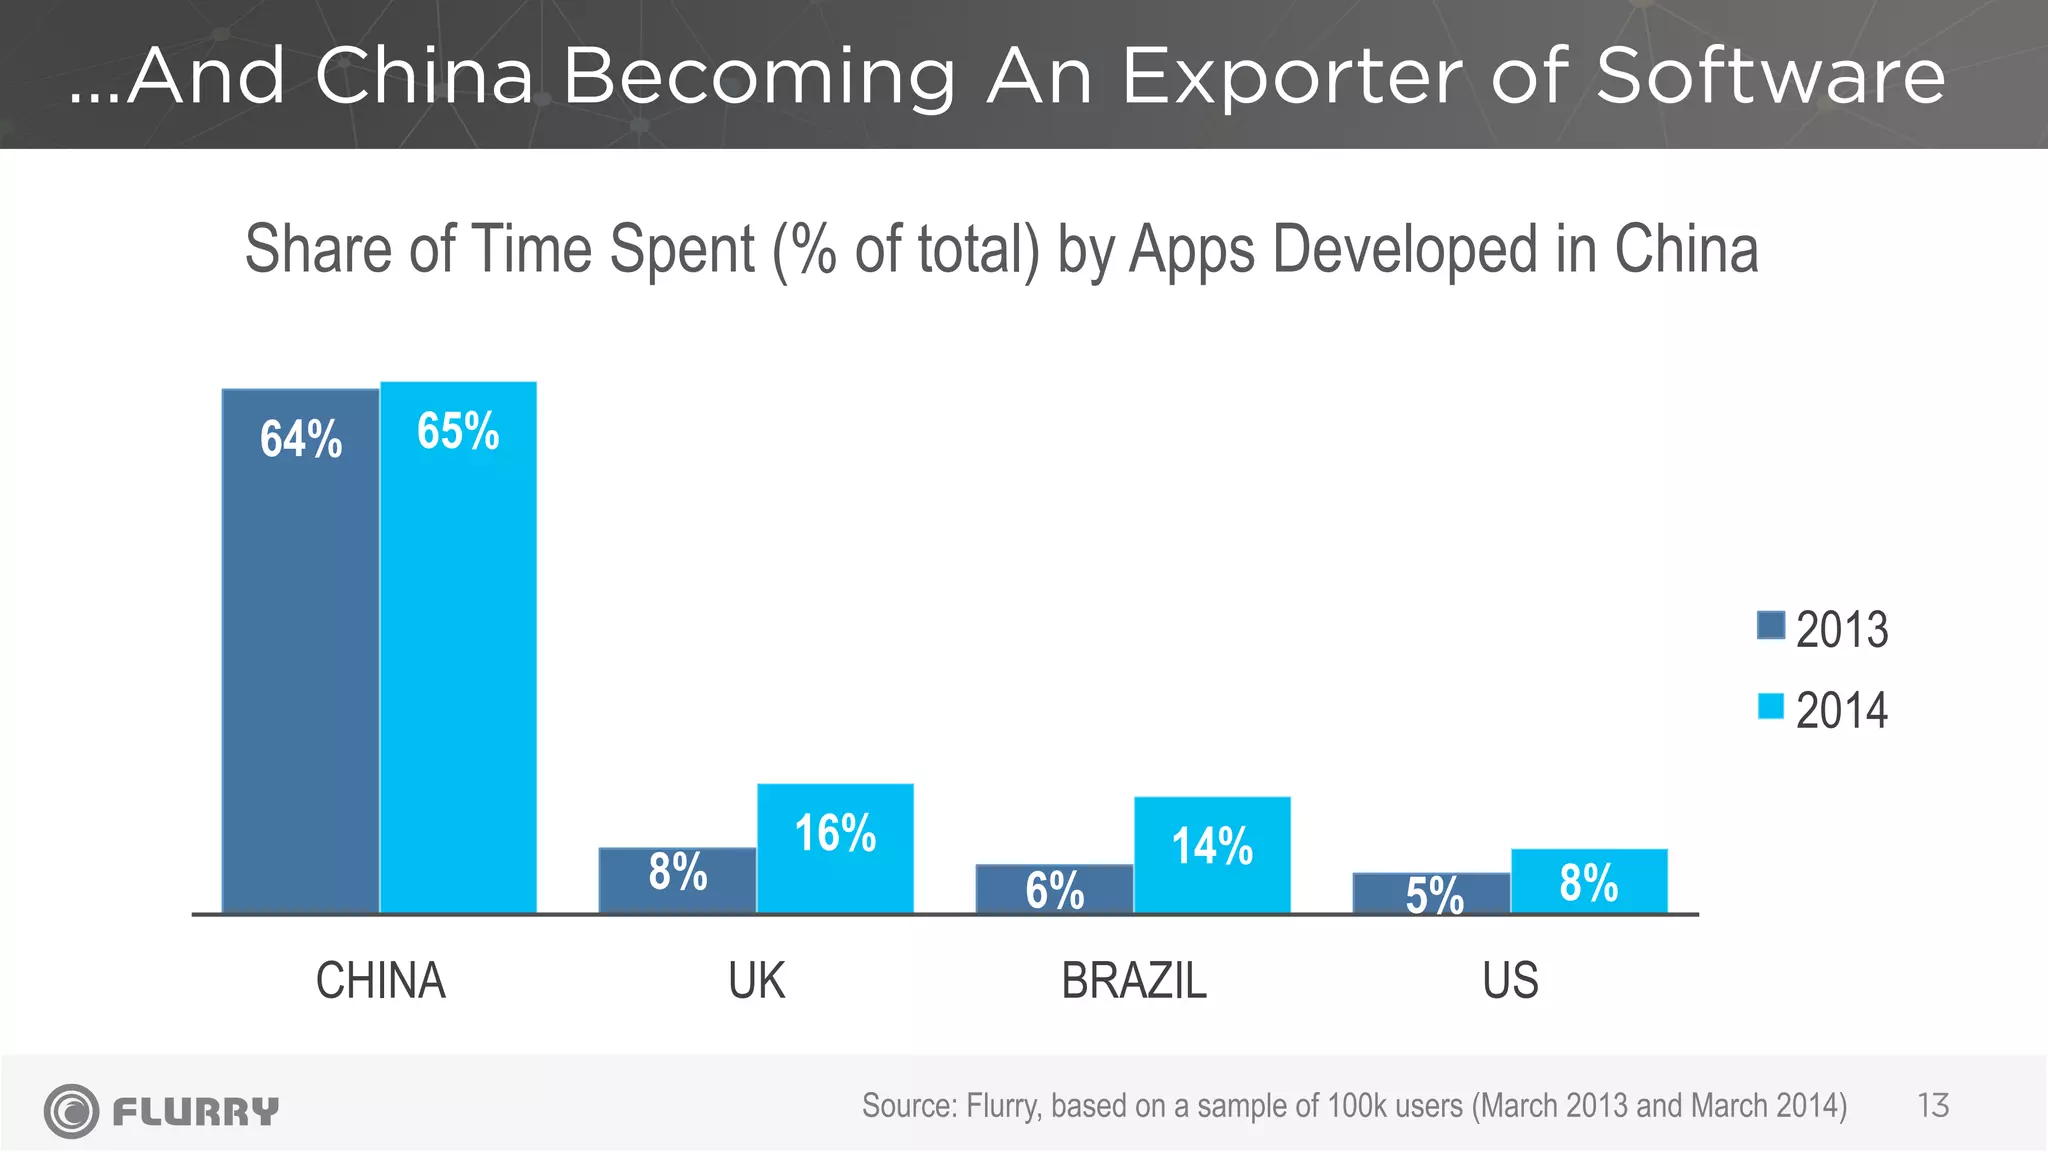
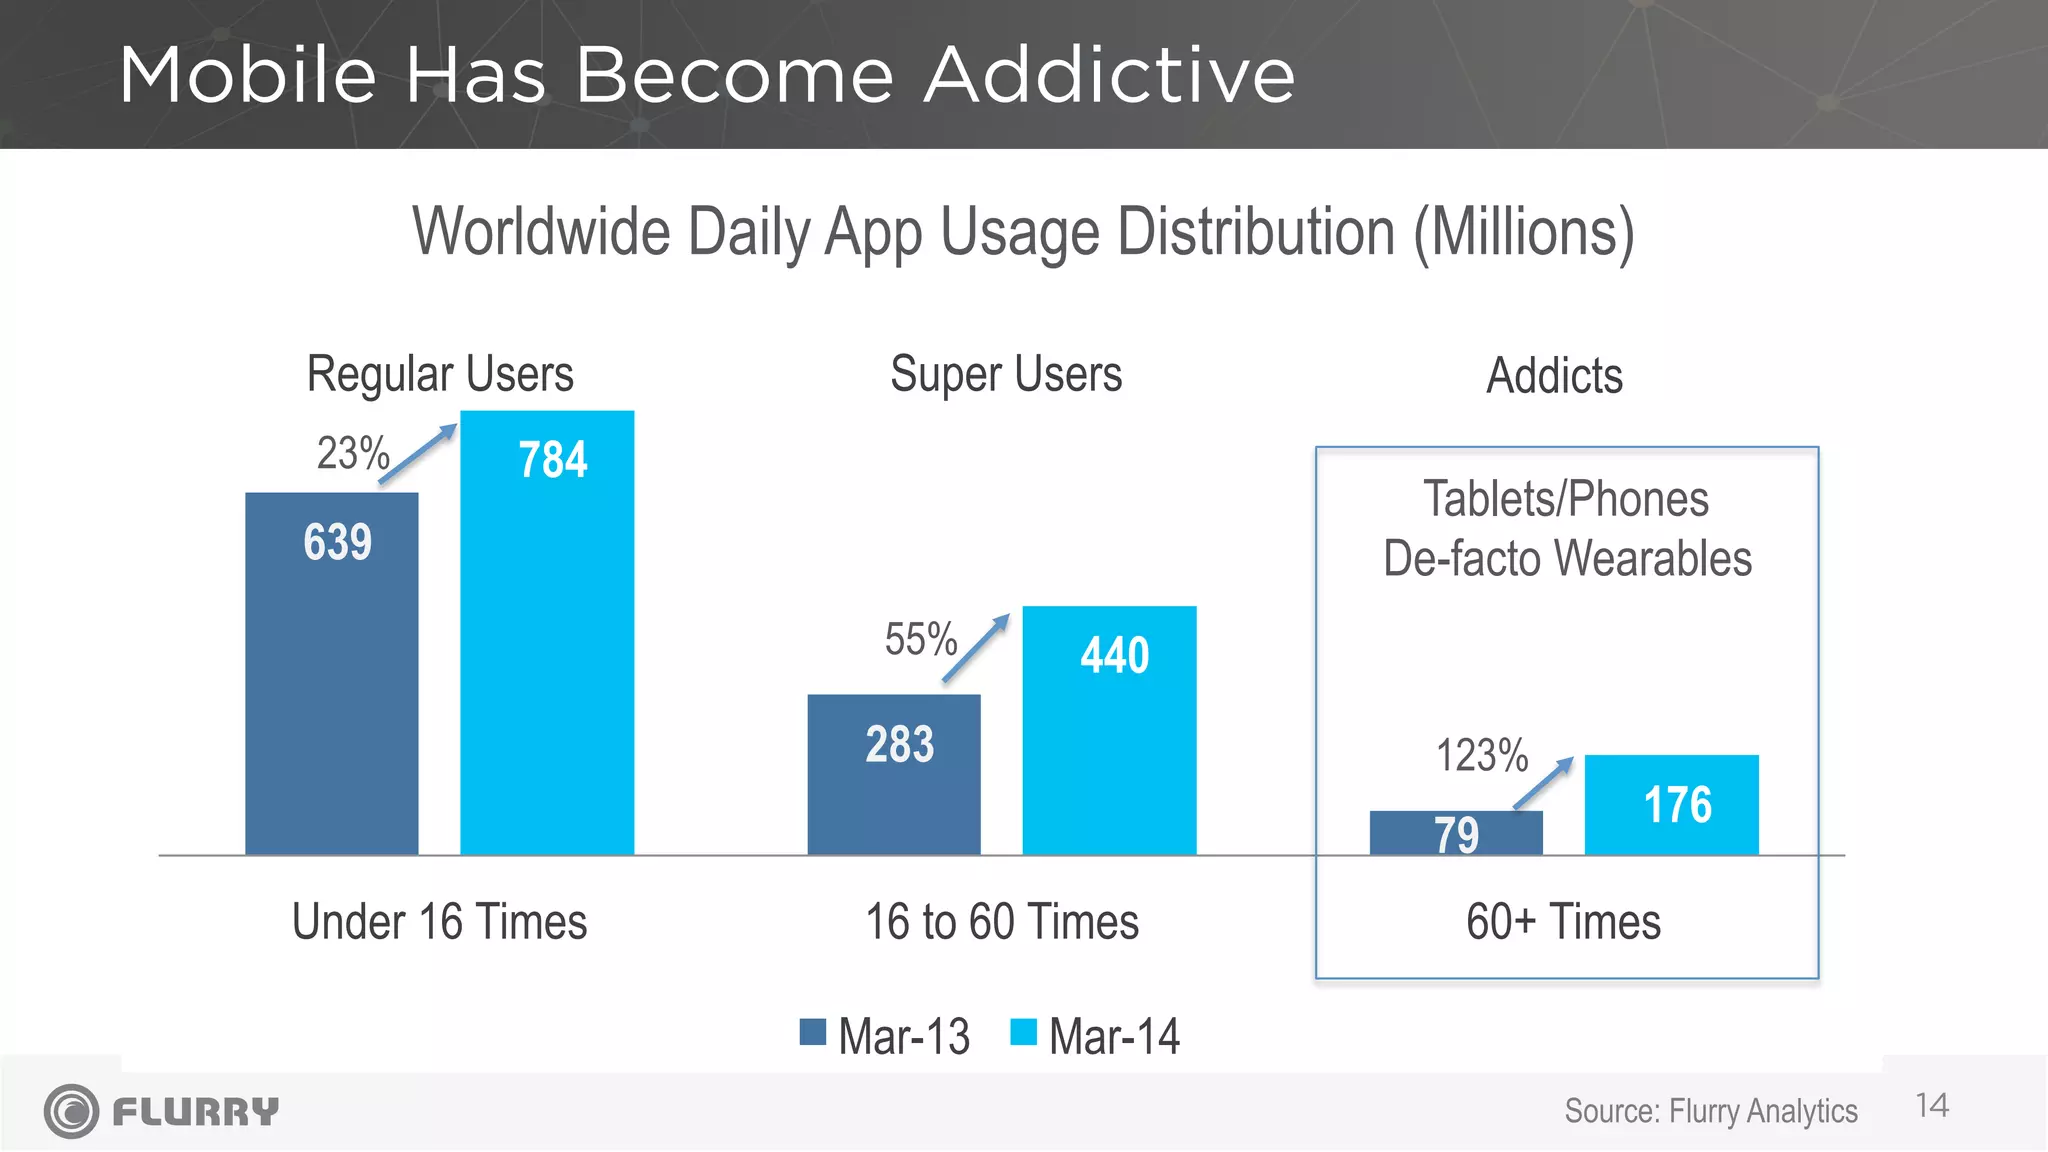


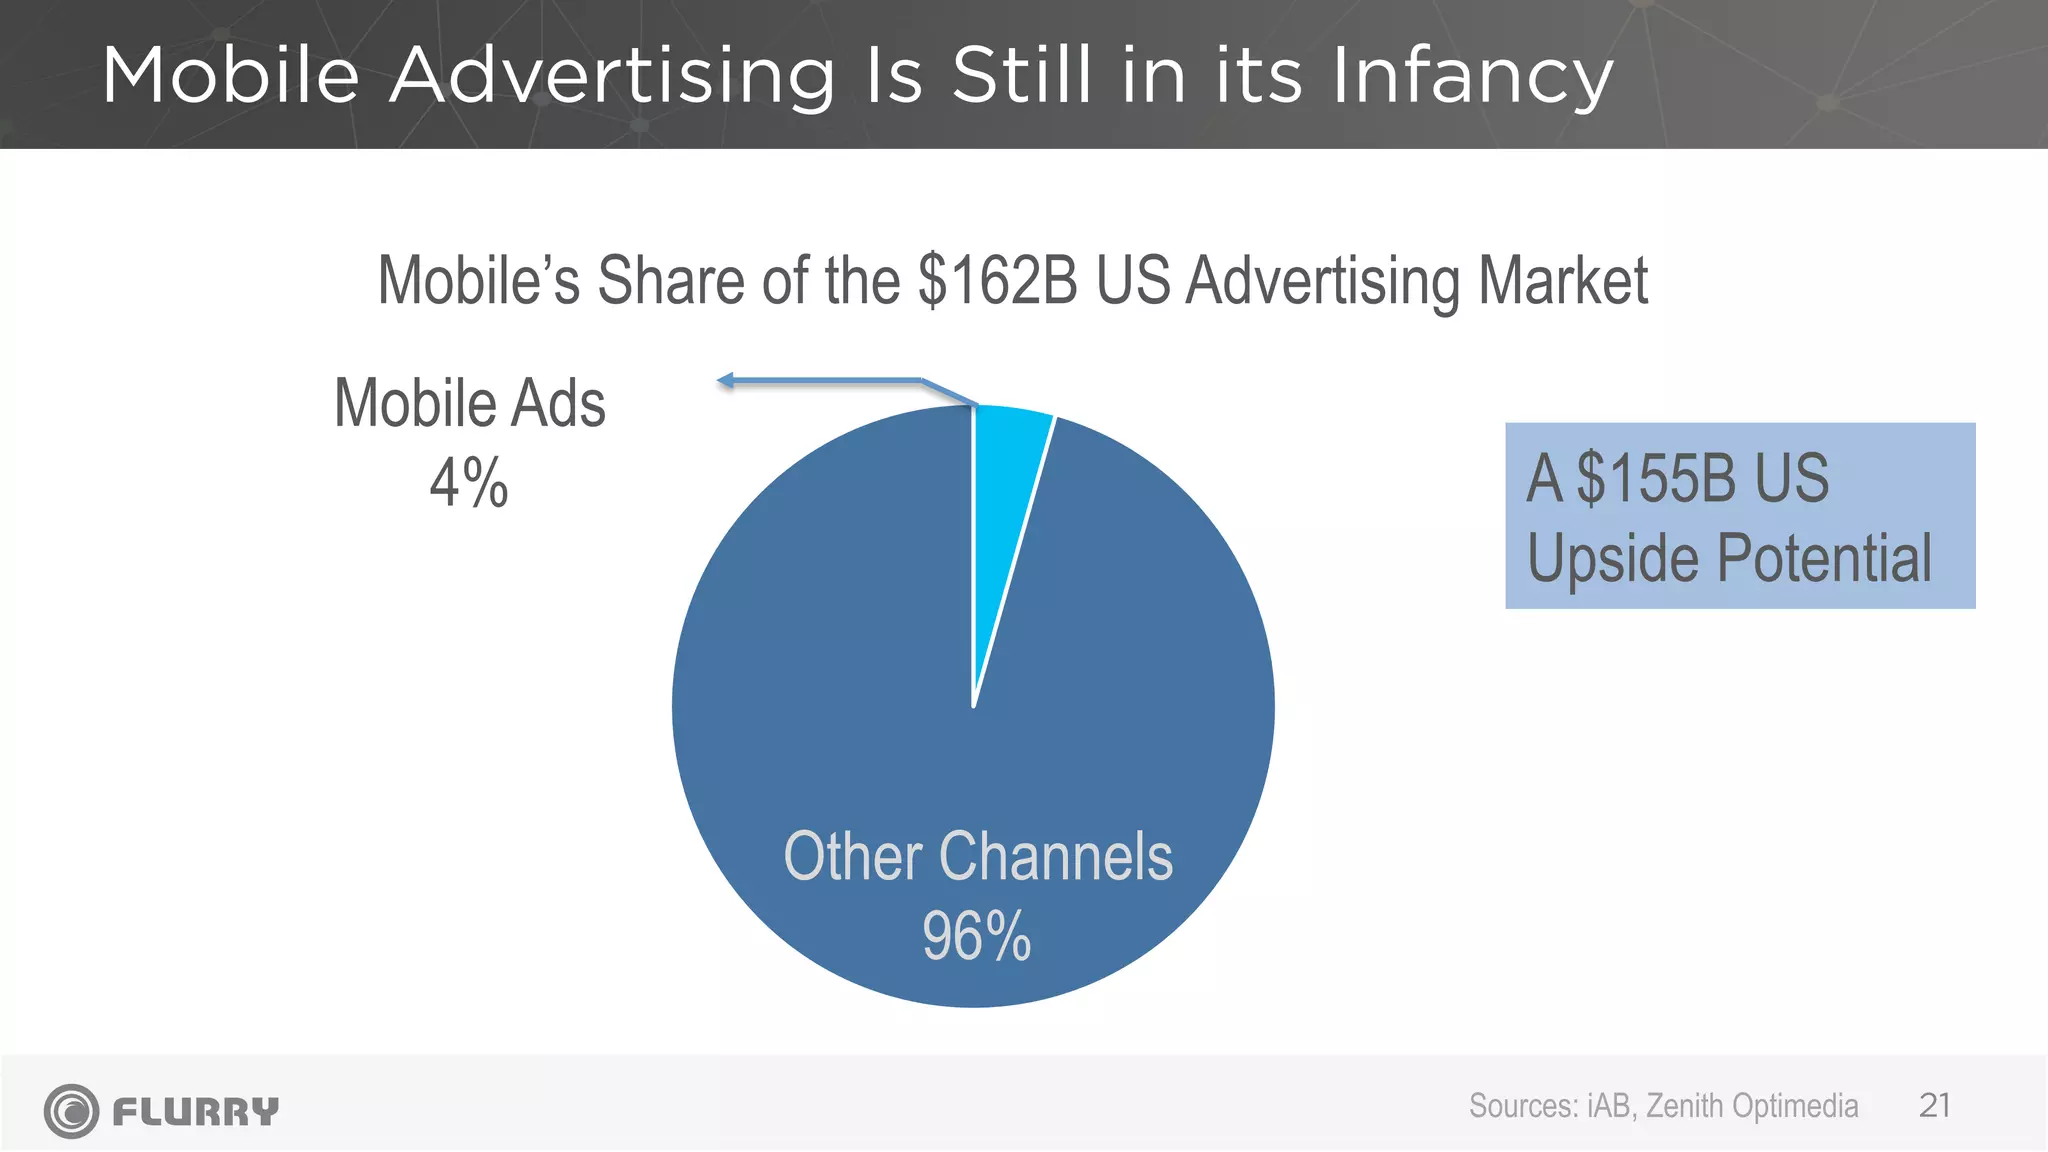
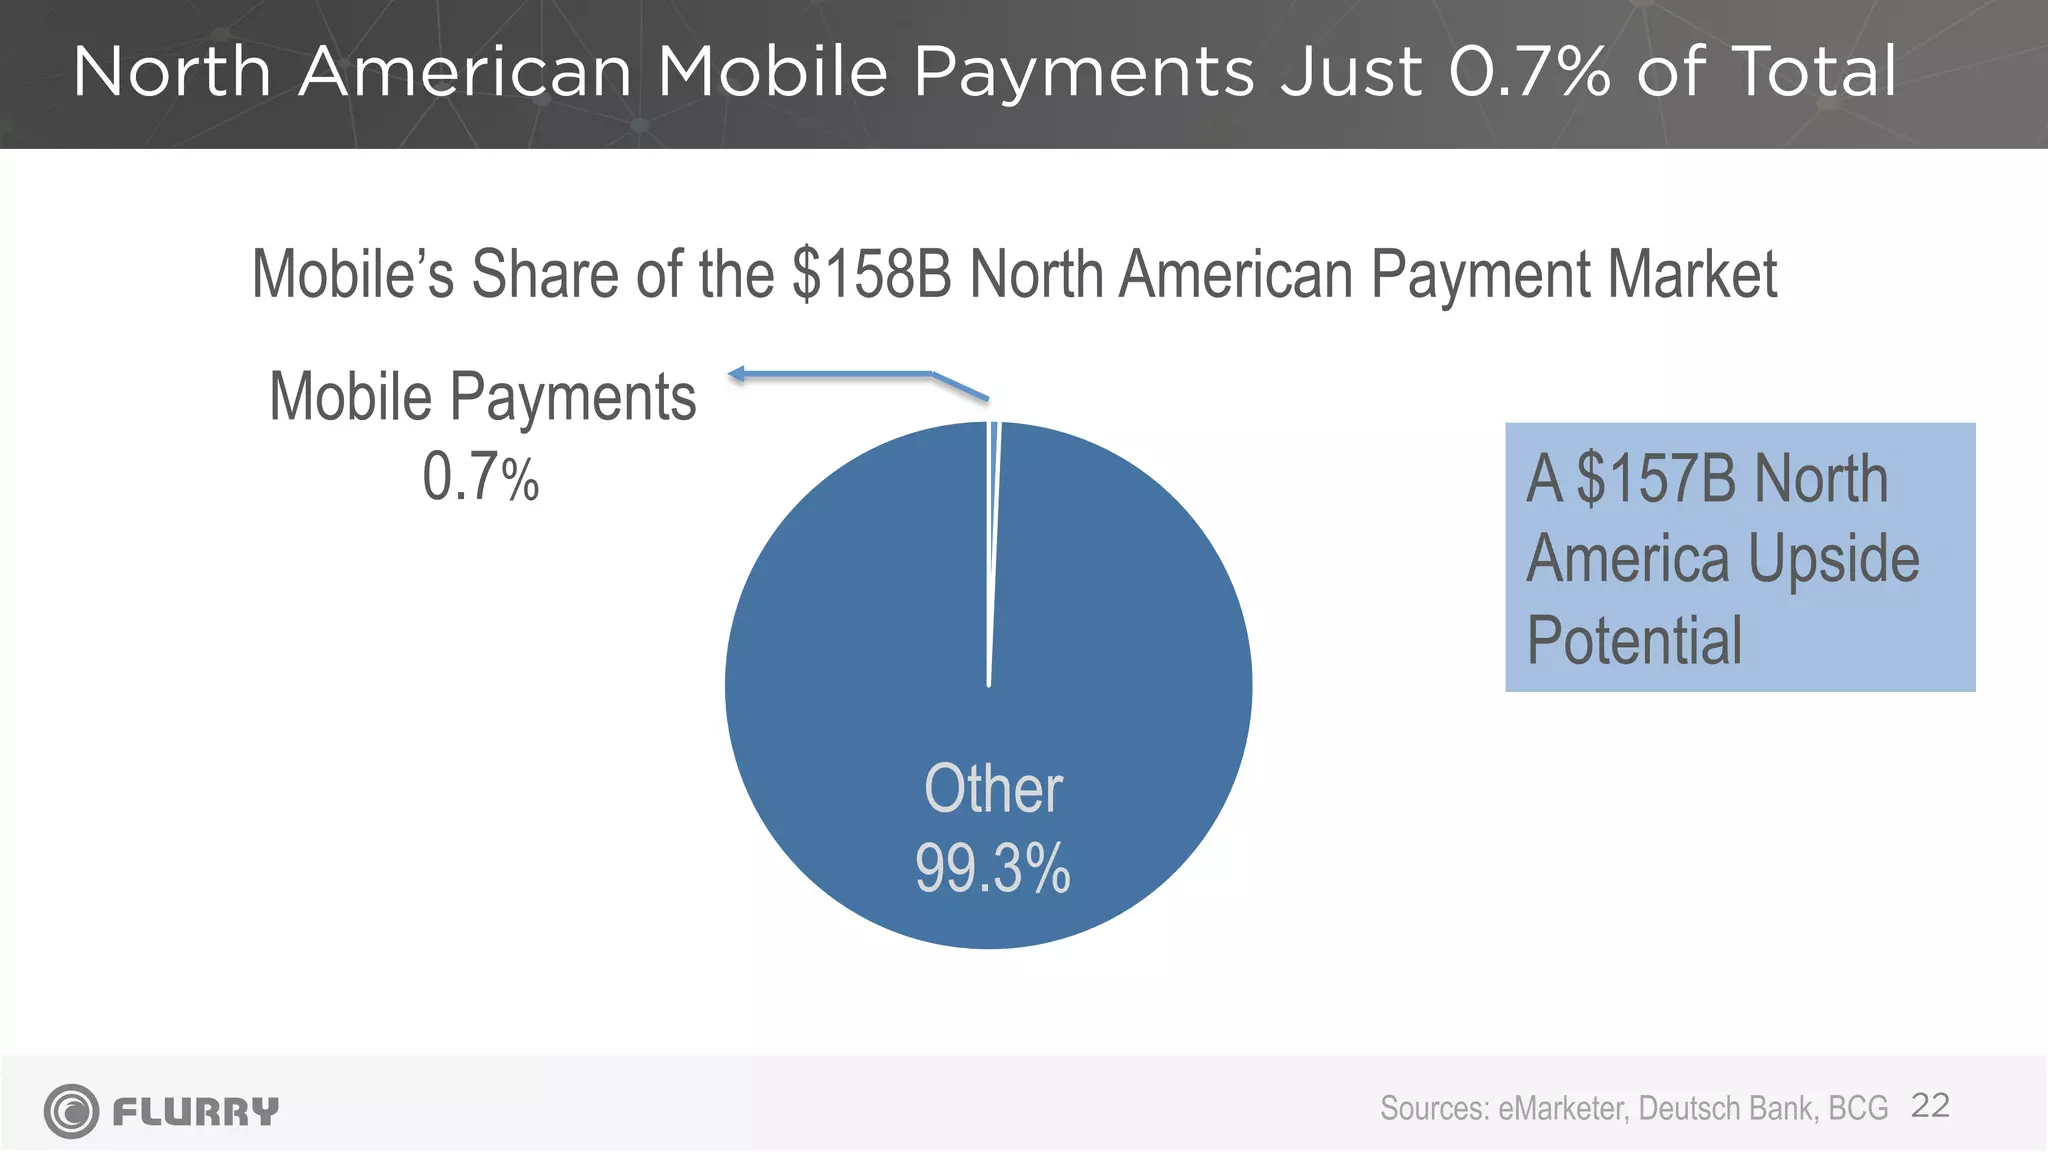


The document discusses the rapid growth of mobile usage across various sectors over the past six years, highlighting substantial increases in messaging, music, and mobile commerce. It emphasizes the emergence of mobile as a dominant platform for social interaction, entertainment, and commerce, while also noting the shifting landscape in software development with China gaining prominence. Despite the growth, it points out that mobile advertising and payments still have significant growth potential in the market.


