
Recommended
More Related Content
Similar to Soon-to-beDr. Sharon ReedResults ppt Slides for your Conside.docx
Similar to Soon-to-beDr. Sharon ReedResults ppt Slides for your Conside.docx (20)
More from whitneyleman54422
More from whitneyleman54422 (20)
Recently uploaded
Recently uploaded (20)
Soon-to-beDr. Sharon ReedResults ppt Slides for your Conside.docx
- 1. Soon-to-be Dr. Sharon Reed Results ppt Slides for your Consideration Research Questions Research Question 1 (RQ1) Is there a difference in aims or goals emphasis, as a leadership behavior, between non-profit human services managers with and without human services degrees? Research Question 2 (RQ2) Is there a difference in personal backing, as a leadership behavior, between non-profit human services managers with and without human services degrees? Research Question 3 (RQ3) Is there a difference in work easing or facilitation, as a leadership behavior, between non-profit human services managers with and without human services degrees? This study was guided by three research questions. They correspond to the three leadership behaviors of interest (aims or goals emphasis; personal backing; and work easing or facilitation). Associated hypotheses are listed in sections that present the results for the research questions. 2 Data Handling Percentages rounded to whole numbers Data were analyzed with SPSS v 25 Statistical significance alpha = .050
- 2. Reliability statistics w Cronbach’s alpha Aims emphasis SS Personal Backing SS Work Easing SS Percentages were rounded off to whole numbers and may not add up to precisely 100%. Data were analyzed with SPSS v 25, which is dedicated statistical software. Statistical significance was set at alpha = .050. Reliability Reliability statistics (i.e., internal consistency) were run on conceptually-similar survey items with Cronbach’s alpha for the three leadership behaviors of interest (aims or goals emphasis; personal backing; and work easing or facilitation). Cronbach’s alpha statistics range in value from 0 to 1. The closer Cronbach’s alpha is to 1, the greater the reliability of the database. Indices of .70 or higher reflect an adequately reliable database (Gliner & Morgan, 2000). Summated Scale Scores A summated scale was generated for each of the three leadership behaviors of interest (aims or goals emphasis; personal backing; and work easing or facilitation). A summated scale is a single empirical measure that represents multiple aspects of a construct in one variable (Hair et al., 2010). Deriving a single measure from several related aspects decreases the measurement error in the original data points, which increases data reliability and validity as well as parsimony in the overall number of variables (Hair et al., 2010). Because each summated score was a mean, its possible values ranged 1 – 7 (1 = strongly disagree, 7 = strongly agree) like the Likert scale used to measure responses to survey items. Aims emphasis. Two survey items measured the leadership dimension of “aims emphasis.” An example of a survey item
- 3. that measured aims emphasis is: “My manager makes sure subordinates have clear goals to achieve.” Internal consistency was high, Cronbach’s alpha = .74. Because of high internal consistency, a summated scale (SS) was generated, using the mean response of the related items. It is hereafter called the Aims Emphasis SS. Personal backing. Three survey items measured the leadership dimension of “personal backing.” An example of a survey item that measured personal backing is: “My manager is concerned about his/her subordinates as people.” Cronbach’s alpha showed that internal consistency was high, alpha = .84. Because of high internal consistency, a summated scale (SS) was generated, using the mean response of the related items. It is hereafter called the Personal Backing SS. Work easing. Four items measured the leadership dimension of “work easing.” An example of a survey item that measured work easing is: “My manager helps his/her subordinates solve work-related problems.” Cronbach’s alpha showed that internal consistency was high, alpha = .94. Because of high internal consistency, a summated scale (SS) was generated, using the mean response of the related items. It is hereafter called the Work Easing SS. 3 Demographic Characteristics 113 individuals completed surveys 10 participants (cases 4, 14, 20, 21, 33, 45, 62, 78, 101, 105) failed to provide information on their managerial educational background, leadership style, or both and were eliminated from further analyses, N = 103 participants Modal participant was a married Caucasian woman in her 40s who had worked for her current organization for ten years and for her current manager for five years
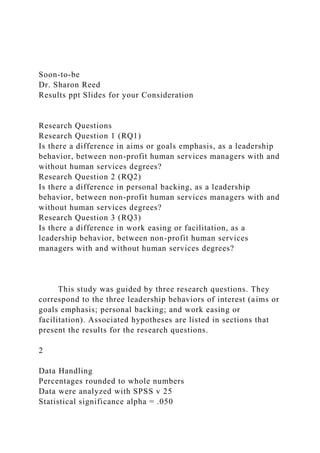
- 4. Demographic Characteristics This section presents demographic variables and characterizes the modal participant. A total of 113 individuals completed surveys. Of those, 10 participants (cases 4, 14, 20, 21, 33, 45, 62, 78, 101, 105) failed to provide information on their managerial educational background, leadership style, or both. They were eliminated from further analyses, N = 103 participants. The demographic results in this section show that the modal participant was a married Caucasian woman in her 40s who had worked for her current organization for ten years and for her current manager for five years. There were three times as many participants whose managers did not hold human service degrees, n = 75 participants, 73%, as participants who managers held human services degrees, n = 28 participants, 28%. The 3-to-1 ratio of non-degree-holders to degree-holders is illustrated on Figure 1. 4 Human Services Degree Holders NO YES Figure 1. Numbers of participants by human services degrees. There were three times as many participants whose managers did not hold human service degrees, n = 75 participants, 73%, as participants who managers held human services degrees, n = 28 participants, 28%. The 3-to-1 ratio of non-degree-holders to degree-holders is illustrated on Figure 1. 5 Gender and Ethnicity
- 5. Figure 2. Numbers of participants by ethnicity. There was a gender ratio of 4-to-1 women to men; women 80%, n = 82 female participants, men 20%, n = 21 male participants. Four of the 103 participants did not provide ethnic information. Of the 99 participants who provided ethnic information, illustrated on Figure 2, the majority of the participants were Caucasian, 77%, n = 76 participants. The next largest group was African American, 12%, n = 12 participants. The remaining ethnicities were each represented by four or fewer participants. 6 Marital Status Figure 3. Numbers of participants by marital status. Figure 3 illustrates the participants by marital status. Half were married, 50%, n = 51 participants. Approximately half were single, 41%, n = 42. Ten participants labeled their marital status as something other than married or single, 10%. 7 Age and Time with Organization & Manager Average age: early 40’s M = 43.38 years old, SD = 13.13, min = 21 years, max = 70 years Average 10 years working for current organization M = 9.84 years, SD = 8.02, min = 1 year, max = 31 years
- 6. Average 5 years working for current manager M = 4.87 years, SD = 5.48, min = 1 year, max = 30 years Participants were in their early 40’s on average, M = 43.38 years old, SD = 13.13, but represented a broad range of ages, min = 21 years, max = 70 years. They had been working for their current organization nearly ten years on average, M = 9.84 years, SD = 8.02, though again represented a broad range of time on the current job, min = 1 year, max = 31 years. They had worked for their current manager about half as long as they had been employed by the organization, M = 4.87 years, SD = 5.48. They again, however, reported a broad range, min = 1 year, max = 30 years. 8 Human Services Education vs Experience Chi-square H0: The association between human services degrees and professional background in human services was not statistically significant. Association significant, X2 (1, 102) = 9.53, p = .002; null rejected Figure 4. Cross-tabulation between human services degree held (yes or no) and manager’s professional background in human services (yes or no). Each participant was a member of one of two groups: those whose managers held a human services degree and those whose managers did not hold a human services degree. Participants were also asked on the survey whether or not their manager’s professional background included human services experience,
- 7. regardless of formal education. Figure 4 shows the cross-tabulation of human services degrees (formal education) and professional background (direct experience) among managers. In total, 28 managers held human services degrees. All 28 of them had a professional background in human services as well. The other 74 managers did not hold a human services degree. In a 2-to-1 ratio, twice as many non- degree-holding managers had professional backgrounds in human services as did not have professional backgrounds in human services. A chi-square test was run to determine whether the association between holding a human services degree and having a professional human services background was statistically significant. The hypotheses were: H0: The association between human services degrees and professional background in human services was not statistically significant. H1: The association between human services degrees and professional background in human services was statistically significant. Results of the chi-square indicated that the association between human services degrees and professional background in human services was statistically significant, X2 (1, 102) = 9.53, p = .002, Φ = .33, p = .001. The null hypothesis was rejected. Adjusted residuals, listed on Table 1, showed that there were significantly fewer degree holders without human services backgrounds than expected but also significantly more non- degree-holders without human services backgrounds than expected. 9 Descriptive Statistics for Summated Scales and Managerial Effectiveness “somewhat agree” to “agree”
- 8. “moderate to maximal” Table 2 Descriptive Statistics for Summated Scales and Managerial Effectiveness Descriptive Statistics for Summated Scales and Managerial Effectiveness Recall that the Likert scale of agreement used to measure the three leadership behaviors of interest (aims or goals emphasis; personal backing; and work easing or facilitation) had a 7-point scale (1 = strongly disagree, 7 = strongly agree). Also recall that summated scale scores were the means of each participant’s responses to conceptually-related items. Table 2 shows the descriptive statistics for the three summated scales and a measure of manager effectiveness. Means for all three summated scales fell between 5 and 6 in value. Scores between 5 and 6 reflect responses between “somewhat agree” to “agree.” The minimum score for all three summated scales was one, indicating that at least participant strongly disagreed with all of the survey items used to measure a particular summated scale. Alternatively, the maximum score for all three summated scales was 7, indicating that at least one participant strongly agreed with all of the survey items used to measure a particular summated scale. The fourth measure whose descriptive statistics are listed on Table 2 summarizes overall managerial effectiveness. These data emerged from responses to the survey question, “How effective is your manager? Pleases choose one number between 1 and 10, with 1 = not at all effective, 10 = maximally effective.” On average, participants rated managerial effectiveness between 7 and 8, indicating that average perceptions were that managerial effectiveness fell between moderate and maximal.
- 9. 10 Aims Emphasis SS Personal Backing SS Work Easing SS Managerial Effectiveness 5.59 5.31 5.46 7.64 Correlations V1V2V3V4V5V6V7V1 Personal Backing SS.82**.84**.71**.13-.06-.06V2 Aims Emphasis SS.71**.86**.75**.14-.02-.07V3 Work Easing SS.84**.92**.81**.19-.05-.02V4 Managerial Effectiveness.71**.69**.77**.08.02.01V5 Years w Current Manager.21.19.16.15.59**.45**V6 Year w Current Organization-.20-.18-.23-.20.66**.48**V7 Age-.03-.09- .04.04.35.43* Correlations This section shows the results of inspecting correlations to look for covariates and sufficient correlations among dependent variables to establish the analytical approach to answering RQs 1-3. The analytical plan was based on correlations: analyze RQs 1-3 with separate independent t tests in the absence of covariates; analyze RQs 1-3 with 1x2 ANCOVA tests in the presence of covariates; analyze RQs 1-3 with a MANOVA test if the dependent variables (leadership behaviors: aims or goals emphasis; personal backing; and work easing or facilitation) were sufficiently correlated; or analyze RQs 1-3 with a MANCOVA test the dependent variables were sufficiently correlated and there were covariates. The patterns of the correlations among participants whose managers did and did not hold a human services degree are shown on Table 3. Correlations above the diagonal reflect managers without human services degrees, n = 73-75 participants. Correlations below the diagonal reflect managers with human services degrees, n = 27-28 participants. The patterns across the two groups were identical. Four
- 10. patterns emerged. One, all three summated scales (V1, V2, and V3) were strongly and positively correlated to each other. This justified a MANOVA test. Two, all three summated scales (V1, V2, and V3) were also strongly and positively correlated with the numeric estimate of the manager’s overall effectiveness (V4). This justified a MANCOVA test. Three, there were strong and positive correlations between the years spent working for the current manager, years spent working for the current human services organization, and the participant’s age (V5, V6, and V7) . Four, these three demographic variables (V5, V6, and V7) did not correlate significantly with the summated scales (V1, V2, and V3) or managerial effectiveness (V4). These demographic variables were therefore not used as covariates. 11 Results for Research Questions 1-3 MANCOVA test addressed 3 RQs at once in a single analysis Covariate H0: Managerial effectiveness was not a significant covariate. Managerial effectiveness significant covariate, Wilks Lambda = .35, F(3, 96) = 60.29, p < .001; null rejected Multivariate H0: The difference in the linear combination of the three leadership behaviors of interest between managers with and without human services degrees was not statistically significant. Group difference in leadership not statistically significant, Wilks Lambda = .99, F(3, 96) = 0.37, p = .775, null retained Results for Research Questions 1-3 Correlations listed on Table 3 justified a MANCOVA test that addressed all three research questions at once in a single analysis. This section presents those results. RQ1 was, Is there a difference in aims or goals emphasis, as a leadership behavior,
- 11. between non-profit human services managers with and without human services degrees? RQ2 was, Is there a difference in personal backing, as a leadership behavior, between non-profit human services managers with and without human services degrees? RQ3 was, Is there a difference in work easing or facilitation, as a leadership behavior, between non-profit human services managers with and without human services degrees? In the MANCOVA, the covariate was the managerial effectiveness. The independent variable was human services degree, with two levels (yes, manager held a human services degree; no, manager did not hold a human services degree). The multivariate dependent variable was the linear combination of the three leadership behaviors of interest (aims or goals emphasis; personal backing; and work easing or facilitation). MANCOVA first tests a set of multivariate hypotheses. The multivariate hypotheses were: Covariate H0: Managerial effectiveness was not a significant covariate. Covariate H1: Managerial effectiveness was a significant covariate. Multivariate H0: The difference in the linear combination of the three leadership behaviors of interest between managers with and without human services degrees was not statistically significant. Multivariate H1: The difference in the linear combination of the three leadership behaviors of interest between managers with and without human services degrees was statistically significant. The data met the assumption of equality of covariance matrices, Box’s M = 16.44, F(6, 16609) = 2.62, p = .021. The data also met the assumption of equality of error variances, Aims Emphasis SS Levene’s F(1, 99) = 0.52, p = .474; Personal Backing SS Levene’s F(1, 99) = 0.12, p = .735; Work Easing SS Levene’s F(1, 99) = 0.95, p = .331. Results of the multivariate portion of the MANCOVA showed that the managerial effectiveness was a significant
- 12. covariate, Wilks Lambda = .35, F(3, 96) = 60.29, p < .001; the covariate null hypothesis was rejected. The impact of the overall managerial effectiveness was very strong, partial eta2 = .65. When the impact of the overall managerial effectiveness was factored out, the difference in the linear combination of the three leadership behaviors of interest between managers with and without human services degrees was not statistically significant, Wilks Lambda = .99, F(3, 96) = 0.37, p = .775. The multivariate null hypothesis was retained. 12 Group Difference in Aims Emphasis Impact of human services degree very strong, partial eta2 = .45 NO YES Figure 5. Mean Aims Emphasis SS across managers with and without a human services degree. Figure 5 illustrates mean ratings for Aims Emphasis across the two groups. The average rating for the Aims Emphasis SS was slightly higher among managers who held human services degrees, M = 5.91, SD = 0.98, than it was among managers who did not hold human services degrees, M = 5.45, SD = 1.27. Although the difference in means was non-significant, as per the MANCOVA results, the impact of human services degrees on this dimension of leadership was very strong, partial eta2 = .45. 13 Group Difference in Personal Backing
- 13. Impact of human services degree very strong, partial eta2 = .50 NO YES Figure 6. Mean Personal Backing SS across managers with and without a human services degree. Figure 6 illustrates mean ratings for Personal Backing across the two groups. The average rating for the Personal Backing SS was slightly higher among managers who held human service degrees, M = 5.71, SD = 1.40, than it was among managers who did not hold human services degrees, M = 5.15, SD = 1.45. Although the difference in means was non-significant, as per the MANCOVA results, the impact of human services degrees on this dimension of leadership was very strong, partial eta2 = .50. 14 Group Difference in Work Easing Impact of human services degree very strong, partial eta2 = .42 NO YES Figure 7. Mean Work Easing SS across managers with and without a human services degree. Figure 7 illustrates mean ratings for Work Easing across the two groups. The average rating for the Work Easing SS was slightly higher among managers who held human services degrees, M = 5.79, SD = 1.28, than it was among managers who did not hold human services degrees, M = 5.30, SD = 1.49. Although the
- 14. difference in means was non-significant, as per the MANCOVA results, the impact of human services degrees on this dimension of leadership was very strong, partial eta2 = .42. 15 Ideal Non-profit Leadership Authoritarian: Leaders who have an authoritarian management style have a high concern for task and little concern for people. Compromise management: Leaders who have a compromise management style have a moderate concern for tasks and a moderate concern for people. Transformational leadership: Leaders who have a transformational management style are involved with feelings, morals, values, and long–term goals. Situational leadership: Leaders who have a situational leadership management style are rooted in the communication of relationship activities and task activities, in addition to employees’ willingness or maturity in favor of performing a particular task. Finally, participants were asked to identify the ideal non- profit leadership by choosing from an array of four leadership styles on two survey questions, defined as follows. Authoritarian: Leaders who have an authoritarian management style have a high concern for task and little concern for people. Compromise management: Leaders who have a compromise management style have a moderate concern for tasks and a moderate concern for people. This kind of manager attempts to stabilize the importance of completing the task while connecting to the subordinates and keeping them pleased since the team is usually effective and they get along with the manager. Compromise managers are capable to eliciting respect from subordinates because they listen to and incorporate subordinates’ ideas. Transformational leadership: Leaders who
- 15. have a transformational management style are involved with feelings, morals, values, and long–term goals. Situational leadership: Leaders who have a situational leadership management style are rooted in the communication of relationship activities and task activities, in addition to employees’ willingness or maturity in favor of performing a particular task. Responses to the two survey questions were parsed out by group (human services managers with and without human services degrees) to see if and how they differed. 16 Ideal Leadership Style for a Non-Profit Manager Non-significant, X2 (2, 102) = 1.22, p = .543, Cramer’s V = .11; null retained Figure 8. Percentages of participants in three ideal manager leadership styles. Ideal Leadership Style for a Non-Profit Manager One of the two survey questions was, “What is the ideal leadership style for a non-profit manager?” Figure 8 illustrates the percentages of participants in the two groups across ideal manager leadership styles. Table 4 lists the percentages and corresponding numbers of participants. The majority of both types of participants (i.e., whose managers did or did not hold a human services degree) identified compromise management as the ideal leadership style for non-profit managers (see Table 4). The type of style that garnered the next highest percentage of votes in both groups was transformational leadership. Finally, Figure 8 and Table 4 show that situational leadership garnered the fewest votes. No
- 16. one identified authoritarian leadership as the ideal style for non-profit managers. Table 4 shows that the percentages of participants who voted for the three leadership styles were close in value but not identical. A chi-square test of independence was therefore run to see if the percentages of votes for the ideal leadership style differed by testing the significance of the association between the cross-tabulated variables. The hypotheses were: H0: The association between participant type (manager did or did not hold a human services degree) and preferences for the ideal non-profit manager leadership style was not statistically significant. H1: The association between participant type (manager did or did not hold a human services degree) and preferences for the ideal non-profit manager leadership style was statistically significant. Results of the chi-square showed that the association between participant type (manager did or did not hold a human services degree) and preferences for the ideal non-profit manager leadership style was not statistically significant, X2 (2, 102) = 1.22, p = .543, Cramer’s V = .11. The null hypothesis was retained. 17 Best Leadership Style for a Non-profit Organization Non-significant, X2 (3, 103) = 4.58, p = .205, Cramer’s V = .21; null retained Figure 9. Percentages of participants in four ideal leadership types for non-profit organizations.
- 17. Best Leadership Style for a Non-profit Organization The other survey question was, “Which leadership style is the best for a non-profit organization? Figure 9 illustrates the percentages of participants in the two groups across four ideal manager leadership styles. Table 4 lists the percentages and corresponding numbers of participants. Figure 9 shows that one person in the group whose managers did not hold a human services degree choose authoritarian for the ideal leadership type of non-profit organizations. Otherwise, the majority of both types of participants (i.e., whose managers did or did not hold a human services degree) said that compromise management was the ideal leadership type for non-profit organizations (see Table 4). That was followed by transformational leadership. Finally, Figure 9 and Table 4 show that situational leadership garnered the fewer votes and authoritarian leadership only one vote. Table 4 again shows that the percentages of participants who voted for the four leadership type were somewhat close in value but not identical. A chi-square test of independence was again run to see if the percentages of votes differed. The hypotheses were: H0: The association between participant type (manager did or did not hold a human services degree) and preferences for the ideal leadership type for non-profit organizations was not statistically significant. H1: The association between participant type (manager did or did not hold a human services degree) and preferences for the ideal leadership type for non-profit organizations was statistically significant. Results of the chi-square showed that the association between participant type (manager did or did not hold a human services degree) and preferences for the ideal leadership type for non-profit organizations was not statistically significant, X2 (3, 103) = 4.58, p = .205, Cramer’s V = .21. The null hypothesis was retained.
- 18. 18 ix CHAPTER FIVE: RESULTS: DISCUSSION, IMPLICATIONS, RECOMMENDATIONS Contents Introduction iii Discussion v Limitations vii Implications viii Recommendations ix Research Question 1 (RQ1) ix Research Question 2 (RQ2) ix Research Question 3 (RQ3) x Conclusion x References xi
- 19. Purpose The purpose of this research was to determine employee perspectives of the leadership behaviors of human services managers within a nonprofit human services organization. Specifically, this study aimed to understand the impact of leadership style on employees in human services organization located in the northeastern United States. This quantitative study was conducted by administering an online survey viaSurvey Monkey to workers who give direct care in a nonprofit human services organization. A survey was disseminated to gauge if there is a correlation or dissimilarity in the leadership of managers who have didactic and professional backgrounds in human services versus those who have backgrounds in non-human services. Out of 500 potential participants a power analysis was conducted on the GPower website calculated that 102 surveys were needed to find a medium effect, however 113 was filled out. Of those, 10 participants failed to provide information on their managerial educational background, leadership style or both. They were eliminated, so there were 103 surveys completed. The results of the data study demonstrated that there was onesignificantcorrelation flanked by education.
- 20. The reason of selecting 500 participants is to make the effective quantitative analysis while at the sampling, the best selected samples are selected as the survey has been done by using the online portal in which some of the employees provide the accurate information and the other employees may not take the survey serious. Overall the survey provides the complete details and the benefits of leadership in organizations. SummaryofStudy Success of an organization is based on the leadership behavior as the workflow of an organization is based on the performances of the employees. Leaders of an organization should have leadership skills so that they will be able to manage the pre- consequences for the outcomes of the work. This research is totally based on the perspective of employees about the leadership as the selected technique is quantitative because more employees can provide more effective information about the leadership at the specific organization. Previous researchers have described that the leadership behavior is based on the performance of an employee but somehow, if the behavior of leader is appropriate with the employees, the performance of the employees will be more better because when a leader appreciate an employee, the motivation level of employee gets very high so that they can do their tasks with best effort (C. Raddats and J. Burton, 2011). This research will provide the framework based on the results that how the leaders should behave with the employees in the good or bad situation because ups and downs are the part of any business but if the leaders are strong, the outcomes will be positive. At some stages the leaders should be able to take the strong decisions for the better performance and in case if any employee is not performing well, leader should motivate that specific employee to boost up the performance of the employee. The research information and the techniques have been described in the chapter entirely to ensure that how this research can be more useful and effective for the leaders. The first chapter served to give the framework that was
- 21. essential to understanding the impact that leadership qualities has on employees in human service organizations. This study intent was to identify management factors that could improve the functioning of a nonprofit human services organization. The rising consciousness that leadership qualities are lacking in managers of nonprofit human services organizations developed into the notion of this study. The research presently obtainable is either focused, on leadership qualities in companies of profit, many but there were restricted studies in leadership qualities in nonprofit organizations. Within reviewing countless studies seeking to pinpoint the leadership qualities of individuals in supervisory positions within human service organizations, the canvasser determined where a hold in the current literature existed. This after that developed into a research inquiry that sounds interesting and quantifiable: Which three activities (personal backing, aim emphasis, and work easing) do human service managers process and what essential qualities are they deficient? The hypothesis was guided from three research question. They correspondto the three leadership behaviors of interest (aims emphasis; personal backing and work easing). The hypothesissought to ascertain how these variableshave to do with one another and influence leadership behaviors. Hypothesis one compared those with degrees, human services managers with human service degrees or preceding background process more emphasis on goals. Hypothesis two compared those with human service degrees human service managers with no degrees and only human services experience process more emphasis on personal backing. Hypothesis three compared those with no human services degrees or preceding background process the same emphasis on work easing. Therefore, the following hypothesis was bases on the research question. The second chapterpresented current review of leadership studies and practices, it also assesses the review of human services management and organizational ethos because it will refer to the data analysis that can only be useful to
- 22. organizations in the human services arena. Discussion of leadership is detailed since it is imperative the success of any organization. An extensive analysis of leadership perceptions was presented since it formed the shaping of how leadership skills affect employees. Leadership adds to the organizations place of self- worth, employee burnout, and gets the most out of individual promise and then better meets the goals of the organization (Glisson,1989). The third chapter explained the design of the study including the utilization of a survey instrument, the company and administrationof the instrument as well as the compulsory sample size required to acquire accuracy. The approach for collecting data was discussed including where the survey would be conducted and how many rejoinders were needed to make certain the results were precise. The chapter as well specified the questions being utilized within the survey and made clear how each hypothesis would be addressed. The methodology for data analysis was as well was roofed in Chapter 3. It was concluded that two -group analysis will be used t- tests, ANOVA. ANCOVA, MANOVA, or MANOVA tests to ascertain the relationship amongst the variables of leadership behaviors: aims emphasis; personal backing; and work easing. The fourth chapter presented the analysis of the data that was acquired utilizing the survey instrument. The data that was gathered was the use of a questionnaire and was presented on a question- by question basis. With the statistical verdicts of each overviewed and structured. As well, any correlations among variables were reconnoitered using correlations, chi-squares, and multivariate analysis of covariance (MANCOVA). The hypotheses were reviewed using the MANOVA determined if conclusions might be drawn on the legality of each hypotheses. All hypotheses were reconnoitered, the matching data was offered, and suitable suppositions made clear. Also, Chi-Square analysis was used to examine demographic variables pertaining to the managers’ background in human service. The meticulous results of the survey are conferred within segment 5.4.
- 23. Discussion and Conclusions The effectiveness of research is very important because the selected topic is directly interacted with the project success. Employees are the most important part of an organization as the whole workflow is dependent of the employees as if the performance is appropriate, the business or an organization will be successful. Leadership factors are necessary to integrate with the organization because there are small teams in every organization and each team has been managed by a leader. Leadership interaction with the employees defines the consequence of the task or a project whereas the behavior of the leader at the workplace is also very important in the organizational success. The conducted research is the result provider about the employee’s perspective about the behavior of leadership (Helgesen, 2005). In organizational leadership, there are two major things on which we focus appropriately. First is about employer’s focus in organizational important consequences in which the employees use to arrange their interpersonal behavior regarding their organization. Secondly, employee focuses on his/her perceptions which are really necessary for the employer’s development. So that he can percept several consequences about their organization Organizational Leadership have some dimension which describe the influence in the social behavior. Where an employee can built a good social circle and interactions with other people so that can effect there interpersonal skills which can also lead them toward Leader Political Skills which will be very useful for the management purpose of an organization. Another important constraint for employee, that he/she has to control or has to come up on the emotional exhaustion so that he can implement the work inn organizational appropriately. Organizational regulations are usually violated with the behavior of an individual that may affect their organization as well as its citizen. The organizational management can make some negative deviance whereas effect will be on financial
- 24. well-being of organization which may contain a big loss of the organization. Positive deviance is the behavior which an organization does not authorize until unless that behavior help the organization to achieved their targets and goals .If positive deviance can help in these sequential purpose , organization can give that behavior a title of the innovative behavior with dysfunctional derivatives .Negative deviance occur in an organization because of absenteeism and workload on the employees ,this actually create negative behavior among employees which can affect the desire target of an organization either its profit or loss .Organization has to face it very well otherwise it will be really harmful for the organization (J. M. Birkinshaw and A. J. Morrision, 1995). When ethical environment of any organization is good, the perception of employees depends the management if the environment provided to employees is better than positive deviance will be mentioned as an innovative behavior otherwise negative behavior will definitely effect on the organizational behavior. In any organization leadership tactics influences is also the major category which may create an ethical and pure political environment by which we vividly gleam the ligations of an article development. Influence tactics may distribute the workload of an employee or may be increase the workload. That totally depends upon the numbers of tactics which are given by management system. Results The purpose of the study was to determine which three leadership behaviors (personal backing, aim emphasis, and work easing) do human service managers process and what essential qualities are they deficient? There are three associated hypotheses acquired from this question and they are as followed: Research Question 1 (RQ1): Is there a difference in aims emphasis, as a leadership behavior between non-profit human services managers with or without human services degrees? Two survey items measured the
- 25. leadership dimension of “aims emphasis.” Research Question 2 (RQ2) Is there a difference in personal backing, as leadership behavior, between non-profit human services managers with and without human services degrees? Three survey items measured the leadership dimension of “personal backing.” Research Question 3 (RQ3) Is there a difference in work easing, as leadership behavior between non- profit human services managers with or without human services degrees? Four items measured the leadership dimension of “work easing”. All three research questions were address at once in a single analysis by using the MANCOVA test. Holding a human degree did not seem to increase the manager’s effectiveness. However, valuable information was gained. One that manager’s overall effectiveness matched their effectiveness in three individual dimensions of leadership: aims emphasis; personal backing; and work easing. The MANCOVA results argued that the related dependent variables (aims emphasis; personal backing and work easing) do not represent a conceptually distinct outcome: effectiveness. An effectiveness rating on a scale of 1-10 should be conducted. Another was that differences between managers with and without degrees disappeared when the overall effectiveness was factor out, but there were differences between the means that showed that managers with degrees are better at aims emphasis: personal backing; and work easing therefore future research should be proposed to discover what managers without human services degrees and or professional backgrounds do to make up for their deficits.Limitations As compared to the previous researches, this research is much optimized because the technique is quantitative, and the selected organization is having several experiences so that the employees provided the information which will be effective while concluding the research. Leaders in an organization should have to be mentally strong to face the issues as well as
- 26. the management of the employees will also be considered as the major factor. In several researches, the focus was based on the individual leadership in which the suggestions were appropriate but as an organization, the employee’s feedback is necessary because employees will be having the complete interaction with the leadership as well as the workplace. The leaders should initially analyze the current environment of the organization so that they will be able to manage the workflow within the premises of an organization. This research provides the strategy to the leaders who will be having the departments to manage, as the framework defined the issues which can be overcome and the constraints which should be followed by a leader in the organization (Mintzberg, 1980). The limitation of the research is based on the limited survey as it has been mentioned above that the selected participant were 500 while the large scale research can provide the more effective results but the conducted research is for SME(Small and medium enterprises) as most of the leadership issues are existing in the medium and small level organizations, So the limitations , can be overcome by making the research on large enterprises for the quality and assurance and the authentic information. Therefore, the results of this research are pertinent to a human service organization in this region. Nonetheless, this ought to be considered when applying the results to other human service organizations that do notfit into this profile (Airman- Smith &Markham, 2004). The limitations of the research encompass the geographical area wherein the study was conducted, the number of surveys taken delivery of, and only one organization was involved in the research. Therefore, the results of the research are pertinent to nonprofit human services organizations in this region. Yet, this ought to be pondered when applying the upshots to other nonprofit human services that do not match the profile (Airman- Smith &Markham, 2004). One organization agreed to be involved in the study. Even though the organization was one of the biggest in the state of
- 27. Massachusetts, it allowed for a comparatively small number of managers to be rated based upon the perceptions of their employees. So, the limitations can be overcome by making the research on larger enterprises for the quality assurance and the authentic informationImplications Impact of leadership on the employee’s behavior is also the concern of the research as the employees also follow the leader’s behavior as most of the organizations are based on the institutes where the employees learn the leadership skills from their leaders. Whereas some employees are having appropriate sense of leadership so that they would get to know that how to deal with the leaders. Leaders should not be very linnet because sometimes the strictness is necessary to achieve the current goals of organization as well as the market. Research have shown that the leaders should have to play a neutral role but sometimes the hard decision makings can help the leaders in the career. The worldwide administration aptitudes of conduct intricacy and stewardship improvement that add to corporate reputational capital are key immaterial assets that use practical upper hand in the 21st century. Two exercises at the firm-and industry-level on the effect of insufficient worldwide administration and squandered reputational capital are inspected. Four administrations rehearse for enhancing key aggressiveness is given: worldwide authority abilities, official oversight duties regarding worldwide corporate notoriety, a yearly worldwide reputational review, and worldwide honors and rankings to concentrate energy on the key elusive assets for maintainable upper hand in the 21st century. An investigation of current administration hypothesis is displayed, alongside a synopsis of the significant writing discoveries. Accentuation is set on giving thoughts which have functional rather than hypothetical application. A sub-subject in the article is that authority aptitudes can be learned or educated, and the composition challenges organizations to actualize
- 28. initiative improvement programs. Recommendations The selected topic of the research is considered as the most critical topic because most of the small and medium enterprises are facing loss due to lack of leadership skills. The management of those organizations should have to conduct the awareness session about the leadership skills where the employees and the leaders would get to know that how to deal in the situation of the pressure in an organization because most of the issues exists due to lack of pressure handling in an organization.Conclusion The information about the complete framework of the leadership behavior has been described in the chapter as the research samples has been analyzed and described in the report for the appropriate quality of the research. Quantitative analysis has been discussed in the report for the better implication and for the effective results of the leadership in the modern era. The knowledge has been described that the leadership skills are the important factor in the organizational success. These findings can be utilized by present nonprofit human services organizations to further build on their managers. The findings can also be utilized by canvassers to build on further studies that continue to address the changing aspects of leadership in nonprofit human services organizations. References C. Raddats and J. Burton. (2011). Strategy and structure configurations for services within product-centric businesses. Journal of Service Management, vol. 22(4), 522-539. Helgesen, S. (2005). The Web of Inclusion: Architecture for Building Great Organizations. Washington, D.C.: Beard Books. J. M. Birkinshaw and A. J. Morrision. (1995). Configurations of Stratgey and Structure in Subsidiaries of Multinational Corporations. Journal of International Business Studies, 729- 753. Mintzberg, H. (1980). Structure in 5's: A Synthesis of the Research on Organization Design. Management Science, vol.
- 29. 26(3), 322-341. 67 CHAPTER FOUR: RESULTS The purpose of this research was to study employee perspectives of the leadership style of managers within nonprofit institutions. Specifically, this study aimed to understand the impact of leadership style on employees in human services organizations located in the northeastern United States. The study was a two-group design. Two groups of employees were compared on the quality of leadership between their managers, differentiated by managers who hold human services degrees and managers who do not hold human services degrees. Quality of leadership was measured as three specific leadership behaviors (aims or goals emphasis; personal backing; and work easing or facilitation). The intent was to identify management factors that could improve the functioning of a human services organization. This results chapter is divided into six sections. The first section lists the research questions. The second section briefly describes data screening, reliability, summated scales, and statistical tests used to analyze the data. The third section presents the participants’ demographic characteristics. The fourth section presents descriptive statistics for summated scales and managerial effectiveness along with correlations for identifying the analytical approach to address the research questions. The fifth section presents results for Research Questions 1, 2, and 3. The sixth and final section is the summary. Research Questions This study was guided by three research questions. They correspond to the three leadership behaviors of interest (aims or goals emphasis; personal backing; and work easing or
- 30. facilitation). Associated hypotheses are listed in sections that present the results for the research questions. Research Question 1 (RQ1) Is there a difference in aims or goals emphasis, as a leadership behavior, between non-profit human services managers with and without human services degrees? Research Question 2 (RQ2) Is there a difference in personal backing, as a leadership behavior, between non-profit human services managers with and without human services degrees? Research Question 3 (RQ3) Is there a difference in work easing or facilitation, as a leadership behavior, between non-profit human services managers with and without human services degrees? Data Screening, Reliability, Summated Scales, and Statistical Tests This section briefly describes data screening, testing the reliability or internal consistency of the data, generating summated scales, and statistical tests used to analyze the data. Statistical tests were chi-squares, correlations, and multivariate analysis of covariance (MANCOVA). Data Screening All data were initially screened for entry errors and missing data points. The data were collected on the online survey site SurveyMonkey.com, so there were not any entry errors. There was a small number of missing data points, but these did not show any systematic pattern, although the number of participants in various analyses (n’s) tended to vary slightly. Likert-scaled responses were screened for normality, linearity, homoscedasticity, and outliers to determine if they could be treated as continuous data (Hair, Black, Babin, Anderson, & Tatham, 2010). Following Warner (2013), the decision was made ahead of time to retain outliers because they reflect the working reality of human services organizations and the goal of this research was to understand the reality of human services organizations better. Low scores emerged as low outliers in all
- 31. three leadership behaviors of interest (aims or goals emphasis; personal backing; and work easing or facilitation; described below) but the data did not otherwise show any substantial departures from statistical normality. Likert-scaled data were therefore treated as continuous data and examined with parametric inferential statistical tests to examine group differences. Percentages were rounded off to whole numbers and may not add up to precisely 100%. Data were analyzed with SPSS v 25, which is dedicated statistical software. Statistical significance was set at alpha = .050. Reliability Reliability statistics (i.e., internal consistency) were run on conceptually-similar survey items with Cronbach’s alpha for the three leadership behaviors of interest (aims or goals emphasis; personal backing; and work easing or facilitation). Cronbach’s alpha statistics range in value from 0 to 1. The closer Cronbach’s alpha is to 1, the greater the reliability of the database. Indices of .70 or higher reflect an adequately reliable database (Gliner & Morgan, 2000). Summated Scale Scores A summated scale was generated for each of the three leadership behaviors of interest (aims or goals emphasis; personal backing; and work easing or facilitation). A summated scale is a single empirical measure that represents multiple aspects of a construct in one variable (Hair et al., 2010). Deriving a single measure from several related aspects decreases the measurement error in the original data points, which increases data reliability and validity as well as parsimony in the overall number of variables (Hair et al., 2010). Because each summated score was a mean, its possible values ranged 1 – 7 (1 = strongly disagree, 7 = strongly agree) like the Likert scale used to measure responses to survey items. Aims emphasis. Two survey items measured the leadership dimension of “aims emphasis.” An example of a survey item
- 32. that measured aims emphasis is: “My manager makes sure subordinates have clear goals to achieve.” Internal consistency was high, Cronbach’s alpha = .74. Because of high internal consistency, a summated scale (SS) was generated, using the mean response of the related items. It is hereafter called the Aims Emphasis SS. Personal backing. Three survey items measured the leadership dimension of “personal backing.” An example of a survey item that measured personal backing is: “My manager is concerned about his/her subordinates as people.” Cronbach’s alpha showed that internal consistency was high, alpha = .84. Because of high internal consistency, a summated scale (SS) was generated, using the mean response of the related items. It is hereafter called the Personal Backing SS. Work easing. Four items measured the leadership dimension of “work easing.” An example of a survey item that measured work easing is: “My manager helps his/her subordinates solve work- related problems.” Cronbach’s alpha showed that internal consistency was high, alpha = .94. Because of high internal consistency, a summated scale (SS) was generated, using the mean response of the related items. It is hereafter called the Work Easing SS. Chi-square Test of Independence A chi-square test of independence was used to examine demographic variables pertaining to managers’ backgrounds in human services. Chi-square tests set up categorical data in cross-tabulated tables. Data are analyzed by comparing the actual number of participants in the database that fall into a specific category (observed frequencies or counts) to the number of participants that would be expected by chance (expected frequencies or counts, Siegel & Castellan, 1988). The Yates correction was applied because the data formed a 2 x 2 table, and the correction reduces the observed-expected difference by half a point so that it fits chi-square distributions more accurately. The overall chi-square statistic indicates whether the observed counts differ significantly or non-
- 33. significantly from counts expected by chance. For significant chi-square statistics, individual pairs of observed and expected frequencies are then inspected for statistical significance by transforming observed/expected differences into z scores called adjusted residuals. Statistically significant relationships are revealed by adjusted residuals that are ±1.96 (Siegel & Castellan, 1988). Pearson’s Correlations Correlations were used to examine the data for covariates. Correlations were Pearson product-moment correlations. They were interpreted categorically following Cohen (1988, p. 79- 81): small effect r = .10; medium effect r = .30; large effect r = .50. These are zero-order correlations in which the effects of other associated variables are not taken into account. It is generally recommended that sample sizes be at least N = 100 when correlations are used, partly to have adequate statistical power and partly to minimize the effect of extreme outliers (Warner, 2013). The data set in the current study met Warner’s criterion. MANCOVA Test Research questions 1-3 were addressed with a version of the MANOVA test called a MANCOVA. MANOVA is an acronym for multivariate analysis of variance. Like all ANOVA tests, this test is designed to test the statistical significance of group differences (Hair et al., 2010). However, unlike ANOVA tests, MANOVA tests are multivariate tests that examine two or more related dependent variables simultaneously. In the current study, the related dependent variables there were examined simultaneously were the three leadership behaviors of interest (aims or goals emphasis; personal backing; and work easing or facilitation). In contrast, ANOVA tests are univariate tests because each only examines one dependent variable at a time. MANOVA is preferred over several separate ANOVAs for several reasons (Hair et al., 2010; Warner, 2013). Complex phenomena, such as leadership style in human services
- 34. organizations in the current study, are more accurate when measured in multiple ways because it can be very challenging to obtain accurate measures of a complex phenomenon from a single measure of it. MANOVA results can be more informative than a series of univariate ANOVA tests because MANOVA takes intercorrelations among the dependent variables into account by treating them in combination. The MANOVA calculations create a new dependent variable that is the linear combination of the original dependent variables which maximizes group differences; it is called the multivariate dependent variable. The advantage is that a multivariate dependent variable may reveal differences that individual ANOVA tests cannot show. For example, the MANOVA may establish that related dependent variables each represent a conceptually distinct and independent outcome or intercorrelations suggest they represent multiple measures of one conceptually distinct outcome. Finally, group differences may only emerge when the outcome of two or more dependent variables is considered jointly. MANOVA yields more output than ANOVA because it is more complex and has up to three steps. In Step 1, the overall multivariate hypothesis is tested. The most commonly used test statistic to evaluate the significance of this hypothesis is Wilks Lambda (λ), a measure of the within-groups variance divided by the total variance. Lambda ranges in value from 0 to 1 so the smaller the value of Lambda, the greater the evidence of group differences. If the multivariate null hypothesis is retained, the convention is to stop the analysis at this point and conclude that the intervention (in the current study, whether or not a manager held a human services degree) had no effect (in the current study, on different dimensions of leadership). Effect sizes are measured with partial eta squared (partial η2), which is the amount of variance in the dependent variable that is explained by the corresponding independent variable (i.e., group membership, Warner, 2013). When the overall multivariate test is statistically significant,
- 35. Step 2 is to undertake a series of univariate ANOVAs to identify the dependent variable(s) affected by the intervention. A Bonferroni-like adjustment is applied to maintain the risk of a Type I error at the original alpha level. In Step 3, any univariate test of a dependent variable that results in statistical significance is followed by planned comparisons to identify specific differences with Tukey’s tests, when there are more than two levels of the independent variable. In the current study, research questions 1-3 were addressed with a multivariate analysis of covariance or MANCOVA. MANCOVAs are MANOVAs with the addition of covariates. Covariates are variables that correlate with the dependent variable. The question is whether the covariate influences the dependent variable such that it misleads researchers about differences in the dependent variable from main or interaction affects. MANCOVA first determines if there is a significant covariate effect. If so, it removes the influence of the covariate statistically and then compares the remaining variance in the dependent variable to reveal statistically significant independent variables. In the current study, an overall measure of manager effectiveness was the covariate. Demographic Characteristics This section presents demographic variables and characterizes the modal participant. A total of 113 individuals completed surveys. Of those, 10 participants (cases 4, 14, 20, 21, 33, 45, 62, 78, 101, 105) failed to provide information on their managerial educational background, leadership style, or both. They were eliminated from further analyses, N = 103 participants. The demographic results in this section show that the modal participant was a married Caucasian woman in her 40s who had worked for her current organization for ten years and for her current manager for five years. There were three times as many participants whose managers did not hold human service degrees, n = 75 participants, 73%, as participants who managers held human
- 36. services degrees, n = 28 participants, 28%. The 3-to-1 ratio of non-degree-holders to degree-holders is illustrated on Figure 1. [Sharon, comment in chapter 5 about this 3-1 ratio: is this correct in general for human services organizations such as the ones you sampled? Is there any industry trend toward changing this by requiring managers to have the pertinent degrees?] Figure 1. Numbers of participants by human services degrees. There was a gender ratio of 4-to-1 women to men; women 80%, n = 82 female participants, men 20%, n = 21 male participants. Four of the 103 participants did not provide ethnic information. Of the 99 participants who provided ethnic information, illustrated on Figure 2, the majority of the participants were Caucasian, 77%, n = 76 participants. The next largest group was African American, 12%, n = 12 participants. The remaining ethnicities were each represented by four or fewer participants. Figure 2. Numbers of participants by ethnicity. Figure 3 illustrates the participants by marital status. Half were married, 50%, n = 51 participants. Approximately half were single, 41%, n = 42. Ten participants labeled their marital status as something other than married or single, 10%. Figure 3. Numbers of participants by marital status. Participants were in their early 40’s on average, M = 43.38 years old, SD = 13.13, but represented a broad range of ages, min = 21 years, max = 70 years. They had been working for their current organization nearly ten years on average, M = 9.84 years, SD = 8.02, though again represented a broad range of time on the current job, min = 1 year, max = 31 years. They had worked for their current manager about half as long as they had been employed by the organization, M = 4.87 years, SD = 5.48. They again, however, reported a broad range, min = 1 year, max = 30 years. Each participant was a member of one of two groups: those
- 37. whose managers held a human services degree and those whose managers did not hold a human services degree. Participants were also asked on the survey whether or not their manager’s professional background included human services experience, regardless of formal education. Figure 4 shows the cross-tabulation of human services degrees (formal education) and professional background (direct experience) among managers. In total, 28 managers held human services degrees. All 28 of them had a professional background in human services as well. The other 74 managers did not hold a human services degree. In a 2-to-1 ratio, twice as many non- degree-holding managers had professional backgrounds in human services as did not have professional backgrounds in human services. Figure 4. Cross-tabulation between human services degree held (yes or no) and manager’s professional background in human services (yes or no). A chi-square test was run to determine whether the association between holding a human services degree and having a professional human services background was statistically significant. The hypotheses were: H0: The association between human services degrees and professional background in human services was not statistically significant. H1: The association between human services degrees and professional background in human services was statistically significant. Results of the chi-square indicated that the association between human services degrees and professional background in human services was statistically significant, X2 (1, 102) = 9.53, p = .002, Φ = .33, p = .001. The null hypothesis was rejected. Adjusted residuals, listed on Table 1, showed that there were significantly fewer degree holders without human services backgrounds than expected but also significantly more non- degree-holders without human services backgrounds than
- 38. expected. [Sharon, maybe one of the observations you have made professionally, which led to your study, is that a quarter of your participants work for managers who have neither formal education nor professional experience in human services! That combination of inexperience would make it difficult for someone to perform well at work!] Table 1 Manager's Professional Background by Human Services Education Crosstabulation Manager's Professional Background Human Services Education Total No Yes Human Services Background Observed Count 51 28 79 Expected Count 57.3 21.7 79.0 % within Human Services Education 69% 100% 77% Adjusted Residual -3.4 3.4
- 39. Non-Human Services Background Count 23 0 23 Expected Count 16.7 6.3 23.0 % within Human Services Education 31% 0% 23% Adjusted Residual 3.4 -3.4 Total Count 74 28 102 Expected Count 74.0 28.0 102.0 % within Human Services Education 100% 100% 100%
- 40. Descriptive Statistics for Summated Scales and Managerial Effectiveness Recall that the Likert scale of agreement used to measure the three leadership behaviors of interest (aims or goals emphasis; personal backing; and work easing or facilitation) had a 7-point scale (1 = strongly disagree, 7 = strongly agree). Also recall that summated scale scores were the means of each participant’s responses to conceptually-related items. Table 2 shows the descriptive statistics for the three summated scales and a measure of manager effectiveness. Means for all three summated scales fell between 5 and 6 in value. Scores between 5 and 6 reflect responses between “somewhat agree” to “agree.” The minimum score for all three summated scales was one, indicating that at least participant strongly disagreed with all of the survey items used to measure a particular summated scale. Alternatively, the maximum score for all three summated scales was 7, indicating that at least one participant strongly agreed with all of the survey items used to measure a particular summated scale. The fourth measure whose descriptive statistics are listed on Table 2 summarizes overall managerial effectiveness. These data emerged from responses to the survey question, “How effective is your manager? Pleases choose one number between 1 and 10, with 1 = not at all effective, 10 = maximally effective.” On average, participants rated managerial effectiveness between 7 and 8, indicating that average perceptions were that managerial effectiveness fell between moderate and maximal. Table 2 Descriptive Statistics for Summated Scales and Managerial Effectiveness Aims Emphasis SS Personal Backing SS Work Easing SS Managerial Effectiveness
- 41. Cronbach’s alpha .74 .84 .94 - Mean 5.59 5.31 5.46 7.64 95% CI LB 5.34 5.03 5.17 7.17 UB 5.83 5.59 5.75 8.11 5% Trimmed M 5.69 5.42 5.60 7.85 Median 6.00 5.66 6.0 8.00 Variance 1.46 1.9 2.09
- 43. Note. 95% CI = 95% confidence interval of the mean. LB = lower bound of the 95% CI. UB = upper bound of the 95% CI. IQR = Interquartile range. Correlations This section shows the results of inspecting correlations to look for covariates and sufficient correlations among dependent variables to establish the analytical approach to answering RQs 1-3. The analytical plan was based on correlations: analyze RQs 1-3 with separate independent t tests in the absence of covariates; analyze RQs 1-3 with 1x2 ANCOVA tests in the presence of covariates; analyze RQs 1-3 with a MANOVA test if the dependent variables (leadership behaviors: aims or goals emphasis; personal backing; and work easing or facilitation) were sufficiently correlated; or analyze RQs 1-3 with a MANCOVA test the dependent variables were sufficiently correlated and there were covariates. The patterns of the correlations among participants whose managers did and did not hold a human services degree are shown on Table 3. Correlations above the diagonal reflect managers without human services degrees, n = 73-75 participants. Correlations below the diagonal reflect managers with human services degrees, n = 27-28 participants. The patterns across the two groups were identical. Four patterns emerged. One, all three summated scales (V1, V2, and V3) were strongly and positively correlated to each other. This justified a MANOVA test. Two, all three summated scales (V1, V2, and V3) were also strongly and positively correlated with the numeric estimate of the manager’s overall effectiveness (V4). This justified a MANCOVA test. Three, there were strong and positive correlations between the years spent working for the current manager, years spent working for the current human services organization, and the participant’s age (V5, V6, and V7) . Four, these three demographic variables (V5, V6, and V7) did not correlate significantly with the summated scales (V1, V2, and V3) or managerial effectiveness (V4). These
- 44. demographic variables were therefore not used as covariates [Sharon, ergo, the demographic variables are NOT covariates. But managerial effectiveness is a covariate.] Table 3 Pearson Correlation Matrix of Leadership Styles and Demographic Variables V1 V2 V3 V4 V5 V6 V7 V1 Personal Backing SS .82** .84** .71** .13 -.06 -.06 V2 Aims Emphasis SS .71** .86** .75** .14 -.02 -.07 V3 Work Easing SS .84** .92** .81** .19
- 45. -.05 -.02 V4 Managerial Effectiveness .71** .69** .77** .08 .02 .01 V5 Years w Current Manager .21 .19 .16 .15 .59** .45** V6 Year w Current Organization -.20 -.18 -.23 -.20 .66** .48** V7 Age -.03 -.09 -.04 .04 .35 .43* Note. V = variable. Above diagonal: managers without human services degrees, n = 73-75 participants. Below diagonal:
- 46. managers with human services degrees, n = 27-28 participants. *Correlation is significant at the 0.05 level (2-tailed). **Correlation is significant at the 0.01 level (2-tailed). Results for Research Questions 1-3 Correlations listed on Table 3 justified a MANCOVA test that addressed all three research questions at once in a single analysis. This section presents those results. RQ1 was, Is there a difference in aims or goals emphasis, as a leadership behavior, between non-profit human services managers with and without human services degrees? RQ2 was, Is there a difference in personal backing, as a leadership behavior, between non-profit human services managers with and without human services degrees? RQ3 was, Is there a difference in work easing or facilitation, as a leadership behavior, between non-profit human services managers with and without human services degrees? In the MANCOVA, the covariate was the managerial effectiveness. The independent variable was human services degree, with two levels (yes, manager held a human services degree; no, manager did not hold a human services degree). The multivariate dependent variable was the linear combination of the three leadership behaviors of interest (aims or goals emphasis; personal backing; and work easing or facilitation). MANCOVA first tests a set of multivariate hypotheses. The multivariate hypotheses were: Covariate H0: Managerial effectiveness was not a significant covariate. Covariate H1: Managerial effectiveness was a significant covariate. Multivariate H0: The difference in the linear combination of the three leadership behaviors of interest between managers with and without human services degrees was not statistically significant. Multivariate H1: The difference in the linear combination of the three leadership behaviors of interest between managers with and without human services degrees was statistically
- 47. significant. The data met the assumption of equality of covariance matrices, Box’s M = 16.44, F(6, 16609) = 2.62, p = .021. The data also met the assumption of equality of error variances, Aims Emphasis SS Levene’s F(1, 99) = 0.52, p = .474; Personal Backing SS Levene’s F(1, 99) = 0.12, p = .735; Work Easing SS Levene’s F(1, 99) = 0.95, p = .331. Results of the multivariate portion of the MANCOVA showed that the managerial effectiveness was a significant covariate, Wilks Lambda = .35, F(3, 96) = 60.29, p < .001; the covariate null hypothesis was rejected. The impact of the overall managerial effectiveness was very strong, partial eta2 = .65. When the impact of the overall managerial effectiveness was factored out, the difference in the linear combination of the three leadership behaviors of interest between managers with and without human services degrees was not statistically significant, Wilks Lambda = .99, F(3, 96) = 0.37, p = .775. The multivariate null hypothesis was retained. [Sharon, I am very sorry! Your hypothesis was not supported! Holding a human services degree did not seem to increase the managers’ effectiveness! However, we gained valuable information. One was that managers’ overall effectiveness matched their effectiveness in the three individual dimensions of leadership: aims or goals emphasis; personal backing; and work easing or facilitation. Our MANCOVA results argued that the related dependent variables (aims emphasis; personal backing; and work easing) probably do not each represent a conceptually distinct and independent outcome, but actually represent multiple measures of one conceptually distinct outcome: effectiveness. You can comment in chapter 5 about whether this fits with literature on the dimensions measured by the MAO. From a practical standpoint, our results further indicate that we can simply ask for an effectiveness rating on a 1-10 scale. Another was that differences between managers with and without degrees disappear when we factor
- 48. out overall effectiveness, BUT there were still differences between the means that show that managers with degrees are better at aims emphasis; personal backing; and work easing. These will be shown in the Cohen’s d statistics. Propose future research in chapter 5 to discover what managers without human services degrees and/or professional backgrounds do to make up for their deficits.] Figure 5 illustrates mean ratings for Aims Emphasis across the two groups. The average rating for the Aims Emphasis SS was slightly higher among managers who held human services degrees, M = 5.91, SD = 0.98, than it was among managers who did not hold human services degrees, M = 5.45, SD = 1.27. Although the difference in means was non-significant, as per the MANCOVA results, the impact of human services degrees on this dimension of leadership was very strong, partial eta2 = .45. Figure 5. Mean Aims Emphasis SS across managers with and without a human services degree. Figure 6 illustrates mean ratings for Personal Backing across the two groups. The average rating for the Personal Backing SS was slightly higher among managers who held human service degrees, M = 5.71, SD = 1.40, than it was among managers who did not hold human services degrees, M = 5.15, SD = 1.45. Although the difference in means was non- significant, as per the MANCOVA results, the impact of human services degrees on this dimension of leadership was very strong, partial eta2 = .50. Figure 6. Mean Personal Backing SS across managers with and without a human services degree. Figure 7 illustrates mean ratings for Work Easing across the two groups. The average rating for the Work Easing SS was slightly higher among managers who held human services degrees, M = 5.79, SD = 1.28, than it was among managers who did not hold human services degrees, M = 5.30, SD = 1.49.
- 49. Although the difference in means was non-significant, as per the MANCOVA results, the impact of human services degrees on this dimension of leadership was very strong, partial eta2 = .42. Figure 7. Mean Work Easing SS across managers with and without a human services degree. Answer to Research Questions The answer to RQ1 (Is there a difference in aims or goals emphasis, as a leadership behavior, between non-profit human services managers with and without human services degrees?) was no. The answer to RQ2 (Is there a difference in personal backing, as a leadership behavior, between non-profit human services managers with and without human services degrees?) was no. The answer to RQ3 (Is there a difference in work easing or facilitation, as a leadership behavior, between non-profit human services managers with and without human services degrees?) was no. Summary The modal participant was a married Caucasian woman in her 40s who had worked for her current organization for ten years and for her current manager for five years, N = 103 participants. Three times as many participants had managers who did not hold human services degrees, 73%, as did, 28%. A chi-square test revealed a significant association between holding a human services degree and having a professional human services background, with fewer degree holders but more non-degree-holders without human services backgrounds. Means for three summated scales of aims emphasis, personal backing, and work easing fell 5-6 in value, reflecting “somewhat agree” to “agree” responses. Manager’s effectiveness (measured on a 1-10 scale where 10 = maximally effective) averaged 7-8, indicating that managerial effectiveness fell between moderate and maximal. Patterns in correlations among participants whose managers did and did not hold a human services degree were
- 50. identical. Four patterns emerged. 1) All three summated scales were strongly and positively correlated to each other. 2) All three summated scales were strongly and positively correlated with manager’s overall effectiveness. 3) Strong and positive correlations arose among demographic variables of years spent working for the current manager, years spent working for the current human services organization, and the participant’s age. 4) demographic variables did not correlate with summated scales or managerial effectiveness. Correlational patterns justified a MANCOVA test that addressed all three research questions at once in a single analysis. RQ1 was, Is there a difference in aims or goals emphasis, as a leadership behavior, between non-profit human services managers with and without human services degrees? RQ2 was, Is there a difference in personal backing, as a leadership behavior, between non-profit human services managers with and without human services degrees? RQ3 was, Is there a difference in work easing or facilitation, as a leadership behavior, between non-profit human services managers with and without human services degrees? MANCOVA results showed that managerial effectiveness was a significant covariate. When its impact was factored out, the difference in multivariate leadership between managers with and without human services degrees was not significant. For all three leadership summated scales, participants whose managers held human services degrees had higher means that reflected non-significant but strong effects of degree holders on leadership. Xxxxxxxxxxxxxxxxxxxxxxxxxxxxxxxxxxxxxxxxxxxx Remove from this chapter and add to your References! Gliner, J. A., & Morgan, G. A. (2000). Research methods in applied settings: An integrated approach to design and analysis. Erlbaum: Mahwah, NJ. Hair Jr., J. F., Black, W. C., Babin, B. J., Anderson, R. E., & Tatham, R. L. (2010). Multivariate data analysis. Upper Saddle River, NJ: Prentice Hall. 785 pp.
- 51. Siegel, S., & Castellan, Jr., N. J. (1988). Nonparametric statistics for the behavioral sciences. 2nd ed. New York NY: McGraw-Hill. Warner, R. M. (2013). Applied Statistics. 2nd ed. Los Angeles CA: Sage. 1101 pp.