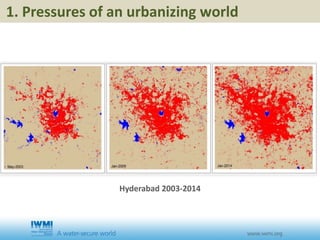
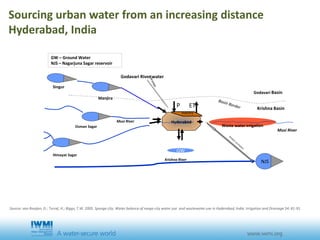
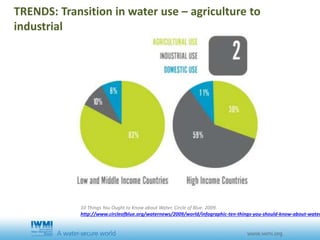
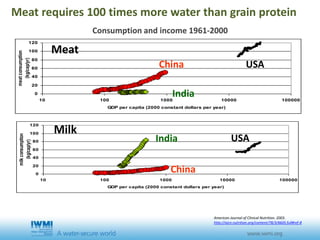
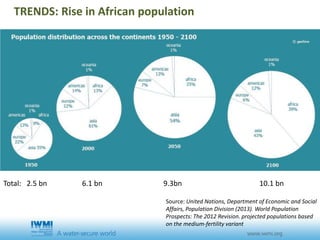
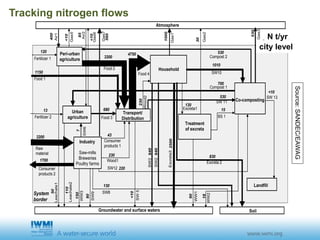
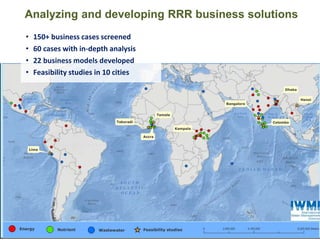
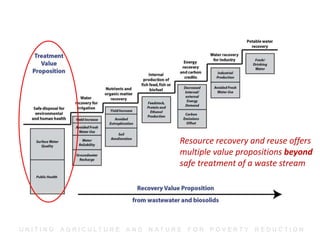
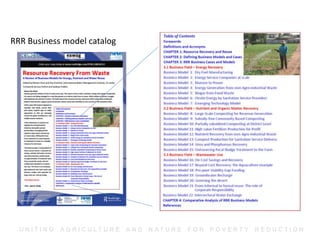
Cover slide option 1 TitleSolutions for a water secure and urbanizing world
Jeremy Bird
International Water Management
Institute
ZEF
15 March 2016
Photo: Hamish John Appleby/IWMI
World production of major
crops, 1961-2009
(billion tonnes)
Undernourished in developing
world population,
1969 to 2010 (percent)
Agriculture – a success story?
U N I T I N G A G R I C U L T U R E A N D N AT U R E F O R P O V E R T Y R E D U C T I O N
But at a price - land and water degradation
Hyderabad 2003-2014
1. Pressures of an urbanizing world
Sourcing urban water from an increasing distance
Hyderabad, India
Krishna River
Himayat Sagar
Osman Sagar
GW
Musi River
GW – Ground Water
NJS – Nagarjuna Sagar reservoir
Hyderabad
Waste water irrigation
industry
Godavari Basin
Krishna Basin
NJS
Musi River
P ET
Manjira
Singur
Godavari River water
W
a
te
r
p
u
m
p
e
dWaterpumped
Source: van Rooijen, D.; Turral, H.; Biggs, T.W. 2005. Sponge city: Water balance of mega-city water use and wastewater use in Hyderabad, India. Irrigation and Drainage 54: 81-91.
10 Things You Ought to Know about Water. Circle of Blue. 2009.
http://www.circleofblue.org/waternews/2009/world/infographic-ten-things-you-should-know-about-water
TRENDS: Transition in water use – agriculture to
industrial
0
20
40
60
80
100
120
10 100 1000 10000 100000
GDP per capita (2000 constant dollars per year)
meatconsumption
(kg/cap/yr)
Meat
China
India
0
20
40
60
80
100
120
10 100 1000 10000 100000
GDP per capita (2000 constant dollars per year)
milkconsumption
(kg/cap/yr)
Milk
China
India USA
USA
Consumption and income 1961-2000
American Journal of Clinical Nutrition. 2003.
http://ajcn.nutrition.org/content/78/3/660S.full#ref-8
Meat requires 100 times more water than grain protein
TRENDS: Rise in African population
Source: United Nations, Department of Economic and Social
Affairs, Population Division (2013). World Population
Prospects: The 2012 Revision. projected populations based
on the medium-fertility variant
Total: 2.5 bn 6.1 bn 9.3bn 10.1 bn
TRENDS: Feminization and ageing of agricultural population
 1 million Nepali migrants in 2004 - 97% were male.
World Bank. 2009
 26% of Nepalese households are headed by females.
2011 Census
 World’s farming population is ageing – average age approaching 60
 Trends towards consolidation of land in China, Korea, Malaysia…
Photo: Jim Holmes / IWMI
Combined
Heat and
Power
Plant
Thermal
Power
Station
The Sea
Lake
Drinking Water
Plant
WWTP
Sedimentation
Equalizer
Eco Friendly
Electricity
Energy
WWTP
Thermal
Power
Station
Combined
Heat and
Power
Plant
Decentralization fosters integrated urban resource
management - Hammarby Sjöstad
Need to consider non-conventional resources –
a portfolio of options
Demand
(2035)
New
SW-1
Rainwater
harvesting(Cluster)
NewGW
DemandMgt.Leakage
Mgt.
Greywater(Cluster)
Demand
(2010)
637X103 m3/d deficit
2. Waste as a resource
Irrigation with partially or untreated wastewater continues
on 6 to 20 million of hectares worldwide
0
5
10
15
20
25
30
Diluted
wastewater
or polluted
water
Untreated
wastewater
Groundwater Treated
wastewater
River Other
surface
water bodies
Rainfed Irrigation
canal
Open
drainage
Numberofcities
In and around three of four cities in developing and emerging
economies, farmers use polluted irrigation water for the
production of high-value crops
Wastewater irrigation is a reality
Area irrigated with untreated and treated wastewater
China: 4 million ha; out of
proportion
Untreated wastewater
Treated wastewater
0 10 20 30 40 50 60 70 80 90 100 110 120 130 140 150 160 170 180 190 200
Germany
S. Arabia
Libya(1)
France
Oman(1)
Kuwait(1)
Tunisia
Syria#
Turkey*
Jordan
USA
UAE(1)
Australia
Argentina
Italy*
Cyprus
Egypt*
Israel(1)*
Mexico
Chile
Bolivia#
Nepal(1)
Tunisia
Sudan
Kuwait#
Egypt(1)
Morocco
Turkey
Peru
Vietnam
Ghana*
SA*
Argentina
Colombia
Pakistan
Syria*
Chile(1)*
India(1)*
Mexico
China*
Area ('000 ha)
Formal sector
Driver: Water scarcity
 Planned use and ‘controlled’ health risks
Informal sector
Driver: Water pollution (poor sanitation)
 Unplanned use and high health risks
Source:
0
5
10
15
20
25
30
35
NumberofTreatmentPlants
Region
Business (e.g., hotel,
airport)
Hospital
Military
School
Municipal/Township
Community-level
How many of them work ?
Source: Murray & Drechsel, 2011
Fecal sludge - treatment plants not always the answer
Vegetables are grown using
urban waste water – health risk
Source: Pay Drechsel / IWMI
New guidelines based on simple technology
 2 million tons of waste into rivers, lakes and wetlands daily
 128 million septic tanks and latrines in India contribute to 80%
of the pollution of its surface waters
 12 000 km3 of polluted water on the planet - more than the
contents of the world’s 10 biggest river basins (FAO 2011)
Photo: Pay Drechsel
Urban – rural interface: options for viable nutrient
recycling?
Atmosphere
Peri-urban
agriculture
Urban
agriculture
Saw-mills
Breweries
Poultry farms
Transport/
Distribution
Landfill
Fertilizer 1
Fertilizer 2
Food 1
Food 2
Food 3
Consumer
products 1
Compost 1
SW10
Excreta3
SW3
SW5
SW9
SW 11
SW12
Excreta1
WW1
Gas3
WW2
BS 1
Raw
material
SW 13
Food 4
Consumer
products 2
Compost 2
System
border
Industry
Excreta 2Wood1
Wood2
120
1150
13
3200
1700
3200
680
43
230
80
4750
230
530
1010
130
830
220
640
2500
15
90
530
700
<10
18
530
Air1
Air2
Gas5
Gas6
Gas7
400
85
<10
<10
560
Gas1
Gas2
1000
30
<10
Soil
SW2
640
Leachate1
50
Leachate2
110
WW3
150
SW6
SW8
7
130
Co-composting
Household
Treatment
of excreta
Scenario 1
Groundwater and surface waters
city level
N t/yr
Source:SANDEC/EAWAG
Tracking nitrogen flows
U N I T I N G A G R I C U L T U R E A N D N AT U R E F O R P O V E R T Y R E D U C T I O N
Analyzing and developing RRR business solutions
• 150+ business cases screened
• 60 cases with in-depth analysis
• 22 business models developed
• Feasibility studies in 10 cities
U N I T I N G A G R I C U L T U R E A N D N AT U R E F O R P O V E R T Y R E D U C T I O N
Resource recovery and reuse offers
multiple value propositions beyond
safe treatment of a waste stream
U N I T I N G A G R I C U L T U R E A N D N AT U R E F O R P O V E R T Y R E D U C T I O N
RRR Business model catalog
www.iwmi.org
Water for a food-secure world
Example of action research:
Fecal Sludge Valorization
Waste to fertilizer – closing the nutrient loop
Co-composting
Photo:DavidBrazier/IWMIPhoto:TomvanCakenberghe/IWMIPhoto:DavidBrazier/IWMIPhoto:DavidBrazier/IWMI
Fecal Sludge Management (FSM)
Comparison of Business Models
U N I T I N G A G R I C U L T U R E A N D N AT U R E F O R P O V E R T Y R E D U C T I O N
FSM cases
(RRR report series in print)
U N I T I N G A G R I C U L T U R E A N D N AT U R E F O R P O V E R T Y R E D U C T I O N
FSM focus on Co-Composting
Our activities:
- Advisory service for ADB, WB,
BMGF in Sri Lanka, Ghana,
India, Nepal, …
- In-depth feasibility studies at
town and city level
- Investment climate studies
(with ZEF)
- Implementing PPP in Accra
- Guiding municipalities on FSM
in Sri Lanka
- Agronomic trials
- Co-compost quality
- Enrichment
- Pelletization
- Curriculum and MOOC
development on RRR business
models
Target 6.2 – By 2030, achieve access to adequate and
equitable sanitation and hygiene for all, and end open
defecation, paying special attention to the needs of women
and girls and those in vulnerable situations.
Target 6.3 – By 2030, improve water quality by reducing
pollution, eliminating dumping and minimizing release of
hazardous chemicals and materials, halving the proportion of
untreated wastewater and substantially increasing recycling
and safe reuse.
Goal 6. Ensure availability and sustainable management of
water and sanitation for all
What happens when the pit is full?
Photo: Sharada Prasad CS (https://www.flickr.com/photos/sharadaprasad/)
Heather Purshouse, Grattan Maslin; IWMI, unpublished
Kathmandu Valley
U N I T I N G A G R I C U L T U R E A N D N AT U R E F O R P O V E R T Y R E D U C T I O N
FSM is high on the development agenda (SDG 6.2.1)
Photo:DavidBrazier/IWMIPhoto:TomvanCakenberghe/IWMIPhoto:DavidBrazier/IWMIPhoto:DavidBrazier/IWMI
*JMP official projections (maybe slightly different due to definition) Di Mario, Peal, Nikiema, Drechsel (unpublished)
ImprovedSanitationUnimprovedSanitation
Improved
and Safely
Managed
5%
Total Not Safely Managed
Unimproved
and Safely
Managed
4%
90%
15*-21%
79-85*%
To Piped
Sewer (2%)
To Improved
Pit Latrines
(14%)
Open
defecation
(21%)
To Septic
Tanks (5%)
Treatment
End-use/
disposal
Emptying and TransportContainment
To Unimproved
Pit Latrines
(5%)
To Shared or
Public Toilets
(51%)
Other
Improved (0%)
To Other
Unimproved
(O%)
WW not treated
WW treated
FS emptied
FS treated
FS not treated
FS not emptied
WW delivered to
treatment
WW not delivered to
treatment
FS emptied
FS emptied
FS not emptied
FS not emptied
FS treated
FS not treated
Contained
Not Contained
Contained
Not Contained
Contained
Not Contained
Contained
Not Contained
Not Contained
Not Contained
Safely
abandoned
FS treated
FS not treated
<1%
<1%
<1%
4%
21%
5%
8%
10% 33%
4%
3%
3%
Ghana National Assessment
Photo:DavidBrazier/IWMIPhoto:TomvanCakenberghe/IWMIPhoto:DavidBrazier/IWMIPhoto:DavidBrazier/IWMI
*JMP official projections (maybe slightly different due to definition)
Di Mario, Peal, Nikiema, Drechsel (work in progress, unpublished)
ImprovedSanitationUnimprovedSanitation
Improved
and Safely
Managed
5%
Total Not Safely Managed
Unimproved
and Safely
Managed
4%
90%
15*-21%
79-85*%
To Piped
Sewer (2%)
To Improved
Pit Latrines
(14%)
Open
defecation
(21%)
To Septic
Tanks (5%)
Treatment
End-use/
disposal
Emptying and TransportContainment
To Unimproved
Pit Latrines
(5%)
To Shared or
Public Toilets
(51%)
Other
Improved (0%)
To Other
Unimproved
(O%)
WW not treated
WW treated
FS emptied
FS treated
FS not treated
FS not emptied
WW delivered to
treatment
WW not delivered to
treatment
FS emptied
FS emptied
FS not emptied
FS not emptied
FS treated
FS not treated
Contained
Not Contained
Contained
Not Contained
Contained
Not Contained
Contained
Not Contained
Not Contained
Not Contained
Safely
abandoned
FS treated
FS not treated
<1%
<1%
<1%
4%
21%
5%
8%
10% 33%
4%
3%
3%Existing data or ‘easy’
to access
Photo:DavidBrazier/IWMIPhoto:TomvanCakenberghe/IWMIPhoto:DavidBrazier/IWMIPhoto:DavidBrazier/IWMI
*JMP official projections (maybe slightly different due to definition)
Di Mario, Peal, Nikiema, Drechsel (work in progress, unpublished)
ImprovedSanitationUnimprovedSanitation
Improved
and Safely
Managed
5%
Total Not Safely Managed
Unimproved
and Safely
Managed
4%
90%
15*-21%
79-85*%
To Piped
Sewer (2%)
To Improved
Pit Latrines
(14%)
Open
defecation
(21%)
To Septic
Tanks (5%)
Treatment
End-use/
disposal
Emptying and TransportContainment
To Unimproved
Pit Latrines
(5%)
To Shared or
Public Toilets
(51%)
Other
Improved (0%)
To Other
Unimproved
(O%)
WW not treated
WW treated
FS emptied
FS treated
FS not treated
FS not emptied
WW delivered to
treatment
WW not delivered to
treatment
FS emptied
FS emptied
FS not emptied
FS not emptied
FS treated
FS not treated
Contained
Not Contained
Contained
Not Contained
Contained
Not Contained
Contained
Not Contained
Not Contained
Not Contained
Safely
abandoned
FS treated
FS not treated
<1%
<1%
<1%
4%
21%
5%
8%
10% 33%
4%
3%
3%
FSM is a neglected
issue
• Best practice for urban water security
• Provide guidance on RRR business opportunities
• Advise on health risk assessments, guidelines for risk
mitigation
• Development of improved rural – urban governance
propositions and trade off analysis
• Develop urban food security strategies and rural urban
trade-off analysis
• Policy analysis
• Feasibility studies
• M&E strategies
• ….
New focus on rural – urban linkages
3. Groundwater – a crisis in waiting?
‘Free’ electricity encouraged
groundwater overuse
Groundwater – key for crop expansion
0
5000
10000
15000
20000
25000
30000
35000
40000
45000
Irrigatedareain1000ha
Canal irrigated area Tank irrigated area Groundwater irrigated area
Canal
Tanks
Growth of irrigation in India – groundwater expansion
Mukherji, A., S. Rawat and T. Shah. 2013.
Twin cases of ‘over-abstraction’ and ‘under-utilization’
Source: IWMI
Perverse subsidies on
electricity for agriculture
led to over- abstraction of
groundwater
Licensing and other
regulatory barriers to
groundwater expansion
Innovative groundwater solutions:
Jyotigram Yojana, India
Separate feeder lines and rationing led to more
sustainable groundwater use, reduced electricity
use and increased yields
Photo: Hamish John Appleby/IWMI
West Bengal – easing regulatory and cost barriers to
groundwater use
• Access to groundwater - a
major obstacle
• Reforms reduced red-tape -
licensing and connection
charges
• Could benefit more than 4.5
million smallholders
Source: Aditi Mukherji, IWMI
• India has 130,000 GW of
installed pumping capacity in
the form of electric and
diesel tube wells
• Existing subsidy for irrigation
supplemented by attractive
feed-in tariff
• Shifting to a solar power
source could reduce India’s
Greenhouse Gas emissions
by up to 6%
• Livelihoods – Energy - Water
Solution
• Threat of over-use
Solar irrigation - the opportunity and the risk
Photo: Prashanth Vishwanathan / IWMI
SOLAR FARMER
Grid Connected Farmers:
• Replace existing pumps
with solar
• Offer guaranteed buy
back of surplus solar
power at an attractive
price
Non grid connected farmers:
• Form cooperative
• Common feed in-point for “pooled power”
• Guarantee buy-back
• Reduce utility transaction costs
The solution: redesigning the solar mission as a “cash crop”
opportunity
(IWMI, 2011)
Signs of over-pumping and pollution as Jaffna develops
Groundwater
reserves in Africa are
many times greater
than surface water
 But how
sustainable?
Significant groundwater
potential exists in Africa
Tanzania – from bucket to pump –
facilitating entry into the irrigation market
• Co developed solutions – multiple partners
• Focus on over-use as well as resource degradation
• Scaling up of tested solutions
• Innovative policy and institutional approaches
• Contribution to multiple SDGs and climate
resilience
• Links to other groundwater programs
Groundwater solutions initiative for policy and practice
Better water management - the business case for the planet
www.iwmi.org https://wle.cgiar.org/
https://ccafs.cgiar.org/
Photo: Prashanth Vishwanathan / IWMI

Solutions for a water secure and urbanizing world

  • 1.
    Cover slide option1 TitleSolutions for a water secure and urbanizing world Jeremy Bird International Water Management Institute ZEF 15 March 2016 Photo: Hamish John Appleby/IWMI
  • 2.
    World production ofmajor crops, 1961-2009 (billion tonnes) Undernourished in developing world population, 1969 to 2010 (percent) Agriculture – a success story?
  • 3.
    U N IT I N G A G R I C U L T U R E A N D N AT U R E F O R P O V E R T Y R E D U C T I O N But at a price - land and water degradation
  • 4.
    Hyderabad 2003-2014 1. Pressuresof an urbanizing world
  • 5.
    Sourcing urban waterfrom an increasing distance Hyderabad, India Krishna River Himayat Sagar Osman Sagar GW Musi River GW – Ground Water NJS – Nagarjuna Sagar reservoir Hyderabad Waste water irrigation industry Godavari Basin Krishna Basin NJS Musi River P ET Manjira Singur Godavari River water W a te r p u m p e dWaterpumped Source: van Rooijen, D.; Turral, H.; Biggs, T.W. 2005. Sponge city: Water balance of mega-city water use and wastewater use in Hyderabad, India. Irrigation and Drainage 54: 81-91.
  • 6.
    10 Things YouOught to Know about Water. Circle of Blue. 2009. http://www.circleofblue.org/waternews/2009/world/infographic-ten-things-you-should-know-about-water TRENDS: Transition in water use – agriculture to industrial
  • 7.
    0 20 40 60 80 100 120 10 100 100010000 100000 GDP per capita (2000 constant dollars per year) meatconsumption (kg/cap/yr) Meat China India 0 20 40 60 80 100 120 10 100 1000 10000 100000 GDP per capita (2000 constant dollars per year) milkconsumption (kg/cap/yr) Milk China India USA USA Consumption and income 1961-2000 American Journal of Clinical Nutrition. 2003. http://ajcn.nutrition.org/content/78/3/660S.full#ref-8 Meat requires 100 times more water than grain protein
  • 8.
    TRENDS: Rise inAfrican population Source: United Nations, Department of Economic and Social Affairs, Population Division (2013). World Population Prospects: The 2012 Revision. projected populations based on the medium-fertility variant Total: 2.5 bn 6.1 bn 9.3bn 10.1 bn
  • 9.
    TRENDS: Feminization andageing of agricultural population  1 million Nepali migrants in 2004 - 97% were male. World Bank. 2009  26% of Nepalese households are headed by females. 2011 Census  World’s farming population is ageing – average age approaching 60  Trends towards consolidation of land in China, Korea, Malaysia… Photo: Jim Holmes / IWMI
  • 10.
    Combined Heat and Power Plant Thermal Power Station The Sea Lake DrinkingWater Plant WWTP Sedimentation Equalizer Eco Friendly Electricity Energy WWTP Thermal Power Station Combined Heat and Power Plant Decentralization fosters integrated urban resource management - Hammarby Sjöstad
  • 11.
    Need to considernon-conventional resources – a portfolio of options Demand (2035) New SW-1 Rainwater harvesting(Cluster) NewGW DemandMgt.Leakage Mgt. Greywater(Cluster) Demand (2010) 637X103 m3/d deficit
  • 12.
    2. Waste asa resource
  • 13.
    Irrigation with partiallyor untreated wastewater continues on 6 to 20 million of hectares worldwide
  • 14.
    0 5 10 15 20 25 30 Diluted wastewater or polluted water Untreated wastewater Groundwater Treated wastewater RiverOther surface water bodies Rainfed Irrigation canal Open drainage Numberofcities In and around three of four cities in developing and emerging economies, farmers use polluted irrigation water for the production of high-value crops Wastewater irrigation is a reality
  • 15.
    Area irrigated withuntreated and treated wastewater China: 4 million ha; out of proportion Untreated wastewater Treated wastewater 0 10 20 30 40 50 60 70 80 90 100 110 120 130 140 150 160 170 180 190 200 Germany S. Arabia Libya(1) France Oman(1) Kuwait(1) Tunisia Syria# Turkey* Jordan USA UAE(1) Australia Argentina Italy* Cyprus Egypt* Israel(1)* Mexico Chile Bolivia# Nepal(1) Tunisia Sudan Kuwait# Egypt(1) Morocco Turkey Peru Vietnam Ghana* SA* Argentina Colombia Pakistan Syria* Chile(1)* India(1)* Mexico China* Area ('000 ha) Formal sector Driver: Water scarcity  Planned use and ‘controlled’ health risks Informal sector Driver: Water pollution (poor sanitation)  Unplanned use and high health risks Source:
  • 16.
    0 5 10 15 20 25 30 35 NumberofTreatmentPlants Region Business (e.g., hotel, airport) Hospital Military School Municipal/Township Community-level Howmany of them work ? Source: Murray & Drechsel, 2011 Fecal sludge - treatment plants not always the answer
  • 17.
    Vegetables are grownusing urban waste water – health risk
  • 18.
  • 19.
    New guidelines basedon simple technology
  • 20.
     2 milliontons of waste into rivers, lakes and wetlands daily  128 million septic tanks and latrines in India contribute to 80% of the pollution of its surface waters  12 000 km3 of polluted water on the planet - more than the contents of the world’s 10 biggest river basins (FAO 2011) Photo: Pay Drechsel Urban – rural interface: options for viable nutrient recycling?
  • 21.
    Atmosphere Peri-urban agriculture Urban agriculture Saw-mills Breweries Poultry farms Transport/ Distribution Landfill Fertilizer 1 Fertilizer2 Food 1 Food 2 Food 3 Consumer products 1 Compost 1 SW10 Excreta3 SW3 SW5 SW9 SW 11 SW12 Excreta1 WW1 Gas3 WW2 BS 1 Raw material SW 13 Food 4 Consumer products 2 Compost 2 System border Industry Excreta 2Wood1 Wood2 120 1150 13 3200 1700 3200 680 43 230 80 4750 230 530 1010 130 830 220 640 2500 15 90 530 700 <10 18 530 Air1 Air2 Gas5 Gas6 Gas7 400 85 <10 <10 560 Gas1 Gas2 1000 30 <10 Soil SW2 640 Leachate1 50 Leachate2 110 WW3 150 SW6 SW8 7 130 Co-composting Household Treatment of excreta Scenario 1 Groundwater and surface waters city level N t/yr Source:SANDEC/EAWAG Tracking nitrogen flows
  • 22.
    U N IT I N G A G R I C U L T U R E A N D N AT U R E F O R P O V E R T Y R E D U C T I O N Analyzing and developing RRR business solutions • 150+ business cases screened • 60 cases with in-depth analysis • 22 business models developed • Feasibility studies in 10 cities
  • 23.
    U N IT I N G A G R I C U L T U R E A N D N AT U R E F O R P O V E R T Y R E D U C T I O N Resource recovery and reuse offers multiple value propositions beyond safe treatment of a waste stream
  • 24.
    U N IT I N G A G R I C U L T U R E A N D N AT U R E F O R P O V E R T Y R E D U C T I O N RRR Business model catalog
  • 25.
    www.iwmi.org Water for afood-secure world Example of action research: Fecal Sludge Valorization
  • 26.
    Waste to fertilizer– closing the nutrient loop Co-composting
  • 27.
  • 28.
    U N IT I N G A G R I C U L T U R E A N D N AT U R E F O R P O V E R T Y R E D U C T I O N FSM cases (RRR report series in print)
  • 29.
    U N IT I N G A G R I C U L T U R E A N D N AT U R E F O R P O V E R T Y R E D U C T I O N FSM focus on Co-Composting Our activities: - Advisory service for ADB, WB, BMGF in Sri Lanka, Ghana, India, Nepal, … - In-depth feasibility studies at town and city level - Investment climate studies (with ZEF) - Implementing PPP in Accra - Guiding municipalities on FSM in Sri Lanka - Agronomic trials - Co-compost quality - Enrichment - Pelletization - Curriculum and MOOC development on RRR business models
  • 30.
    Target 6.2 –By 2030, achieve access to adequate and equitable sanitation and hygiene for all, and end open defecation, paying special attention to the needs of women and girls and those in vulnerable situations. Target 6.3 – By 2030, improve water quality by reducing pollution, eliminating dumping and minimizing release of hazardous chemicals and materials, halving the proportion of untreated wastewater and substantially increasing recycling and safe reuse. Goal 6. Ensure availability and sustainable management of water and sanitation for all
  • 31.
    What happens whenthe pit is full? Photo: Sharada Prasad CS (https://www.flickr.com/photos/sharadaprasad/)
  • 32.
    Heather Purshouse, GrattanMaslin; IWMI, unpublished Kathmandu Valley
  • 33.
    U N IT I N G A G R I C U L T U R E A N D N AT U R E F O R P O V E R T Y R E D U C T I O N FSM is high on the development agenda (SDG 6.2.1)
  • 34.
    Photo:DavidBrazier/IWMIPhoto:TomvanCakenberghe/IWMIPhoto:DavidBrazier/IWMIPhoto:DavidBrazier/IWMI *JMP official projections(maybe slightly different due to definition) Di Mario, Peal, Nikiema, Drechsel (unpublished) ImprovedSanitationUnimprovedSanitation Improved and Safely Managed 5% Total Not Safely Managed Unimproved and Safely Managed 4% 90% 15*-21% 79-85*% To Piped Sewer (2%) To Improved Pit Latrines (14%) Open defecation (21%) To Septic Tanks (5%) Treatment End-use/ disposal Emptying and TransportContainment To Unimproved Pit Latrines (5%) To Shared or Public Toilets (51%) Other Improved (0%) To Other Unimproved (O%) WW not treated WW treated FS emptied FS treated FS not treated FS not emptied WW delivered to treatment WW not delivered to treatment FS emptied FS emptied FS not emptied FS not emptied FS treated FS not treated Contained Not Contained Contained Not Contained Contained Not Contained Contained Not Contained Not Contained Not Contained Safely abandoned FS treated FS not treated <1% <1% <1% 4% 21% 5% 8% 10% 33% 4% 3% 3% Ghana National Assessment
  • 35.
    Photo:DavidBrazier/IWMIPhoto:TomvanCakenberghe/IWMIPhoto:DavidBrazier/IWMIPhoto:DavidBrazier/IWMI *JMP official projections(maybe slightly different due to definition) Di Mario, Peal, Nikiema, Drechsel (work in progress, unpublished) ImprovedSanitationUnimprovedSanitation Improved and Safely Managed 5% Total Not Safely Managed Unimproved and Safely Managed 4% 90% 15*-21% 79-85*% To Piped Sewer (2%) To Improved Pit Latrines (14%) Open defecation (21%) To Septic Tanks (5%) Treatment End-use/ disposal Emptying and TransportContainment To Unimproved Pit Latrines (5%) To Shared or Public Toilets (51%) Other Improved (0%) To Other Unimproved (O%) WW not treated WW treated FS emptied FS treated FS not treated FS not emptied WW delivered to treatment WW not delivered to treatment FS emptied FS emptied FS not emptied FS not emptied FS treated FS not treated Contained Not Contained Contained Not Contained Contained Not Contained Contained Not Contained Not Contained Not Contained Safely abandoned FS treated FS not treated <1% <1% <1% 4% 21% 5% 8% 10% 33% 4% 3% 3%Existing data or ‘easy’ to access
  • 36.
    Photo:DavidBrazier/IWMIPhoto:TomvanCakenberghe/IWMIPhoto:DavidBrazier/IWMIPhoto:DavidBrazier/IWMI *JMP official projections(maybe slightly different due to definition) Di Mario, Peal, Nikiema, Drechsel (work in progress, unpublished) ImprovedSanitationUnimprovedSanitation Improved and Safely Managed 5% Total Not Safely Managed Unimproved and Safely Managed 4% 90% 15*-21% 79-85*% To Piped Sewer (2%) To Improved Pit Latrines (14%) Open defecation (21%) To Septic Tanks (5%) Treatment End-use/ disposal Emptying and TransportContainment To Unimproved Pit Latrines (5%) To Shared or Public Toilets (51%) Other Improved (0%) To Other Unimproved (O%) WW not treated WW treated FS emptied FS treated FS not treated FS not emptied WW delivered to treatment WW not delivered to treatment FS emptied FS emptied FS not emptied FS not emptied FS treated FS not treated Contained Not Contained Contained Not Contained Contained Not Contained Contained Not Contained Not Contained Not Contained Safely abandoned FS treated FS not treated <1% <1% <1% 4% 21% 5% 8% 10% 33% 4% 3% 3% FSM is a neglected issue
  • 37.
    • Best practicefor urban water security • Provide guidance on RRR business opportunities • Advise on health risk assessments, guidelines for risk mitigation • Development of improved rural – urban governance propositions and trade off analysis • Develop urban food security strategies and rural urban trade-off analysis • Policy analysis • Feasibility studies • M&E strategies • …. New focus on rural – urban linkages
  • 38.
    3. Groundwater –a crisis in waiting?
  • 39.
    ‘Free’ electricity encouraged groundwateroveruse Groundwater – key for crop expansion
  • 40.
    0 5000 10000 15000 20000 25000 30000 35000 40000 45000 Irrigatedareain1000ha Canal irrigated areaTank irrigated area Groundwater irrigated area Canal Tanks Growth of irrigation in India – groundwater expansion Mukherji, A., S. Rawat and T. Shah. 2013.
  • 41.
    Twin cases of‘over-abstraction’ and ‘under-utilization’ Source: IWMI Perverse subsidies on electricity for agriculture led to over- abstraction of groundwater Licensing and other regulatory barriers to groundwater expansion
  • 42.
    Innovative groundwater solutions: JyotigramYojana, India Separate feeder lines and rationing led to more sustainable groundwater use, reduced electricity use and increased yields Photo: Hamish John Appleby/IWMI
  • 43.
    West Bengal –easing regulatory and cost barriers to groundwater use • Access to groundwater - a major obstacle • Reforms reduced red-tape - licensing and connection charges • Could benefit more than 4.5 million smallholders Source: Aditi Mukherji, IWMI
  • 44.
    • India has130,000 GW of installed pumping capacity in the form of electric and diesel tube wells • Existing subsidy for irrigation supplemented by attractive feed-in tariff • Shifting to a solar power source could reduce India’s Greenhouse Gas emissions by up to 6% • Livelihoods – Energy - Water Solution • Threat of over-use Solar irrigation - the opportunity and the risk Photo: Prashanth Vishwanathan / IWMI
  • 45.
    SOLAR FARMER Grid ConnectedFarmers: • Replace existing pumps with solar • Offer guaranteed buy back of surplus solar power at an attractive price Non grid connected farmers: • Form cooperative • Common feed in-point for “pooled power” • Guarantee buy-back • Reduce utility transaction costs The solution: redesigning the solar mission as a “cash crop” opportunity
  • 47.
    (IWMI, 2011) Signs ofover-pumping and pollution as Jaffna develops
  • 48.
    Groundwater reserves in Africaare many times greater than surface water  But how sustainable? Significant groundwater potential exists in Africa
  • 49.
    Tanzania – frombucket to pump – facilitating entry into the irrigation market
  • 50.
    • Co developedsolutions – multiple partners • Focus on over-use as well as resource degradation • Scaling up of tested solutions • Innovative policy and institutional approaches • Contribution to multiple SDGs and climate resilience • Links to other groundwater programs Groundwater solutions initiative for policy and practice
  • 51.
    Better water management- the business case for the planet
  • 52.