Download as PDF, PPTX


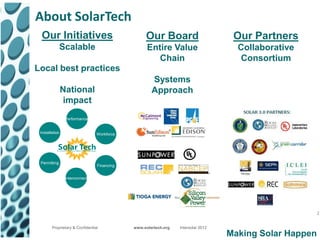
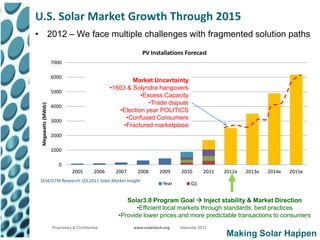
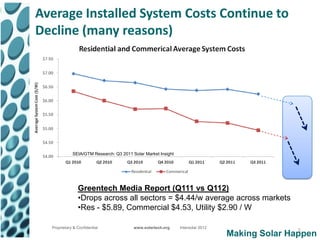


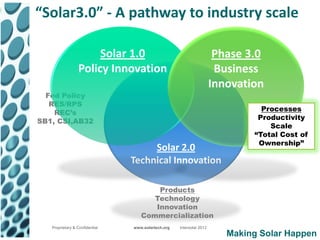

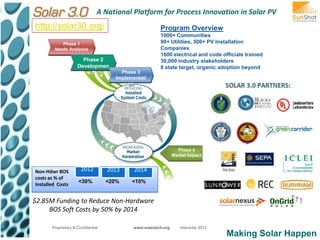
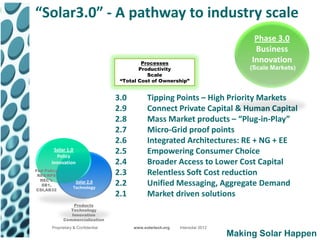
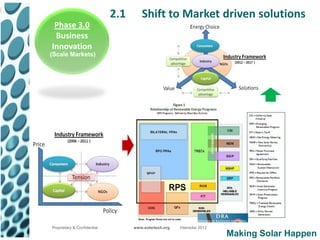


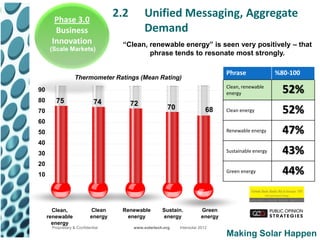
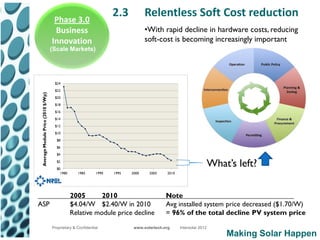
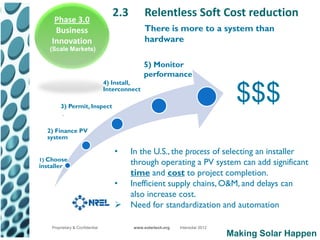
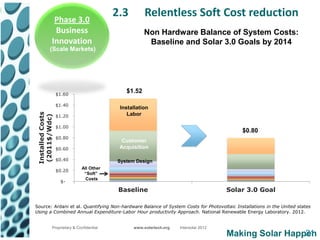
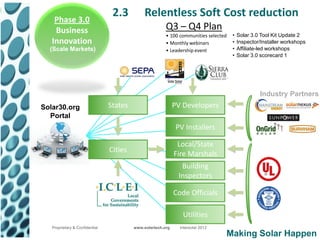
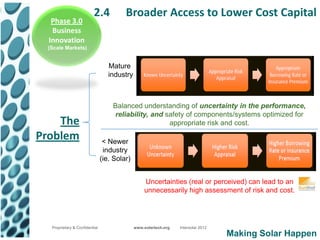
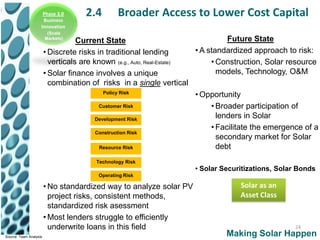
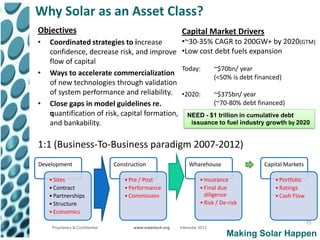
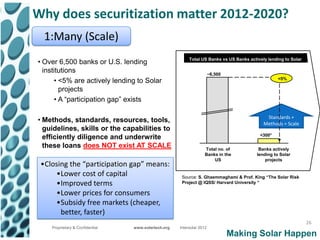
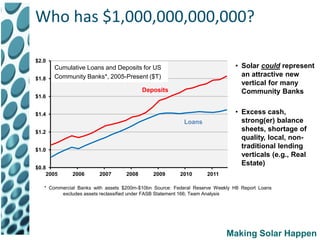
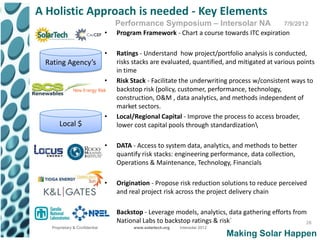
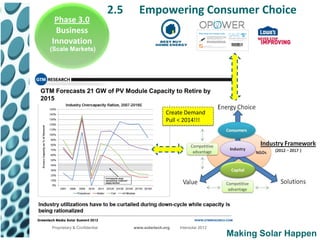
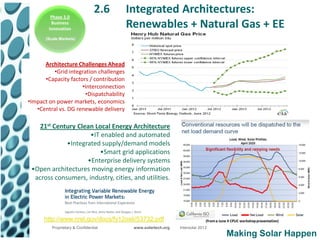
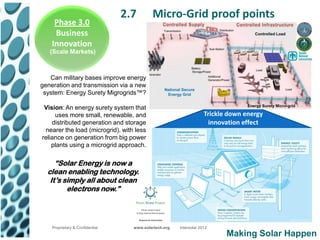
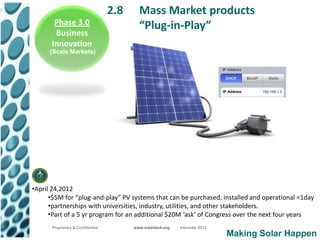


The document outlines the 'Solar3.0' initiative aimed at transforming the U.S. solar market by addressing challenges through a national platform for innovation in policy and business processes. It emphasizes the need for standardized practices, efficient markets, and reduced costs to enhance the solar photovoltaic (PV) sector's growth and consumer adoption. Key points include the projected growth of solar installations, the focus on soft cost reductions, and the importance of access to capital and empowering consumer choice.


