Download as PDF, PPTX
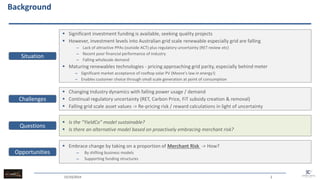
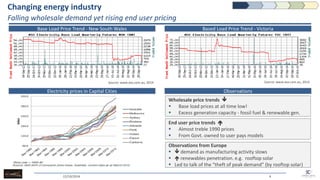
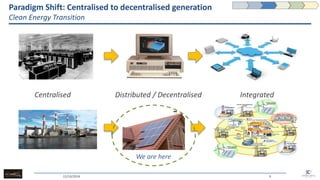
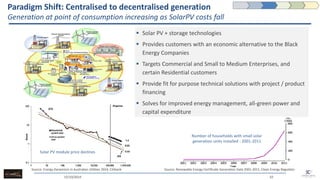
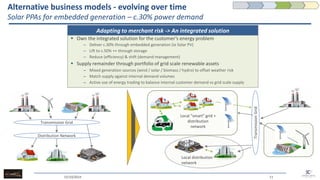
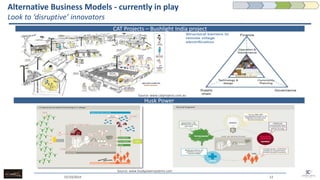

The document discusses the challenges and opportunities in the Australian renewable energy sector, emphasizing the need for new business models and funding structures due to falling investment levels and regulatory uncertainties. It highlights the shift from centralized to decentralized energy generation, the impact of merchant risk, and the necessity for integrated solutions to meet customer energy needs. The document also explores the importance of adapting to changing market dynamics and the potential for innovative energy services catering to commercial and residential customers.


