


![Upside What investment could achieve this level of impact? America invented solar power, they now perfect solar power Large capital investment in our Service Economy Union support for this program (IBEW) [30 jobs per MW] Predictable productivity enhancement matching the gains Germany and Japan have already made Potential for significant emissions reductions Opportunities for Upside If you were a US Political Leader Trying to Inspire your Electorate…](https://image.slidesharecdn.com/big-bet-on-solar-power-29748/85/Big-Bet-on-Solar-Power-43-320.jpg)

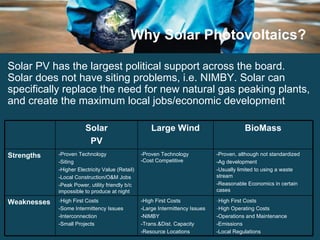
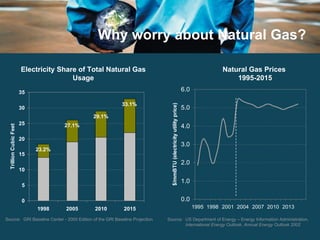
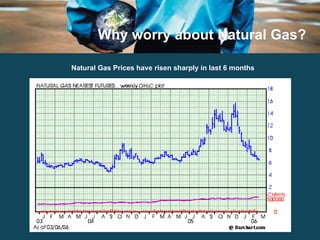
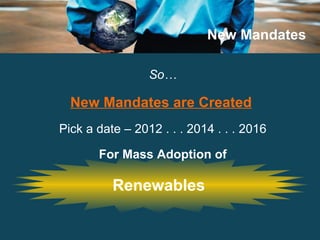
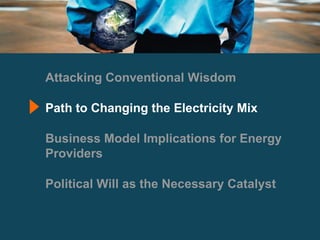
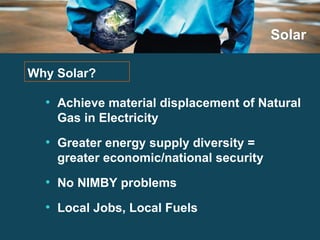
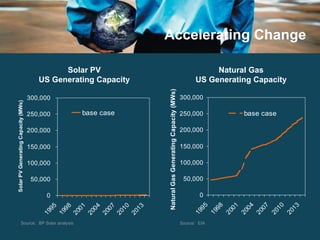
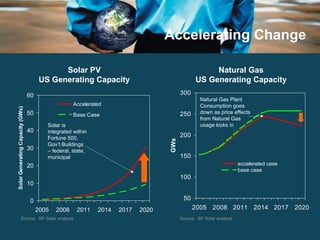
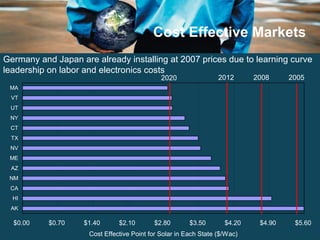
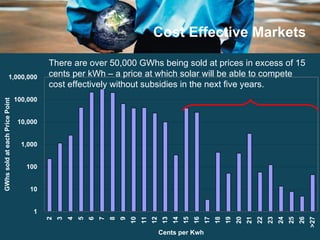
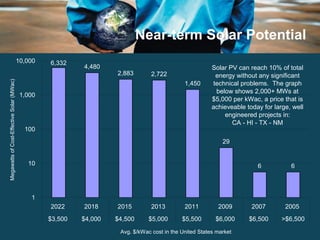
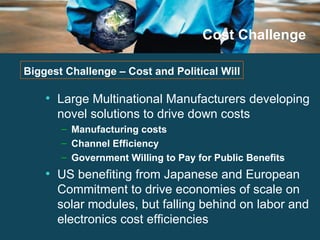
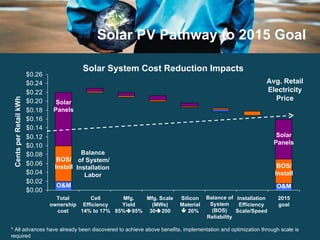
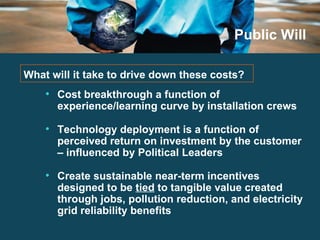
The document discusses accelerating the adoption of solar energy in the United States to reduce reliance on natural gas for electricity generation. It argues that solar photovoltaics have the potential to significantly displace natural gas if costs can be reduced through manufacturing improvements, economies of scale, and limited public subsidies over 10 years. With the right policies and market conditions, solar could achieve cost parity with retail electricity and create many local jobs in manufacturing and installation. Political will is needed to pass mandates and use public benefits to justify initial cost reductions that drive the solar industry to self-sufficiency.