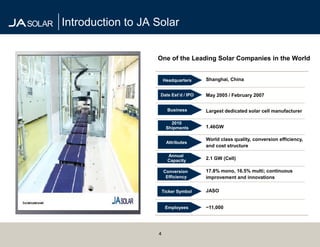
This presentation provides an introduction to JA Solar, a leading solar company based in Shanghai, China. Some key points:
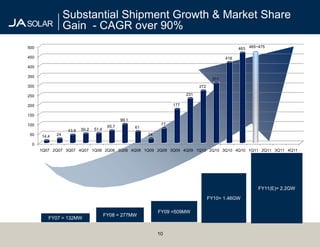
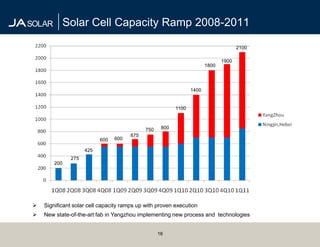
- JA Solar is one of the largest solar cell manufacturers in the world with 2010 shipments of 1.46GW and current annual capacity of 2.1GW.
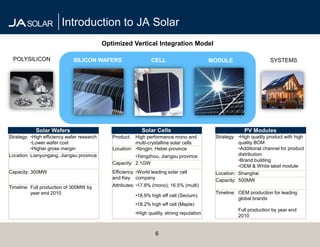
- The company has an optimized vertical integration model from polysilicon to solar wafers, cells, and modules.
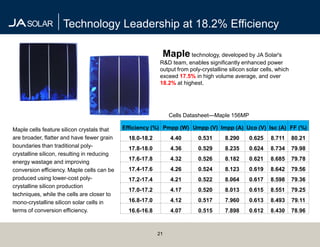
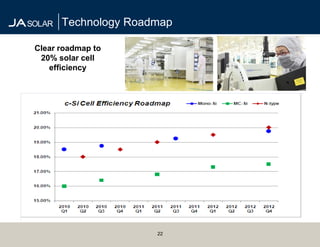
- JA Solar has an experienced management team and focuses on high efficiency, quality products with world-leading solar cell conversion efficiencies.
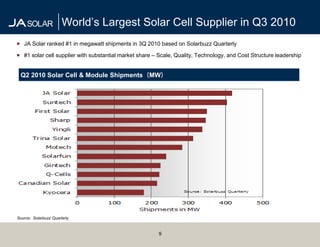
- In Q3 2010, JA Solar ranked as the #1 supplier of solar cells globally based on megawatt shipments according to Solar