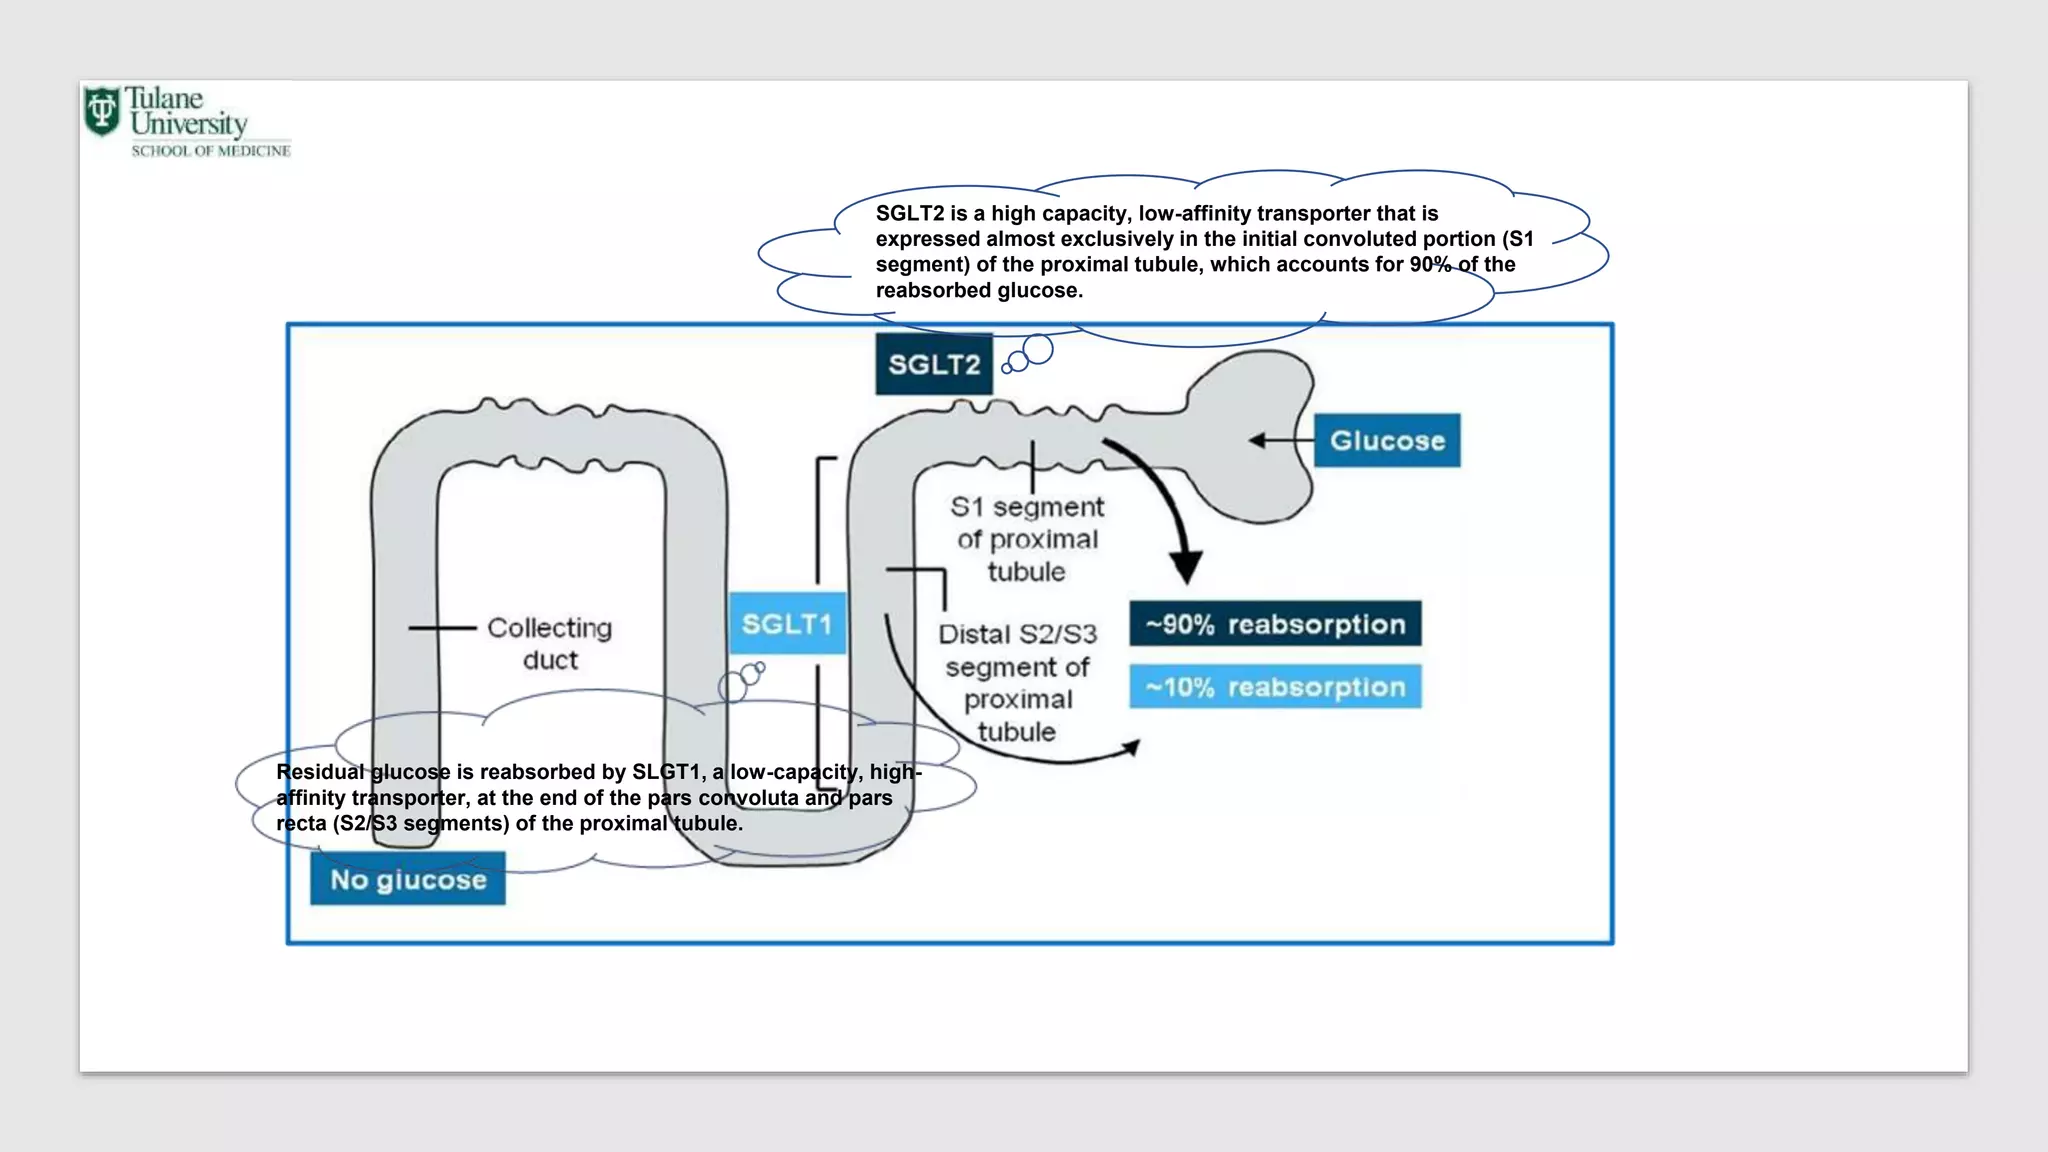
Sweet Pee: Do Sodium–glucose co-transporter 2
(SGLT2) inhibitors have renal protective effects?
Moh’d Sharshir, M.D.
Assistant Professor of Medicine
Section, Nephrology
Tulane University School of Medicine
Disclosure
I have NO financial disclosure or conflicts of interest with the presented
material in this presentation
Introduction
• Diabetes is a global health emergency with 425
million people affected in the year 2017 and a
projection for 629 million by 2045.
• Half develop diabetic kidney disease, and its
prevalence is rising progressively in concert with
the overall diabetes epidemic, largely driven by
type 2 diabetes.
ESRD incidence is increasing because of DM
Adjusted prevalence of ESRD in the US 1996-2014
Alicic RZ, Rooney MT, Tuttle KR: Diabetic kidney disease: Challenges, progress, and possibilities. Clin J Am Soc Nephrol 12: 2032–2045, 2017 2016 Annual Data Report, Vol 2, ESRD, Ch 1 Fig 1.16
Introduction
• Type 2 diabetes mellitus (T2DM) is a major risk factor for the development
of cardiovascular (CV) and renal disease and is a key determinant of
hospitalizations, morbidity, and mortality.
Zelniker TA, Braunwald E. Cardiac and renal effects of sodium-glucose co-transporter 2 inhibitors in diabetes: JACC state-of-the-art review. J Am Coll Cardiol. 2018 Oct;72(15):1845–55.
Diabetic CKD + Cardiovascular Disease =
Hospitalization + Death
2016 Annual Data Report, Vol 1, CKD, Ch 3
Am J Kidney Dis. 2012;59(1):75-83)
Relative risks of major complications of chronic kidney
disease based upon a continuous meta-analysis
Levey AS, de Jong PE, Coresh J, et al. The definition, classification, and prognosis of chronic kidney disease: a KDIGO Controversies
Conference report. Kidney Int 2010; 80:17. Copyright © 2010.
Introduction
• Until recently, the pharmacotherapy of T2DM was characterized by limited
direct beneficial CV or renal effects, with a range of deleterious side effects.
Stratton IM, et al. BMJ 2000; 321: 405–412.
Normal Glucose Reabsorption in the Kidney
SGLT2 is a high capacity, low-affinity transporter that is
expressed almost exclusively in the initial convoluted portion (S1
segment) of the proximal tubule, which accounts for 90% of the
reabsorbed glucose.
Residual glucose is reabsorbed by SLGT1, a low-capacity, high-
affinity transporter, at the end of the pars convoluta and pars
recta (S2/S3 segments) of the proximal tubule.
Zelniker, T.A. et al. J Am Coll Cardiol. 2018;72(15):1845–55
Normal Glucose Reabsorption in the Kidney
• The first identified nonselective SGLT1/SGLT2i, phlorizin, was isolated
from the root bark of apple trees in 1835.
• However, the high doses required to lower circulating glucose cause
severe diarrhea secondary to the inhibition of SGLT1 in the gut.
• SGLT2is have been shown to reduce glycosylated hemoglobin only by
approximately 0.5% to 1.0% in patients with T2DM.
Normal Glucose Reabsorption in the Kidney
• FDA has approved 4 SGLT2i for clinical use:
 Canagliflozin (Invokana):
 Dapagliflozin (Farxiga):
 Empagliflozin (Jardiance):
 Ertugliflozin (Steglatro):
• A fifth combined SGLT1 and 2 inhibitor, Sotagliflozin (Zynquista), is in
clinical development.
Zelniker and Braunwald, Cardiac Effects of SGLT2
Figure 1. morphology of human proximal tubule cell (HK2) after exposure/treatment (24hrs) with
normal (5mM)/ high glucose (33mM), k-LC (25μM) and Empagliflozin (500nM).
Figure 2. Effect of high glucose (33mM), k-FLC (25μM) and Empagliflozin (500nM)
exposure/treatment (24/48 hrs) on cytotoxicity and viability of HK2 cells.
Figure 3. Effect of high glucose (33mM), k-FLC (25μM) and Empagliflozin (500nM)
exposure/treatment (24hrs) on the apoptosis of HK2 cells.
Figure 5. Effect of high glucose (33mM), k-FLC (25μM) and Empagliflozin (500nM) exposure/treatment (24hrs) on
the gene expression of LCN2, KIM1 (HAVCR1) and IL6 in HK2 cells.
Figure 6. Expression of PeNOS/TeNOS protein in HK2 cells exposed with high glucose (HG,
33mM), free light chain (k-LC) and treated with Empagliflozin (500nM).
Figure 8. Empagliflozin restores HG induced down-regulation of SLC34A1.
Extraglycemic Effects of SGLT2 Inhibitors
Sodium glucose cotransporter 2 (sglt2) inhibitors

Sodium glucose cotransporter 2 (sglt2) inhibitors

  • 1.
    Sweet Pee: DoSodium–glucose co-transporter 2 (SGLT2) inhibitors have renal protective effects? Moh’d Sharshir, M.D. Assistant Professor of Medicine Section, Nephrology Tulane University School of Medicine
  • 2.
    Disclosure I have NOfinancial disclosure or conflicts of interest with the presented material in this presentation
  • 3.
    Introduction • Diabetes isa global health emergency with 425 million people affected in the year 2017 and a projection for 629 million by 2045. • Half develop diabetic kidney disease, and its prevalence is rising progressively in concert with the overall diabetes epidemic, largely driven by type 2 diabetes. ESRD incidence is increasing because of DM Adjusted prevalence of ESRD in the US 1996-2014 Alicic RZ, Rooney MT, Tuttle KR: Diabetic kidney disease: Challenges, progress, and possibilities. Clin J Am Soc Nephrol 12: 2032–2045, 2017 2016 Annual Data Report, Vol 2, ESRD, Ch 1 Fig 1.16
  • 4.
    Introduction • Type 2diabetes mellitus (T2DM) is a major risk factor for the development of cardiovascular (CV) and renal disease and is a key determinant of hospitalizations, morbidity, and mortality. Zelniker TA, Braunwald E. Cardiac and renal effects of sodium-glucose co-transporter 2 inhibitors in diabetes: JACC state-of-the-art review. J Am Coll Cardiol. 2018 Oct;72(15):1845–55.
  • 5.
    Diabetic CKD +Cardiovascular Disease = Hospitalization + Death 2016 Annual Data Report, Vol 1, CKD, Ch 3
  • 6.
    Am J KidneyDis. 2012;59(1):75-83) Relative risks of major complications of chronic kidney disease based upon a continuous meta-analysis Levey AS, de Jong PE, Coresh J, et al. The definition, classification, and prognosis of chronic kidney disease: a KDIGO Controversies Conference report. Kidney Int 2010; 80:17. Copyright © 2010.
  • 7.
    Introduction • Until recently,the pharmacotherapy of T2DM was characterized by limited direct beneficial CV or renal effects, with a range of deleterious side effects.
  • 8.
    Stratton IM, etal. BMJ 2000; 321: 405–412.
  • 11.
  • 12.
    SGLT2 is ahigh capacity, low-affinity transporter that is expressed almost exclusively in the initial convoluted portion (S1 segment) of the proximal tubule, which accounts for 90% of the reabsorbed glucose. Residual glucose is reabsorbed by SLGT1, a low-capacity, high- affinity transporter, at the end of the pars convoluta and pars recta (S2/S3 segments) of the proximal tubule.
  • 13.
    Zelniker, T.A. etal. J Am Coll Cardiol. 2018;72(15):1845–55
  • 14.
    Normal Glucose Reabsorptionin the Kidney • The first identified nonselective SGLT1/SGLT2i, phlorizin, was isolated from the root bark of apple trees in 1835. • However, the high doses required to lower circulating glucose cause severe diarrhea secondary to the inhibition of SGLT1 in the gut. • SGLT2is have been shown to reduce glycosylated hemoglobin only by approximately 0.5% to 1.0% in patients with T2DM.
  • 15.
    Normal Glucose Reabsorptionin the Kidney • FDA has approved 4 SGLT2i for clinical use:  Canagliflozin (Invokana):  Dapagliflozin (Farxiga):  Empagliflozin (Jardiance):  Ertugliflozin (Steglatro): • A fifth combined SGLT1 and 2 inhibitor, Sotagliflozin (Zynquista), is in clinical development.
  • 39.
    Zelniker and Braunwald,Cardiac Effects of SGLT2
  • 46.
    Figure 1. morphologyof human proximal tubule cell (HK2) after exposure/treatment (24hrs) with normal (5mM)/ high glucose (33mM), k-LC (25μM) and Empagliflozin (500nM).
  • 47.
    Figure 2. Effectof high glucose (33mM), k-FLC (25μM) and Empagliflozin (500nM) exposure/treatment (24/48 hrs) on cytotoxicity and viability of HK2 cells.
  • 48.
    Figure 3. Effectof high glucose (33mM), k-FLC (25μM) and Empagliflozin (500nM) exposure/treatment (24hrs) on the apoptosis of HK2 cells.
  • 49.
    Figure 5. Effectof high glucose (33mM), k-FLC (25μM) and Empagliflozin (500nM) exposure/treatment (24hrs) on the gene expression of LCN2, KIM1 (HAVCR1) and IL6 in HK2 cells.
  • 50.
    Figure 6. Expressionof PeNOS/TeNOS protein in HK2 cells exposed with high glucose (HG, 33mM), free light chain (k-LC) and treated with Empagliflozin (500nM).
  • 51.
    Figure 8. Empagliflozinrestores HG induced down-regulation of SLC34A1.
  • 52.
    Extraglycemic Effects ofSGLT2 Inhibitors

Editor's Notes

  • #7 Risk for end-stage kidney disease increases as proteinuria increases and estimated glomerular filtration rate (eGFR) decreases. Incidence rate ratios of end-stage renal disease (ESRD) and cardiovascular (CV) death events by baseline albuminuria and GFR levels. The table below the figure shows the multivariate adjusted risk for ESRD for each albuminuria and eGFR category, accounting for the possibility of competing events between ESRD and CV death. Abbreviation: ACR, albumin-creatinine ratio. Reproduced from Packham et al (Relative Incidence of ESRD Versus Cardiovascular Mortality in Proteinuric Type 2 Diabetes and Nephropathy: Results From the DIAMETRIC (Diabetes Mellitus Treatment for Renal Insufficiency Consortium) Database. Am J Kidney Dis. 2012;59(1):75-83) with permission of the copyright holder (National Kidney Foundation). Summary of continuous meta-analysis (adjusted RR) for general population cohorts with ACR. Mortality is reported for general population cohorts assessing albuminuria as urine ACR. Kidney outcomes are reported for general population cohorts assessing albuminuria as either urine ACR or dipstick. eGFR is expressed as a continuous variable. The three lines represent urine ACR of <30 mg/g or dipstick negative and trace (blue), urine ACR 30-299 mg/g or dipstick 1+ positive (green), and urine ACR >300 mg/g or dipstick >2+ positive (red). All results are adjusted for covariates and compared with reference point of eGFR of 95 mL/min per 1.73 m2 and ACR of <30 mg/g or dipstick negative (diamond). Each point represents the pooled RR from a meta-analysis. Solid circles indicate statistical significance compared with the reference point (p<0.05); triangles indicate non-significance. Red arrows indicate eGFR of 60 mL/min per 1.73 m2, threshold value of eGFR for the current definition of CKD
  • #8 These include proliferative retinopathy with insulin [3], edema, and heart failure hospitalizations (HHF) with thiazolidinediones [4] and hypoglycemia and CV disease-related deaths with sulfonylureas [5, 6]. A brief history of diabetes medication
  • #11 Until the advent of the sodium glucose cotransporter (SGLT2) inhibitor class of antihyperglycemic agents, the last major advance in treatment for diabetic kidney disease was reported almost 20 years ago when angiotensin receptor blockers (ARBs) compared with placebo were found to reduce risk of serum creatinine doubling or ESKD by nearly 20% mostly independent of hypertension control . Notably, risks of cardiovascular disease and death were not reduced in the ARB trials. Many subsequent studies of interventions including dual agent renin-angiotensin system blockade, bardoxolone, protein kinase C-b inhibition, erythrocyte stimulating agents, and antifibrotic and anti-inflammatory therapies failed to generate treatment advances because of adverse safety signals, lack of efficacy, or business and regulatory decisions.
  • #13 Under physiological conditions, approximately 180 g of glucose are filtered by the glomeruli each day and are normally completely reabsorbed by the SGLT (Co-transporters, SGLT1 and SGLT2) Patients with T2DM express a significantly higher number of SGLT2s in the proximal tubule than do healthy individuals (13). Consequently, glucose reabsorption from the glomerular filtrate is greatly increased in these patients.
  • #14 Normal Glucose Reabsorption in the Kidney The sodium-glucose co-transporter 2 (SGLT2) is located in the initial convoluted portion (S1 segment) of the proximal tubule and accounts for 90% of the reabsorbed glucose. Residual glucose is reabsorbed by the sodium-glucose co-transporter 1, in the distal end of the convoluted tubule (S2/S3 segments) of the proximal tubule. (Inset) Sodium-glucose co-transporters drive the sodium (Na+)-coupled glucose entry against the concentration gradient across the apical membrane. Na+ is maintained at a very low intracellular concentration by a basolateral Na+/potassium (K+)-adenosine triphosphatase (ATPase), an energy-dependent pump that pumps K+ into the cell and Na+ out of the cell. Glucose leaves the cell down its concentration gradient into the blood through facilitative glucose transporters (GLUT2). DCT ¼ distal convoluted tubule; PCT ¼ proximal convoluted tubule. Inhibition of sodium-glucose co-transporter 2 (SGLT2) (1) results in excretion of glucose and sodium (Na+) (2) in the urine. As a result of loss of body salt, the extracellular fluid volume contracts (3) and leads to a decrease of atrial natriuretic peptides, which may result in vasoconstriction of the afferent arterioles. Because glucose reabsorption is coupled with Na+ absorption, the macula densa senses an increased Na+ concentration (4), enhancing the activation of the tubuloglomerular feedback causing vasoconstriction of the afferent arteriole, which is driven primarily by adenosine-mediated signal cascades (5). The macula densa inhibits the release of renin from the juxtaglomerular cells (6), enhancing the dilation of the efferent arteriole (7). Vasoconstriction of the afferent and vasodilation of the efferent arterioles reduce the glomerular filtration rate (GFR) initially, but the reduction of the intraglomerular hydrostatic pressure represents the renoprotective effects of this drug class (8). DCT ¼ distal convoluted tubule; K+ ¼ potassium; PCT ¼ proximal convoluted tubule.
  • #15 SGLT2i are administered orally once daily because of their half-life of >10 h When the concentration of plasma glucose exceeds a threshold (200 to 250 mg/100 ml), the SGLT become saturated, and glucose is excreted in the urine; inhibition of SGLT2 intentionally lowers this threshold.
  • #16 SGLT2i are administered orally once daily because of their half-life of >10 h
  • #29 Subgroup Analysis, According to Estimated Glomerular Filtration Rate (GFR) at Screening and Albuminuria at Baseline. Shown are the primary composite outcome and renal-specific composite outcome, according to the patients’ estimated GFR at screening and urinary albumin-to-creatinine ratio (UACR) at baseline, in the canagliflozin group and the placebo group. The albumin-to-creatinine ratio was calculated with albumin measured in milligrams and creatinine measured in grams. CV denotes cardiovascular, and ESKD end-stage kidney disease.
  • #32 Forest plot for composite cardiovascular outcome in patients with type 2 diabetes with either established cardiovascular disease or cardiovascular risk factors Forest plot for the composite cardiovascular outcome in patients with eGFR < 60 mL/min/1.73 m2 with type 2 diabetes with either established cardiovascular disease or cardiovascular risk factors.
  • #33 Forest plot for the composite renal outcome in patients with type 2 diabetes with either established cardiovascular disease or cardiovascular risk factors. Forest plot for the composite renal outcome in patients with eGFR < 60 mL/min/1.73 m2 with type 2 diabetes with either established cardiovascular disease or cardiovascular risk factors.
  • #45 Figure 3. Dapagliflozin limits ultrastructural podocyte damage in mice with protein overload. Representative electron micrographs of glomeruli from control mouse and BSA-mice treated with vehicle, dapagliflozin (DAPA), or ACE inhibitor (ACEi). Focal areas of podocyte damage with effacement of foot processes are indicated by arrowheads in a mouse treated with BSA + vehicle. Scale bars: 2,000 nm.
  • #47 Proliferation of HK2 cells was decreased upon exposure of high glucose and k-FLC. Treatment of cells with Empagliflozin slightly restored normal proliferation of cells.
  • #48 Cell cytotoxicity not significantly changed upon empagliflozin treatment. No change in the cell viability was observed with empagliflozin treatment.
  • #49 Empagliflozin slightly increased the apoptosis of proximal tubule cells; however effect was not significant.
  • #50 Kidney injury markers LCN2 (Lipocalin 2 or NGAL) and HAVCR1 (KIM1) as well as IL6 gene expressions were increased upon empagliflozin treatment for 24 hrs.
  • #51 Empagliflozin increased the expression of phospho-eNOS and e-NOS proteins.
  • #55 (A) Changes in total body weight; (B) waist circumference; and (C) body composition over 102 weeks. *Data are adjusted mean changes from baseline value and 95% CI derived from a longitudinal repeated-measures mixed model with fixed effects for treatment, gender, week, rescue and week-by-treatment interaction, and fixed covariates for baseline value and week-by-baseline value and include data after rescue therapy. DAPA, dapagliflozin; MET, metformin; PBO, placebo.
  • #56 Changes in bone mineral density (BMD) at 102 weeks in (A) lumbar spine, (B) femoral neck and (C) total hip regions. *Data are adjusted percent change from baseline and 95% CI derived from a mixed model with fixed effects for treatment, gender, week, rescue and week-by-treatment interaction, and fixed covariates for baseline value and week-by-baseline value and include data after rescue therapy. Bone Mineral Density. No significant differences between dapagliflozin and placebo in BMD adjusted mean percent change from baseline at week 102 were found in any of the three regions: 0.22 percentage points (95% CI −0.89, 1.34) for lumbar spine; −0.94 percentage points (95% CI −2.21, 0.35) for femoral neck; and −0.45 percentage points (95% CI −1.32, 0.43) for total hip
  • #57 Effect of luseogliflozin on the serum uric acid (SUA) level. Changes in the SUA level from the baseline after a single dose (A, n = 3–14) and after multiple doses (B, n = 8) are shown. Data are mean ± SEM. **p < 0.01 vs placebo (0 mg) (Dunnett’s test) Effects of luseogliflozin on the urinary excretion rate (UEUA) and the renal clearance (CLUA) of uric acid. Changes in UEUA and CLUA from the baseline after a single dose (A and C, n = 3–14) and after multiple doses (B and D, n = 8) are shown. Data are mean ± SEM. **p < 0.01 vs placebo (0 mg) (Dunnett’s test) Proposed model for uricosuric effect of SGLT2 inhibitors by glycosuria-induced uric acid secretion via GLUT9 isoform 2 or any other functionally similar transporters at the proximal tubule and inhibition of uric acid uptake via GLUT9 isoform 2 at the collecting duct of renal tubule
  • #60 Attenuated fbrosis in empaglifozin-treated atria and ventricles. Gross hearts (a), histological sections (b), Masson trichrome staining of atrial tissue (c) and ventricular tissue (shown in cross, longitudinal sections, and peri-vascular sections) (d) of high-fat-fed wild type (WKY), spontaneous hypertensive rats (SHR), and empaglifozin-treated SHR (EMPA). e The numerical data of the heart weight was shown. The quantifed fbrosis area shows signifcant increase in SHR compared to WKY and signifcant attenuation by EMPA, in both atrial (f *P=0.0045; # P