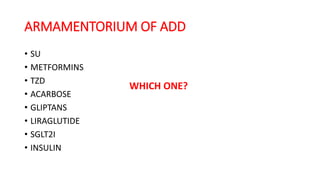
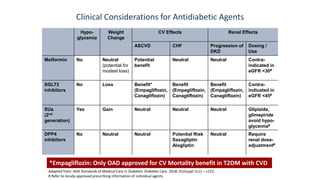
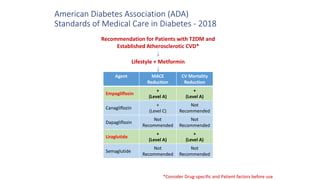
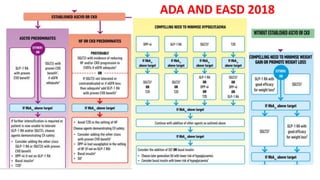
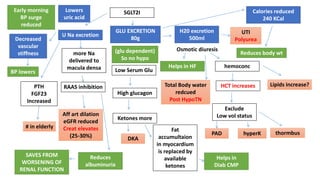
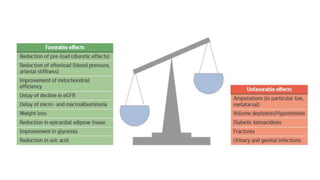
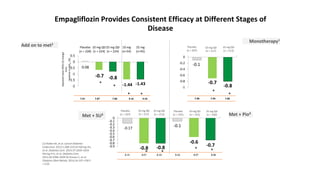
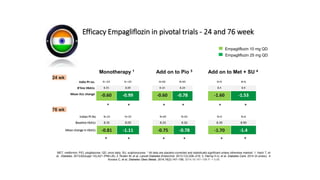
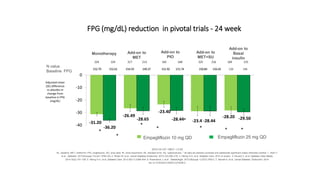
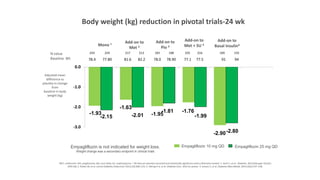
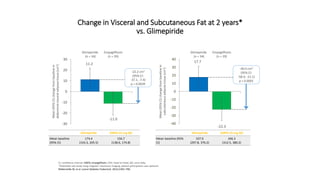
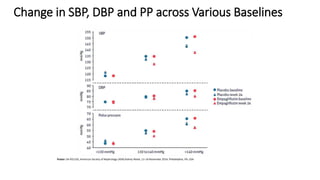
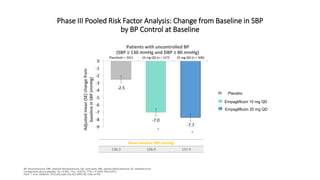
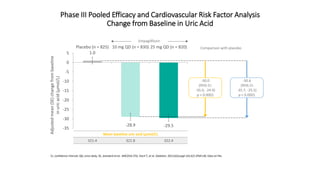
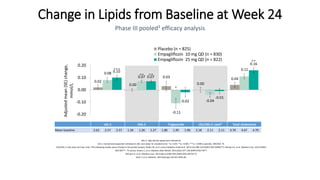
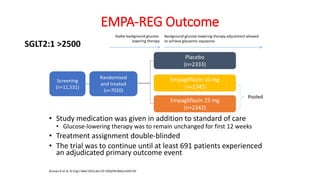
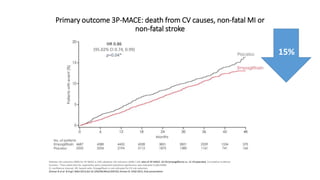
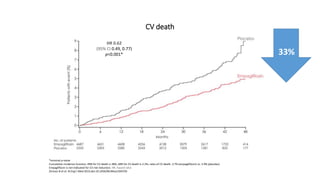
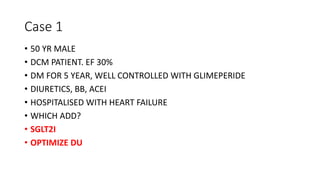
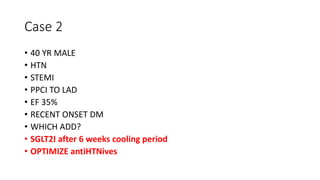
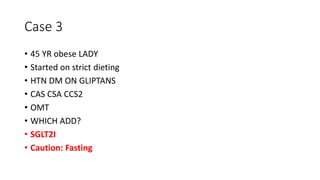
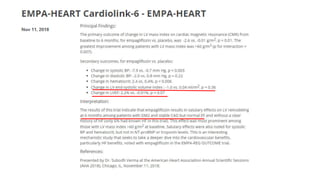
SGLT2i in the management of Diabetes
DR. DIBBENDHU KHANRA
MD DNB MRCP (UK)
DM CARDIOLOGY
INTERVENTIONAL CARDIOLOGIST
AIIMS, RISHIKESH
My Journey so far..
NO CONFLICT OF INTERST
Case 1
• 50 YR MALE
• DCM PATIENT. EF 30%
• DM FOR 5 YEAR, WELL CONTROLLED WITH GLIMEPERIDE
• DIURETICS, BB, ACEI
• HOSPITALISED WITH HEART FAILURE
• WHICH ADD?
Case 2
• 40 YR MALE
• HTN
• STEMI
• PPCI TO LAD
• EF 35%
• RECENT ONSET DM
• WHICH ADD?
Case 3
• 45 YR obese LADY
• Started on strict dieting
• HTN DM ON GLIPTANS
• CAS CSA CCS2
• OMT
• WHICH ADD?
Framingham Offspring Study
Ingelsson E et al. Diabetes. 2007 Jun;56(6):1718-26.
Patients without
DM / Met-S
Patients with
Diabetes
Prevalence of
Subclinical CVD
29.8% 70.4%
Inferences of Study Findings
 Over 2/3rd of patients of DM have Subclinical CVD
 DM ↑ses the Risk of Subclinical CVD by 4.3-fold
(age- and sex-adjusted Odds Ratio: 4.33, p<0.0001)
 Subclinical CVD ↑ses the Risk of CV event by ≈2-fold
HFrEF: Hazard Ratio 1.6
95% CI 1.44 - 1.77
p<0.0001
No diabetes (HFrEF)
Cumulativeincidence(%)
60
40
20
0
0 0.5 1 1.5 2 2.5 3 3.5
Follow-up (years)
Diabetes
(HFrEF)
No diabetes (HFpEF)
Diabetes (HFpEF)
Diabetes Increases Risk of
Hospitalization or Death due to Heart-failure
HFrEF: heart failure with reduced ejection fraction
HFpEF: heart failure with preserved ejection fraction
HFpEF: Hazard Ratio 2.0
95% CI 1.70 - 2.36
p<0.0001
MacDonald et al. Eur Heart J 2008;29:1377-85.
ARMAMENTORIUM OF ADD
• SU
• METFORMINS
• TZD
• ACARBOSE
• GLIPTANS
• LIRAGLUTIDE
• SGLT2I
• INSULIN
WHICH ONE?
Hypo-
glycemia
Weight
Change
CV Effects Renal Effects
ASCVD CHF Progression of
DKD
Dosing /
Use
Metformin No Neutral
(potential for
modest loss)
Potential
benefit
Neutral Neutral Contra-
indicated in
eGFR <30#
SGLT2
inhibitors
No Loss Benefit*
(Empagliflozin,
Canagliflozin)
Benefit
(Empagliflozin,
Canagliflozin)
Benefit
(Empagliflozin,
Canagliflozin)
Contra-
indicated in
eGFR <45#
SUs
(2nd
generation)
Yes Gain Neutral Neutral Neutral Glipizide,
glimepiride
avoid hypo-
glycemia#
DPP4
inhibitors
No Neutral Neutral Potential Risk
Saxagliptin
Alogliptin
Neutral Require
renal dose-
adjustment#
Clinical Considerations for Antidiabetic Agents
*Empagliflozin: Only OAD approved for CV Mortality benefit in T2DM with CVD
Adapted from: ADA Standards of Medical Care in Diabetes. Diabetes Care. 2018; 41(Suppl 1):s1 – s153.
# Refer to locally approved prescribing information of individual agents
American Diabetes Association (ADA)
Standards of Medical Care in Diabetes - 2018
Recommendation for Patients with T2DM and
Established Atherosclerotic CVD*
Agent MACE
Reduction
CV Mortality
Reduction
Empagliflozin
+
(Level A)
+
(Level A)
Canagliflozin
+
(Level C)
Not
Recommended
Dapagliflozin
Not
Recommended
Not
Recommended
Liraglutide
+
(Level A)
+
(Level A)
Semaglutide
Not
Recommended
Not
Recommended
*Consider Drug-specific and Patient factors before use
Lifestyle + Metformin
ADA AND EASD 2018
SGLT2I
GLU EXCRETION
80g
U Na excretion
H20 excretion
500ml
Osmotic diuresis
Helps in HF hemoconc
HCT increases
Exclude
Low vol status
PAD hyperK
Low Serum Glu
(glu dependent)
So no hypo
High glucagon
Calories reduced
240 KCal
Reduces body wt
Total Body water
redcued
Post HypoTN
more Na
delivered to
macula densa
RAAS inhibition
Aff art dilation
eGFR reduced
Creat elevates
(25-30%) thormbus
PTH
FGF23
Increased
# in elderly
Ketones more
DKA
Fat
accumultaion
in myocardium
is replaced by
available
ketones
Helps in
Diab CMP
Decreased
vascular
stiffness
Reduces
albuminuria
UTI
Polyurea
BP lowers
Lowers
uric acid
Early morning
BP surge
reduced
Lipids increase?
SAVES FROM
WORSENING OF
RENAL FUNCTION
Met + Pio4
Empagliflozin Provides Consistent Efficacy at Different Stages of
Disease
-0.1
-0.7
-0.8-1
-0.8
-0.6
-0.4
-0.2
0
0.08
-0.7 -0.8
-1.44 -1.43-2
-1.5
-1
-0.5
0
0.5
Placebo
(n = 228)
10 mg QD
(n = 224)
25 mg QD
(n = 224)
10 mg
(n=54)
25 mg
(n=45)
Adjustedmean(95%CI)change
from
baselineinHbA1c(%)
Monotherapy1
7.91 7.87 7.86 9.16 9.18
Placebo
(n = 207)
10 mg QD
(n = 217)
25 mg QD
(n = 213)
Add on to met2
7.90 7.94 7.86
(1) Roden M, et al. Lancet Diabetes
Endocrinol. 2013;1:208–219 (2) Häring HU,
et al. Diabetes Care. 2014;37:1650–1659.
Häring H-U, et al. Diabetes Care.
2013;36:3396–3404 (4) Kovacs C, et al.
Diabetes Obes Metab. 2014;16:147–158 P:
< 0.05
-0.17
-0.8 -0.8
-0.1
-0.6
-0.7-0.9
-0.8
-0.7
-0.6
-0.5
-0.4
-0.3
-0.2
-0.1
0
Placebo
(n = 207)
10 mg QD
(n = 217)
25 mg QD
(n = 213)
Placebo
(n = 155)
10 mg QD
(n = 151)
25 mg QD
(n = 160)
Met + SU3
8.15 8.07 8.10 8.16 8.07 8.06
*
*
* *
*
*
* *
* *
Efficacy Empagliflozin in pivotal trials - 24 and 76 week
Monotherapy 1 Add on to Pio 3 Add on to Met + SU 4
India Pt no. N =24 N =29 N=69 N=65 N=9 N=6
B’line HbA1c 8.35 8.09 8.14 8.24 8.4 8.9
Mean A1c change -0.60 -0.99 -0.60 -0.78 -1.60 -1.53
MET, metformin; PIO, pioglitazone; QD, once daily; SU, sulphonylurea. * All data are placebo-corrected and statistically significant unless otherwise marked. 1. Hach T, et
al. Diabetes. 2013;62(suppl 1A);A21 (P69-LB); 2. Roden M, et al. Lancet Diabetes Endocrinol. 2013;1(3):208–219; 3. Häring H-U, et al. Diabetes Care. 2014 (in press); 4.
Kovacs C, et al. Diabetes Obes Metab. 2014;16(2):147–158; 2014;16:147–158 P: < 0.05
Empagliflozin 10 mg QD
Empagliflozin 25 mg QD
Indian Pt No N=24 N=29 N=69 N=65 N=9 N=6
Baseline HbA1c 8.35 8.09 8.24 8.26 8.39 8.90
Mean change in HbA1c -0.81 -1.11 -0.75 -0.78 -1.70 -1.4
24 wk
76 wk
* * * * * *
******
FPG (mg/dL) reduction in pivotal trials - 24 week
-31.20
-26.49
-23.40
-23.4
-28.20
-36.20
-28.65 -28.44 -28.44
-29.50
-40
-30
-20
-10
0
Adjusted mean
(SE) difference
vs placebo in
change from
baseline in FPG
(mg/dL)
2014;16:147–158 P: < 0.05
BL, baseline; MET, metformin; PIO, pioglitazone; QD, once daily; RI, renal impairment; SE, standard error; SU, sulphonylurea. * All data are placebo-corrected and statistically significant unless otherwise marked. 1. Hach T,
et al. Diabetes. 2013;62(suppl 1A);A21 (P69-LB); 2. Roden M, et al. Lancet Diabetes Endocrinol. 2013;1(3):208–219; 3. Häring H-U, et al. Diabetes Care. 2014 (in press); 4. Kovacs C, et al. Diabetes Obes Metab.
2014;16(2):147–158; 5. Häring H-U, et al. Diabetes Care. 2013;36(11):3396–404; 6. Rosenstock J, et al. Diabetologia. 2013;56(suppl 1);S372 (P931); 7. Barnett A, et al, Lancet Diabetes Endocrinol. 2014;
doi:10.1016/S2213-8587(13)70208-0.
Monotherapy Add-on to
MET
Add-on to
PIO
Add-on to
MET+SU
N value
Baseline FPG
224 224 217 213 165 168 225 216 169 155
152.79 152.61 154.59 149.37 151.92 151.74 150.84 156.42 138 146
Empagliflozin 10 mg QD Empagliflozin 25 mg QD
*
*
*
*
*
* * *
Add-on to
Basal
insulin
-1.93
-1.63
-1.95
-1.76
-2.90
-2.15 -2.01
-1.81
-1.99
-2.80
-3.0
-2.0
-1.0
0.0
Empagliflozin is not indicated for weight loss.
Weight change was a secondary endpoint in clinical trials
Adjusted mean
difference vs
placebo in change
from
baseline in body
weight (kg)
N value
Baseline Wt
Body weight (kg) reduction in pivotal trials-24 wk
224 224 217 213 165 168 225 216 169 155
78.4 77.80 81.6 82.2 78.0 78.90 77.1 77.5 91 94
Mono 1 Add-on to
Met 2
Add-on to
Pio 3
Add-on to
Met + SU 4
MET, metformin; PIO, pioglitazone; QD, once daily; SU, sulphonylurea. * All data are placebo-corrected and statistically significant unless otherwise marked. 1. Hach T, et al. Diabetes. 2013;62(suppl 1A);A21
(P69-LB); 2. Roden M, et al. Lancet Diabetes Endocrinol. 2013;1(3):208–219; 3. Häring H-U, et al. Diabetes Care. 2014 (in press); 4. Kovacs C, et al. Diabetes Obes Metab. 2014;16(2):147–158;
Empagliflozin 10 mg QD Empagliflozin 25 mg QD
Add-on to
Basal insulin4
17.7
-22.3
-40
-30
-20
-10
0
10
20
30
40
11.2
-11.0
-30
-20
-10
0
10
20
30
CI, confidence interval; EMPA, empagliflozin; H2H, head-to-head; QD, once daily.
*Dedicated sub-study using magnetic resonance imaging; patient participation was optional.
Ridderstråle M, et al. Lancet Diabetes Endocrinol. 2014;2:691‒700.
Change in Visceral and Subcutaneous Fat at 2 years*
vs. Glimepiride
Glimepiride
(n = 34)
Empagliflozin
(n = 39)
Glimepiride EMPA 25 mg QD
Mean baseline
(95% CI)
174.4
(143.3, 205.5)
156.7
(138.6, 174.8)
Glimepiride EMPA 25 mg QD
Mean baseline (95%
CI)
337.0
(297.8, 376.2)
346.3
(312.5, 380.2)
-22.2 cm3
(95% CI:
-37.1, -7.4)
p = 0.0039
-40.0 cm3
(95% CI:
-58.9, -21.1)
p < 0.0001
Mean(95%CI)changefrombaselinein
abdominalvisceraladiposetissue(cm3)
Mean(95%CI)changefrombaselinein
subcutaneousadiposetissue(cm3)
Glimepiride
(n = 34)
Empagliflozin
(n = 39)
Poster: SA-PO1101, American Society of Nephrology (ASN) Kidney Week, 11–16 November 2014, Philadelphia, PA, USA
Change in SBP, DBP and PP across Various Baselines
-2.5
-7.0
-7.7-9
-8
-7
-6
-5
-4
-3
-2
-1
0
Placebo(n = 501) 10 mg QD (n = 517) 25 mg QD (n = 506)
Adjustedmean(SE)changefrom
baselineinSBP(mmHg)
BP, blood pressure; DBP, diastolic blood pressure; QD, once daily; SBP, systolic blood pressure; SE, standard error.
Comparisons versus placebo: *p < 0.001. **p = 0.0152. ***p = 0.1059. FAS (LOCF).
Hach T, et al. Diabetes. 2013;62(suppl 1A):A21 (P69-LB). Data on file.
Phase III Pooled Risk Factor Analysis: Change from Baseline in SBP
by BP Control at Baseline
Patients with uncontrolled BP
(SBP ≥ 130 mmHg and DBP ≥ 80 mmHg)
Mean baseline SBP (mmHg)
136.3 136.9 137.4
*
*
Empagliflozin 10 mg QD
Empagliflozin 25 mg QD
Placebo
CI, confidence interval; QD, once daily; SE, standard error. ANCOVA (TS). Hach T, et al. Diabetes. 2013;62(suppl 1A):A21 (P69-LB). Data on file.
Phase III Pooled Efficacy and Cardiovascular Risk Factor Analysis
Change from Baseline in Uric Acid
1.0
-28.9 -29.5
-35
-30
-25
-20
-15
-10
-5
0
5
Placebo (n = 825) 10 mg QD (n = 830) 25 mg QD (n = 820)
Adjustedmean(SE)changefrombaseline
inuricacid(μmol/L)
Mean baseline uric acid (μmol/L)
321.4 321.8 322.4
-30.0
(95% CI:
-35.0, -24.9)
p < 0.0001
-30.6
(95% CI:
-35.7, -25.5)
p < 0.0001
Empagliflozin
Comparison with placebo
CI, confidence interval; gMean, geometric mean; SD, standard deviation; UACR, urine albumin-to-creatinine ratio.
*p < 0.001. **p < 0.01. Adjusted gMean based on ANCOVA with LOCF imputation (95% CI); data following a change in anti-hypertensive medication and after glycaemic rescue therapy were excluded.
Cherney D, et al. Abstract accepted at ADA 2014.
Effect of Empagliflozin on Microalbuminuria
Change in UACR at Week 24
Placebo Empagliflozin 10 mg Empagliflozin 25 mg
Mean (SD) baseline UACR (gMean) 68.2 (64.9) 64.6 69.3
Mean (95% CI) UACR at Week 24 (gMean) 53.6 (46.5, 61.7) 37.6 (32.5, 43.4) 40.0 (34.8, 46.0)
P < 0.001 P < 0.01
gMeanchangeinUACRfrom
baseline
(mg/gcreatinine)
Ratio of relative change vs placebo at
Week 24
Empagliflozin
-14.6
-27.0
-29.3
-35
-30
-25
-20
-15
-10
-5
0
10 mg QD
(n = 141)
Placebo
(n = 147)
25 mg QD
(n = 150)
Hypoglycaemic events
Phase III safety and tolerability analysis
MET, metformin; PIO, pioglitazone; QD, once daily; SU, sulphonylurea.
†Confirmed events; plasma glucose ≤ 70 mg/dL and/or requiring assistance 1. Hach T, et al., 2. Roden M, et al., 3. Häring H-U, et al.
Diabetes. 2013;(suppl 1):(P69-LB, 1085-P and 1092-P, respectively);
4. Kovacs C, et al. Diabetes Obes Metab. 2014;16:147–158.
0.8 0.4 0.5
1.8
2.9
8.4
1.2
0.4
1.8 1.2
5.2
16.1
1.3
0.4
1.4
2.4
4.0
11.5
0
4
8
12
16
20
Pooled data
excl. SU
background
Monotherapy Add-on to MET Add-on to PIO Pooled data
incl. SU
background
Add-on to MET
+ SU
Percentageofpatientswith
confirmedhypoglycaemia†(%) Placebo
Empagliflozin 10 mg QD
Empagliflozin 25 mg QD
1
2 3 4
1 1
Events consistent with UTI-Stratified by gender
Phase III pooled† safety and tolerability analysis
QD, once daily; UTI, urinary tract infection.
†The following studies were included in the pooled analysis: Roden M, et al. Lancet Diabetes Endocrinol. 2013;1(3):208–219 (EMPA-REG MONO); Häring H-U, et
al. Diabetes Care. 2014 (EMPA-REG MET - in press); Kovacs C, et al. Diabetes Obes Metab. 2014;16(2):147–158 (EMPA-REG PIO;
Häring H-U, et al. Diabetes Care. 2013;36(11):3396–404 (EMPA-REG METSU);
Kim G, et al. Diabetes. 2013;(suppl 1):(P74-LB).
Male vs female patients
8.2
13.0
3.8
9.3
18.5
1.9
7.5
15.9
1.1
0
5
10
15
20
25
30
All patients with events Female patients Male patients
Patientswithevents
consistentwithUTI(%) Placebo
(n = 401/424)
Empagliflozin 10 mg QD
(n = 367/463)
Events consistent with UTI
Distribution of events severity
Phase III pooled† safety and tolerability analysis
QD, once daily; UTI, urinary tract infection. The intensity of the adverse event was to be judged by the investigator as mild
(awareness of signs or symptoms which were easily tolerated), moderate (enough discomfort to cause interference with usual activity)
or severe (incapacitating or causing inability to work or to perform usual activities).
†The following studies were included in the pooled analysis: Roden M, et al. Lancet Diabetes Endocrinol. 2013;1(3):208–219 (EMPA-REG MONO); Häring H-U, et al. Diabetes Care. 2014 (EMPA-REG MET - in press); Kovacs
C, et al. Diabetes Obes Metab. 2014;16(2):147–158 (EMPA-REG PIO;
Häring H-U, et al. Diabetes Care. 2013;36(11):3396–404 (EMPA-REG METSU);
Kim G, et al. Diabetes. 2013;(suppl 1):(P74-LB).
6.9
1.1
0.2
7.5
1.7
0.1
6.7
0.9
0
0
1
2
3
4
5
6
7
8
Mild Moderate Severe
Patients(%)
Placebo
(n = 825)
Empagliflozin 10 mg QD
(n = 830)
Empagliflozin 25 mg QD
(n = 822)
For Internal use only
0.02
0.00
0.03
0.00
0.04
0.08
0.07
-0.11
-0.04
0.110.10
0.07
-0.02
-0.01
0.16
-0.20
-0.10
0.00
0.10
0.20Adjustedmean(SE)change,
mmol/L
Placebo (n = 825)
Empagliflozin 10 mg QD (n = 830)
Empagliflozin 25 mg QD (n = 822)
Change in Lipids from Baseline at Week 24
Phase III pooled‡ efficacy analysis
HDL-C, high-density lipoprotein cholesterol;
LDL-C, low-density lipoprotein cholesterol; QD, once daily; SE, standard error. *p < 0.05; **p < 0.001; ***p = 0.008 vs placebo. ANCOVA. TS.
†LDL/HDL-C ratio does not have units. ‡The following studies were included in the pooled analysis: Roden M, et al. Lancet Diabetes Endocrinol. 2013;1(3):208–219 (EMPA-REG MONO); Häring H-U, et al. Diabetes Care. 2014 (EMPA-
REG MET - Tin press); Kovacs C, et al. Diabetes Obes Metab. 2014;16(2):147–158 (EMPA-REG PIO;
Häring H-U, et al. Diabetes Care. 2013;36(11):3396–404 (EMPA-REG METSU);
Hach T, et al. Diabetes. 2013;62(suppl 1A):A21 (P69-LB).
LDL-C HDL-C Triglyceride LDL/HDL-C ratio† Total cholesterol
Mean baseline 2.62 2.57 2.57 1.26 1.26 1.27 1.86 1.95 1.96 2.18 2.11 2.11 4.70 4.67 4.70
***
****
*
**
EMPA-REG Outcome
• Study medication was given in addition to standard of care
• Glucose-lowering therapy was to remain unchanged for first 12 weeks
• Treatment assignment double-blinded
• The trial was to continue until at least 691 patients experienced
an adjudicated primary outcome event
Zinman B et al. N Engl J Med 2015;doi:10.1056/NEJMoa1504720
Screening
(n=11,531)
Randomised
and treated
(n=7020)
Pooled
Stable background glucose-
lowering therapy
Background glucose-lowering therapy adjustment allowed
to achieve glycaemic equipoise
Empagliflozin 10 mg
(n=2345)
Empagliflozin 25 mg
(n=2342)
Placebo
(n=2333)
SGLT2:1 >2500
Primary outcome 3P-MACE: death from CV causes, non-fatal MI or
non-fatal stroke
Relative risk reduction (RRR) for 3P-MACE is 14%; absolute risk reduction (ARR) 1.6% rates of 3P-MACE: 10.5% (empagliflozin) vs. 12.1% (placebo). Cumulative incidence
function. *Two-sided tests for superiority were conducted (statistical significance was indicated if p≤0.0498)
CI, confidence interval; HR, hazard ratio. Empagliflozin is not indicated for CV risk reduction
Zinman B et al. N Engl J Med 2015;doi:10.1056/NEJMoa1504720; Zinman B. EASD 2015; Oral presentation
HR 0.86
(95.02% CI 0.74, 0.99)
p=0.04* 15%
CV death
*nominal p-value
Cumulative incidence function. RRR for CV death is 38%; ARR for CV death is 2.2%; rates of CV death: 3.7% (empagliflozin) vs. 5.9% (placebo).
Empagliflozin is not indicated for CV risk reduction. HR, hazard ratio
Zinman B et al. N Engl J Med 2015;doi:10.1056/NEJMoa1504720
HR 0.62
(95% CI 0.49, 0.77)
p<0.001* 33%
Hospitalisation for Heart Failure
*Nominal p-value
Cumulative incidence function. HR, hazard ratio
RRR for HHF is 35%; ARR for HHF is 1.4%, rates of HHF: 2.7% (empagliflozin) vs. 4.1% (placebo)
Zinman B et al. N Engl J Med 2015;doi:10.1056/NEJMoa1504720
HR 0.65
(95% CI 0.50, 0.85);
p=0.002*
35%
All-cause Mortality
*Nominal p-value. Kaplan–Meier estimate
RRR for all-cause mortality is 32%; ARR for all-cause mortality is 2.6%; rates of all-cause mortality: 5.7% (empagliflozin) vs. 8.3% (placebo)
Empagliflozin is not indicated for CV risk reduction. HR, hazard ratio
Zinman B et al. N Engl J Med 2015;doi:10.1056/NEJMoa1504720
HR 0.68
(95% CI 0.57, 0.82)
p<0.001* 35%
New Onset or Worsening Nephropathy
Kaplan-Meier estimate. Patients treated with at least one dose of study drug. Hazard ratios are based on Cox regression analyses. HR, hazard ratio; CI, confidence
interval.
39%
RRR
New Onset or Worsening Nephropathy:
Consistent Benefit for Both Doses
Kaplan-Meier estimate. Patients treated with at least one dose of study drug. Hazard ratios are based on Cox regression analyses. HR, hazard ratio; CI, confidence
interval.
New Onset of Macroalbuminuria
Kaplan-Meier estimate in treated set.
Hazard ratios are based on Cox regression analyses.
HR 0.62
(95% CI 0.54, 0.72)
p<0.0001
38%
RRR
First initiation of continuous renal replacement therapy or
dialysis
Kaplan-Meier estimate in treated set.
Hazard ratios are based on Cox regression analyses.
HR 0.45
(95% CI 0.21, 0.97)
p=0.0409
55%
RRR
Declare TIMI 58
• Dapagliflozin
• Bladder Ca rare
• 3PMACE 15% DROP
• HHF 30% DROP
• CV DEATH NOT STATISTICALLY SIGN DROP
• CVD REAL ongoing
SGLT2:1 >1200
CANVAS
• Canaglifozin
• Hyperkalemia
• Bone # NNH 1/96 (3 yrs)
• Amputation NNH 1/115 (3 yrs)
• 3P MACE, HHF, CV death none statistically significant
• ONGOING CREDENCE
• FDA Recently approved in HF
SGLT2:1 >250
IN THE PIPELINE
Case 1
• 50 YR MALE
• DCM PATIENT. EF 30%
• DM FOR 5 YEAR, WELL CONTROLLED WITH GLIMEPERIDE
• DIURETICS, BB, ACEI
• HOSPITALISED WITH HEART FAILURE
• WHICH ADD?
• SGLT2I
• OPTIMIZE DU
Case 2
• 40 YR MALE
• HTN
• STEMI
• PPCI TO LAD
• EF 35%
• RECENT ONSET DM
• WHICH ADD?
• SGLT2I after 6 weeks cooling period
• OPTIMIZE antiHTNives
Case 3
• 45 YR obese LADY
• Started on strict dieting
• HTN DM ON GLIPTANS
• CAS CSA CCS2
• OMT
• WHICH ADD?
• SGLT2I
• Caution: Fasting
BEST CLINICAL PRACTICE: CAUTION!
• Elderly
• Moderate to Severe CKD (eGFR <45mL/min/1.73 m2)
• HYPERKALEMIA
• H/O DKA
• Acute stressful states
• Hypotension
• Risk of volume depletion (diuretics)
• Complicated UTIs: temporary discontinuation recommended
• Conditions of fasting: precipitation of DKA
• ABPI<0.9
• Osteoposis (DEXA SCAN), History of bone #
Adapted: Rajput R, Ved J. Diabetes Metab Syndr. 2017 Mar 31. pii: S1871-4021(17)30016-4.
NOT TO WORRY IF
• Creat increases by <25%
• Post hypoTN
• Polyurea
• Hct increases by <25%
• Lipids increases
Summary
• 1st choice in cardiac patients
• Class effect in HF patients
• No hypoglycemia
• HBAIC reduction
• Prevents renal deterioration
• Reduces uric acid
• Reduces BP. Prevents LV remodelling
• Also add-ons
• Practice caution. In elderly
• Not to worry if creat increases initially
Thank You!

SGLT2i

  • 1.
    SGLT2i in themanagement of Diabetes DR. DIBBENDHU KHANRA MD DNB MRCP (UK) DM CARDIOLOGY INTERVENTIONAL CARDIOLOGIST
  • 2.
  • 3.
  • 4.
  • 5.
    Case 1 • 50YR MALE • DCM PATIENT. EF 30% • DM FOR 5 YEAR, WELL CONTROLLED WITH GLIMEPERIDE • DIURETICS, BB, ACEI • HOSPITALISED WITH HEART FAILURE • WHICH ADD?
  • 6.
    Case 2 • 40YR MALE • HTN • STEMI • PPCI TO LAD • EF 35% • RECENT ONSET DM • WHICH ADD?
  • 7.
    Case 3 • 45YR obese LADY • Started on strict dieting • HTN DM ON GLIPTANS • CAS CSA CCS2 • OMT • WHICH ADD?
  • 8.
    Framingham Offspring Study IngelssonE et al. Diabetes. 2007 Jun;56(6):1718-26. Patients without DM / Met-S Patients with Diabetes Prevalence of Subclinical CVD 29.8% 70.4% Inferences of Study Findings  Over 2/3rd of patients of DM have Subclinical CVD  DM ↑ses the Risk of Subclinical CVD by 4.3-fold (age- and sex-adjusted Odds Ratio: 4.33, p<0.0001)  Subclinical CVD ↑ses the Risk of CV event by ≈2-fold
  • 9.
    HFrEF: Hazard Ratio1.6 95% CI 1.44 - 1.77 p<0.0001 No diabetes (HFrEF) Cumulativeincidence(%) 60 40 20 0 0 0.5 1 1.5 2 2.5 3 3.5 Follow-up (years) Diabetes (HFrEF) No diabetes (HFpEF) Diabetes (HFpEF) Diabetes Increases Risk of Hospitalization or Death due to Heart-failure HFrEF: heart failure with reduced ejection fraction HFpEF: heart failure with preserved ejection fraction HFpEF: Hazard Ratio 2.0 95% CI 1.70 - 2.36 p<0.0001 MacDonald et al. Eur Heart J 2008;29:1377-85.
  • 10.
    ARMAMENTORIUM OF ADD •SU • METFORMINS • TZD • ACARBOSE • GLIPTANS • LIRAGLUTIDE • SGLT2I • INSULIN WHICH ONE?
  • 11.
    Hypo- glycemia Weight Change CV Effects RenalEffects ASCVD CHF Progression of DKD Dosing / Use Metformin No Neutral (potential for modest loss) Potential benefit Neutral Neutral Contra- indicated in eGFR <30# SGLT2 inhibitors No Loss Benefit* (Empagliflozin, Canagliflozin) Benefit (Empagliflozin, Canagliflozin) Benefit (Empagliflozin, Canagliflozin) Contra- indicated in eGFR <45# SUs (2nd generation) Yes Gain Neutral Neutral Neutral Glipizide, glimepiride avoid hypo- glycemia# DPP4 inhibitors No Neutral Neutral Potential Risk Saxagliptin Alogliptin Neutral Require renal dose- adjustment# Clinical Considerations for Antidiabetic Agents *Empagliflozin: Only OAD approved for CV Mortality benefit in T2DM with CVD Adapted from: ADA Standards of Medical Care in Diabetes. Diabetes Care. 2018; 41(Suppl 1):s1 – s153. # Refer to locally approved prescribing information of individual agents
  • 12.
    American Diabetes Association(ADA) Standards of Medical Care in Diabetes - 2018 Recommendation for Patients with T2DM and Established Atherosclerotic CVD* Agent MACE Reduction CV Mortality Reduction Empagliflozin + (Level A) + (Level A) Canagliflozin + (Level C) Not Recommended Dapagliflozin Not Recommended Not Recommended Liraglutide + (Level A) + (Level A) Semaglutide Not Recommended Not Recommended *Consider Drug-specific and Patient factors before use Lifestyle + Metformin
  • 13.
  • 16.
    SGLT2I GLU EXCRETION 80g U Naexcretion H20 excretion 500ml Osmotic diuresis Helps in HF hemoconc HCT increases Exclude Low vol status PAD hyperK Low Serum Glu (glu dependent) So no hypo High glucagon Calories reduced 240 KCal Reduces body wt Total Body water redcued Post HypoTN more Na delivered to macula densa RAAS inhibition Aff art dilation eGFR reduced Creat elevates (25-30%) thormbus PTH FGF23 Increased # in elderly Ketones more DKA Fat accumultaion in myocardium is replaced by available ketones Helps in Diab CMP Decreased vascular stiffness Reduces albuminuria UTI Polyurea BP lowers Lowers uric acid Early morning BP surge reduced Lipids increase? SAVES FROM WORSENING OF RENAL FUNCTION
  • 18.
    Met + Pio4 EmpagliflozinProvides Consistent Efficacy at Different Stages of Disease -0.1 -0.7 -0.8-1 -0.8 -0.6 -0.4 -0.2 0 0.08 -0.7 -0.8 -1.44 -1.43-2 -1.5 -1 -0.5 0 0.5 Placebo (n = 228) 10 mg QD (n = 224) 25 mg QD (n = 224) 10 mg (n=54) 25 mg (n=45) Adjustedmean(95%CI)change from baselineinHbA1c(%) Monotherapy1 7.91 7.87 7.86 9.16 9.18 Placebo (n = 207) 10 mg QD (n = 217) 25 mg QD (n = 213) Add on to met2 7.90 7.94 7.86 (1) Roden M, et al. Lancet Diabetes Endocrinol. 2013;1:208–219 (2) Häring HU, et al. Diabetes Care. 2014;37:1650–1659. Häring H-U, et al. Diabetes Care. 2013;36:3396–3404 (4) Kovacs C, et al. Diabetes Obes Metab. 2014;16:147–158 P: < 0.05 -0.17 -0.8 -0.8 -0.1 -0.6 -0.7-0.9 -0.8 -0.7 -0.6 -0.5 -0.4 -0.3 -0.2 -0.1 0 Placebo (n = 207) 10 mg QD (n = 217) 25 mg QD (n = 213) Placebo (n = 155) 10 mg QD (n = 151) 25 mg QD (n = 160) Met + SU3 8.15 8.07 8.10 8.16 8.07 8.06 * * * * * * * * * *
  • 19.
    Efficacy Empagliflozin inpivotal trials - 24 and 76 week Monotherapy 1 Add on to Pio 3 Add on to Met + SU 4 India Pt no. N =24 N =29 N=69 N=65 N=9 N=6 B’line HbA1c 8.35 8.09 8.14 8.24 8.4 8.9 Mean A1c change -0.60 -0.99 -0.60 -0.78 -1.60 -1.53 MET, metformin; PIO, pioglitazone; QD, once daily; SU, sulphonylurea. * All data are placebo-corrected and statistically significant unless otherwise marked. 1. Hach T, et al. Diabetes. 2013;62(suppl 1A);A21 (P69-LB); 2. Roden M, et al. Lancet Diabetes Endocrinol. 2013;1(3):208–219; 3. Häring H-U, et al. Diabetes Care. 2014 (in press); 4. Kovacs C, et al. Diabetes Obes Metab. 2014;16(2):147–158; 2014;16:147–158 P: < 0.05 Empagliflozin 10 mg QD Empagliflozin 25 mg QD Indian Pt No N=24 N=29 N=69 N=65 N=9 N=6 Baseline HbA1c 8.35 8.09 8.24 8.26 8.39 8.90 Mean change in HbA1c -0.81 -1.11 -0.75 -0.78 -1.70 -1.4 24 wk 76 wk * * * * * * ******
  • 20.
    FPG (mg/dL) reductionin pivotal trials - 24 week -31.20 -26.49 -23.40 -23.4 -28.20 -36.20 -28.65 -28.44 -28.44 -29.50 -40 -30 -20 -10 0 Adjusted mean (SE) difference vs placebo in change from baseline in FPG (mg/dL) 2014;16:147–158 P: < 0.05 BL, baseline; MET, metformin; PIO, pioglitazone; QD, once daily; RI, renal impairment; SE, standard error; SU, sulphonylurea. * All data are placebo-corrected and statistically significant unless otherwise marked. 1. Hach T, et al. Diabetes. 2013;62(suppl 1A);A21 (P69-LB); 2. Roden M, et al. Lancet Diabetes Endocrinol. 2013;1(3):208–219; 3. Häring H-U, et al. Diabetes Care. 2014 (in press); 4. Kovacs C, et al. Diabetes Obes Metab. 2014;16(2):147–158; 5. Häring H-U, et al. Diabetes Care. 2013;36(11):3396–404; 6. Rosenstock J, et al. Diabetologia. 2013;56(suppl 1);S372 (P931); 7. Barnett A, et al, Lancet Diabetes Endocrinol. 2014; doi:10.1016/S2213-8587(13)70208-0. Monotherapy Add-on to MET Add-on to PIO Add-on to MET+SU N value Baseline FPG 224 224 217 213 165 168 225 216 169 155 152.79 152.61 154.59 149.37 151.92 151.74 150.84 156.42 138 146 Empagliflozin 10 mg QD Empagliflozin 25 mg QD * * * * * * * * Add-on to Basal insulin
  • 21.
    -1.93 -1.63 -1.95 -1.76 -2.90 -2.15 -2.01 -1.81 -1.99 -2.80 -3.0 -2.0 -1.0 0.0 Empagliflozin isnot indicated for weight loss. Weight change was a secondary endpoint in clinical trials Adjusted mean difference vs placebo in change from baseline in body weight (kg) N value Baseline Wt Body weight (kg) reduction in pivotal trials-24 wk 224 224 217 213 165 168 225 216 169 155 78.4 77.80 81.6 82.2 78.0 78.90 77.1 77.5 91 94 Mono 1 Add-on to Met 2 Add-on to Pio 3 Add-on to Met + SU 4 MET, metformin; PIO, pioglitazone; QD, once daily; SU, sulphonylurea. * All data are placebo-corrected and statistically significant unless otherwise marked. 1. Hach T, et al. Diabetes. 2013;62(suppl 1A);A21 (P69-LB); 2. Roden M, et al. Lancet Diabetes Endocrinol. 2013;1(3):208–219; 3. Häring H-U, et al. Diabetes Care. 2014 (in press); 4. Kovacs C, et al. Diabetes Obes Metab. 2014;16(2):147–158; Empagliflozin 10 mg QD Empagliflozin 25 mg QD Add-on to Basal insulin4
  • 22.
    17.7 -22.3 -40 -30 -20 -10 0 10 20 30 40 11.2 -11.0 -30 -20 -10 0 10 20 30 CI, confidence interval;EMPA, empagliflozin; H2H, head-to-head; QD, once daily. *Dedicated sub-study using magnetic resonance imaging; patient participation was optional. Ridderstråle M, et al. Lancet Diabetes Endocrinol. 2014;2:691‒700. Change in Visceral and Subcutaneous Fat at 2 years* vs. Glimepiride Glimepiride (n = 34) Empagliflozin (n = 39) Glimepiride EMPA 25 mg QD Mean baseline (95% CI) 174.4 (143.3, 205.5) 156.7 (138.6, 174.8) Glimepiride EMPA 25 mg QD Mean baseline (95% CI) 337.0 (297.8, 376.2) 346.3 (312.5, 380.2) -22.2 cm3 (95% CI: -37.1, -7.4) p = 0.0039 -40.0 cm3 (95% CI: -58.9, -21.1) p < 0.0001 Mean(95%CI)changefrombaselinein abdominalvisceraladiposetissue(cm3) Mean(95%CI)changefrombaselinein subcutaneousadiposetissue(cm3) Glimepiride (n = 34) Empagliflozin (n = 39)
  • 23.
    Poster: SA-PO1101, AmericanSociety of Nephrology (ASN) Kidney Week, 11–16 November 2014, Philadelphia, PA, USA Change in SBP, DBP and PP across Various Baselines
  • 24.
    -2.5 -7.0 -7.7-9 -8 -7 -6 -5 -4 -3 -2 -1 0 Placebo(n = 501)10 mg QD (n = 517) 25 mg QD (n = 506) Adjustedmean(SE)changefrom baselineinSBP(mmHg) BP, blood pressure; DBP, diastolic blood pressure; QD, once daily; SBP, systolic blood pressure; SE, standard error. Comparisons versus placebo: *p < 0.001. **p = 0.0152. ***p = 0.1059. FAS (LOCF). Hach T, et al. Diabetes. 2013;62(suppl 1A):A21 (P69-LB). Data on file. Phase III Pooled Risk Factor Analysis: Change from Baseline in SBP by BP Control at Baseline Patients with uncontrolled BP (SBP ≥ 130 mmHg and DBP ≥ 80 mmHg) Mean baseline SBP (mmHg) 136.3 136.9 137.4 * * Empagliflozin 10 mg QD Empagliflozin 25 mg QD Placebo
  • 25.
    CI, confidence interval;QD, once daily; SE, standard error. ANCOVA (TS). Hach T, et al. Diabetes. 2013;62(suppl 1A):A21 (P69-LB). Data on file. Phase III Pooled Efficacy and Cardiovascular Risk Factor Analysis Change from Baseline in Uric Acid 1.0 -28.9 -29.5 -35 -30 -25 -20 -15 -10 -5 0 5 Placebo (n = 825) 10 mg QD (n = 830) 25 mg QD (n = 820) Adjustedmean(SE)changefrombaseline inuricacid(μmol/L) Mean baseline uric acid (μmol/L) 321.4 321.8 322.4 -30.0 (95% CI: -35.0, -24.9) p < 0.0001 -30.6 (95% CI: -35.7, -25.5) p < 0.0001 Empagliflozin Comparison with placebo
  • 26.
    CI, confidence interval;gMean, geometric mean; SD, standard deviation; UACR, urine albumin-to-creatinine ratio. *p < 0.001. **p < 0.01. Adjusted gMean based on ANCOVA with LOCF imputation (95% CI); data following a change in anti-hypertensive medication and after glycaemic rescue therapy were excluded. Cherney D, et al. Abstract accepted at ADA 2014. Effect of Empagliflozin on Microalbuminuria Change in UACR at Week 24 Placebo Empagliflozin 10 mg Empagliflozin 25 mg Mean (SD) baseline UACR (gMean) 68.2 (64.9) 64.6 69.3 Mean (95% CI) UACR at Week 24 (gMean) 53.6 (46.5, 61.7) 37.6 (32.5, 43.4) 40.0 (34.8, 46.0) P < 0.001 P < 0.01 gMeanchangeinUACRfrom baseline (mg/gcreatinine) Ratio of relative change vs placebo at Week 24 Empagliflozin -14.6 -27.0 -29.3 -35 -30 -25 -20 -15 -10 -5 0 10 mg QD (n = 141) Placebo (n = 147) 25 mg QD (n = 150)
  • 27.
    Hypoglycaemic events Phase IIIsafety and tolerability analysis MET, metformin; PIO, pioglitazone; QD, once daily; SU, sulphonylurea. †Confirmed events; plasma glucose ≤ 70 mg/dL and/or requiring assistance 1. Hach T, et al., 2. Roden M, et al., 3. Häring H-U, et al. Diabetes. 2013;(suppl 1):(P69-LB, 1085-P and 1092-P, respectively); 4. Kovacs C, et al. Diabetes Obes Metab. 2014;16:147–158. 0.8 0.4 0.5 1.8 2.9 8.4 1.2 0.4 1.8 1.2 5.2 16.1 1.3 0.4 1.4 2.4 4.0 11.5 0 4 8 12 16 20 Pooled data excl. SU background Monotherapy Add-on to MET Add-on to PIO Pooled data incl. SU background Add-on to MET + SU Percentageofpatientswith confirmedhypoglycaemia†(%) Placebo Empagliflozin 10 mg QD Empagliflozin 25 mg QD 1 2 3 4 1 1
  • 28.
    Events consistent withUTI-Stratified by gender Phase III pooled† safety and tolerability analysis QD, once daily; UTI, urinary tract infection. †The following studies were included in the pooled analysis: Roden M, et al. Lancet Diabetes Endocrinol. 2013;1(3):208–219 (EMPA-REG MONO); Häring H-U, et al. Diabetes Care. 2014 (EMPA-REG MET - in press); Kovacs C, et al. Diabetes Obes Metab. 2014;16(2):147–158 (EMPA-REG PIO; Häring H-U, et al. Diabetes Care. 2013;36(11):3396–404 (EMPA-REG METSU); Kim G, et al. Diabetes. 2013;(suppl 1):(P74-LB). Male vs female patients 8.2 13.0 3.8 9.3 18.5 1.9 7.5 15.9 1.1 0 5 10 15 20 25 30 All patients with events Female patients Male patients Patientswithevents consistentwithUTI(%) Placebo (n = 401/424) Empagliflozin 10 mg QD (n = 367/463)
  • 29.
    Events consistent withUTI Distribution of events severity Phase III pooled† safety and tolerability analysis QD, once daily; UTI, urinary tract infection. The intensity of the adverse event was to be judged by the investigator as mild (awareness of signs or symptoms which were easily tolerated), moderate (enough discomfort to cause interference with usual activity) or severe (incapacitating or causing inability to work or to perform usual activities). †The following studies were included in the pooled analysis: Roden M, et al. Lancet Diabetes Endocrinol. 2013;1(3):208–219 (EMPA-REG MONO); Häring H-U, et al. Diabetes Care. 2014 (EMPA-REG MET - in press); Kovacs C, et al. Diabetes Obes Metab. 2014;16(2):147–158 (EMPA-REG PIO; Häring H-U, et al. Diabetes Care. 2013;36(11):3396–404 (EMPA-REG METSU); Kim G, et al. Diabetes. 2013;(suppl 1):(P74-LB). 6.9 1.1 0.2 7.5 1.7 0.1 6.7 0.9 0 0 1 2 3 4 5 6 7 8 Mild Moderate Severe Patients(%) Placebo (n = 825) Empagliflozin 10 mg QD (n = 830) Empagliflozin 25 mg QD (n = 822) For Internal use only
  • 30.
    0.02 0.00 0.03 0.00 0.04 0.08 0.07 -0.11 -0.04 0.110.10 0.07 -0.02 -0.01 0.16 -0.20 -0.10 0.00 0.10 0.20Adjustedmean(SE)change, mmol/L Placebo (n =825) Empagliflozin 10 mg QD (n = 830) Empagliflozin 25 mg QD (n = 822) Change in Lipids from Baseline at Week 24 Phase III pooled‡ efficacy analysis HDL-C, high-density lipoprotein cholesterol; LDL-C, low-density lipoprotein cholesterol; QD, once daily; SE, standard error. *p < 0.05; **p < 0.001; ***p = 0.008 vs placebo. ANCOVA. TS. †LDL/HDL-C ratio does not have units. ‡The following studies were included in the pooled analysis: Roden M, et al. Lancet Diabetes Endocrinol. 2013;1(3):208–219 (EMPA-REG MONO); Häring H-U, et al. Diabetes Care. 2014 (EMPA- REG MET - Tin press); Kovacs C, et al. Diabetes Obes Metab. 2014;16(2):147–158 (EMPA-REG PIO; Häring H-U, et al. Diabetes Care. 2013;36(11):3396–404 (EMPA-REG METSU); Hach T, et al. Diabetes. 2013;62(suppl 1A):A21 (P69-LB). LDL-C HDL-C Triglyceride LDL/HDL-C ratio† Total cholesterol Mean baseline 2.62 2.57 2.57 1.26 1.26 1.27 1.86 1.95 1.96 2.18 2.11 2.11 4.70 4.67 4.70 *** **** * **
  • 31.
    EMPA-REG Outcome • Studymedication was given in addition to standard of care • Glucose-lowering therapy was to remain unchanged for first 12 weeks • Treatment assignment double-blinded • The trial was to continue until at least 691 patients experienced an adjudicated primary outcome event Zinman B et al. N Engl J Med 2015;doi:10.1056/NEJMoa1504720 Screening (n=11,531) Randomised and treated (n=7020) Pooled Stable background glucose- lowering therapy Background glucose-lowering therapy adjustment allowed to achieve glycaemic equipoise Empagliflozin 10 mg (n=2345) Empagliflozin 25 mg (n=2342) Placebo (n=2333) SGLT2:1 >2500
  • 32.
    Primary outcome 3P-MACE:death from CV causes, non-fatal MI or non-fatal stroke Relative risk reduction (RRR) for 3P-MACE is 14%; absolute risk reduction (ARR) 1.6% rates of 3P-MACE: 10.5% (empagliflozin) vs. 12.1% (placebo). Cumulative incidence function. *Two-sided tests for superiority were conducted (statistical significance was indicated if p≤0.0498) CI, confidence interval; HR, hazard ratio. Empagliflozin is not indicated for CV risk reduction Zinman B et al. N Engl J Med 2015;doi:10.1056/NEJMoa1504720; Zinman B. EASD 2015; Oral presentation HR 0.86 (95.02% CI 0.74, 0.99) p=0.04* 15%
  • 33.
    CV death *nominal p-value Cumulativeincidence function. RRR for CV death is 38%; ARR for CV death is 2.2%; rates of CV death: 3.7% (empagliflozin) vs. 5.9% (placebo). Empagliflozin is not indicated for CV risk reduction. HR, hazard ratio Zinman B et al. N Engl J Med 2015;doi:10.1056/NEJMoa1504720 HR 0.62 (95% CI 0.49, 0.77) p<0.001* 33%
  • 34.
    Hospitalisation for HeartFailure *Nominal p-value Cumulative incidence function. HR, hazard ratio RRR for HHF is 35%; ARR for HHF is 1.4%, rates of HHF: 2.7% (empagliflozin) vs. 4.1% (placebo) Zinman B et al. N Engl J Med 2015;doi:10.1056/NEJMoa1504720 HR 0.65 (95% CI 0.50, 0.85); p=0.002* 35%
  • 35.
    All-cause Mortality *Nominal p-value.Kaplan–Meier estimate RRR for all-cause mortality is 32%; ARR for all-cause mortality is 2.6%; rates of all-cause mortality: 5.7% (empagliflozin) vs. 8.3% (placebo) Empagliflozin is not indicated for CV risk reduction. HR, hazard ratio Zinman B et al. N Engl J Med 2015;doi:10.1056/NEJMoa1504720 HR 0.68 (95% CI 0.57, 0.82) p<0.001* 35%
  • 36.
    New Onset orWorsening Nephropathy Kaplan-Meier estimate. Patients treated with at least one dose of study drug. Hazard ratios are based on Cox regression analyses. HR, hazard ratio; CI, confidence interval. 39% RRR
  • 37.
    New Onset orWorsening Nephropathy: Consistent Benefit for Both Doses Kaplan-Meier estimate. Patients treated with at least one dose of study drug. Hazard ratios are based on Cox regression analyses. HR, hazard ratio; CI, confidence interval.
  • 38.
    New Onset ofMacroalbuminuria Kaplan-Meier estimate in treated set. Hazard ratios are based on Cox regression analyses. HR 0.62 (95% CI 0.54, 0.72) p<0.0001 38% RRR
  • 39.
    First initiation ofcontinuous renal replacement therapy or dialysis Kaplan-Meier estimate in treated set. Hazard ratios are based on Cox regression analyses. HR 0.45 (95% CI 0.21, 0.97) p=0.0409 55% RRR
  • 40.
    Declare TIMI 58 •Dapagliflozin • Bladder Ca rare • 3PMACE 15% DROP • HHF 30% DROP • CV DEATH NOT STATISTICALLY SIGN DROP • CVD REAL ongoing SGLT2:1 >1200
  • 41.
    CANVAS • Canaglifozin • Hyperkalemia •Bone # NNH 1/96 (3 yrs) • Amputation NNH 1/115 (3 yrs) • 3P MACE, HHF, CV death none statistically significant • ONGOING CREDENCE • FDA Recently approved in HF SGLT2:1 >250
  • 42.
  • 43.
    Case 1 • 50YR MALE • DCM PATIENT. EF 30% • DM FOR 5 YEAR, WELL CONTROLLED WITH GLIMEPERIDE • DIURETICS, BB, ACEI • HOSPITALISED WITH HEART FAILURE • WHICH ADD? • SGLT2I • OPTIMIZE DU
  • 44.
    Case 2 • 40YR MALE • HTN • STEMI • PPCI TO LAD • EF 35% • RECENT ONSET DM • WHICH ADD? • SGLT2I after 6 weeks cooling period • OPTIMIZE antiHTNives
  • 45.
    Case 3 • 45YR obese LADY • Started on strict dieting • HTN DM ON GLIPTANS • CAS CSA CCS2 • OMT • WHICH ADD? • SGLT2I • Caution: Fasting
  • 47.
    BEST CLINICAL PRACTICE:CAUTION! • Elderly • Moderate to Severe CKD (eGFR <45mL/min/1.73 m2) • HYPERKALEMIA • H/O DKA • Acute stressful states • Hypotension • Risk of volume depletion (diuretics) • Complicated UTIs: temporary discontinuation recommended • Conditions of fasting: precipitation of DKA • ABPI<0.9 • Osteoposis (DEXA SCAN), History of bone # Adapted: Rajput R, Ved J. Diabetes Metab Syndr. 2017 Mar 31. pii: S1871-4021(17)30016-4.
  • 48.
    NOT TO WORRYIF • Creat increases by <25% • Post hypoTN • Polyurea • Hct increases by <25% • Lipids increases
  • 49.
    Summary • 1st choicein cardiac patients • Class effect in HF patients • No hypoglycemia • HBAIC reduction • Prevents renal deterioration • Reduces uric acid • Reduces BP. Prevents LV remodelling • Also add-ons • Practice caution. In elderly • Not to worry if creat increases initially
  • 50.

Editor's Notes

  • #3 Beautiful campus marvellous surroundings and a progressive director
  • #4 Spent 10 years in Medical College kolkata, worked at a provate sector, did DM from Knapur and awarded as young cardiologist of tomorrow by sec 2018 Joined as a junior faculty and have perfomed more than 300 cardiacprocedures and actively participating in research work, teaching
  • #9 Definition of Subclinical CVD used in the Analysis: At-least 1 of the following signs: LV hypertrophy by electrocardiography or echocardiography LV systolic dysfunction by echocardiography Carotid ultrasound abnormality Peripheral arterial disease (ABI ≤0.9) Glomerular endothelial dysfunction (microalbuminuria)
  • #13 Adapted from: American Diabetes Association. Standards of Medical Care in Diabetes 2018. Diabetes Care. 2018; 41(Suppl 1):s1 – s153 Cefalu WT. et al. Diabetes Care. 2018 Jan; 41(1): 13-31. Kaul S. Diabetes Care. 2017 Jul;40(7):821-31 Suissa S. Diabetes Care. 2018;41:6 – 10 AACE and Medpage today. Meeting Coverage: ADA. June 14,2017. Available from: https://www.medpagetoday.com/meetingcoverage/ada/66015. Accessed Jan 19, 2018. Dalal J. Cardiovascular Benefits of SGLT2- inhibitors. In Sarat Chandra K (ed). Cardiology update – CSI, 2017. Pg 125-31. Joshi S. Using newer antidiabetic agents in patients with cardiovascular diseases. In Sarat Chandra K (ed). Cardiology update – CSI, 2017. Pg 135-8.
  • #20 Note to speakers: this slide has been build to communicate the efficacy of Empagliflozin across different therapeutic scenarios. Therefore, when presenting this slide it should be highlighted that Empagliflozin provides clinically meaningful reductions in HbA1c across a number of different background therapies. A thorough description of the individual studies is not recommended. 5. Häring H-U, et al. Diabetes Care. 2013;36(11):3396–404; 6. Rosenstock J, et al. Diabetologia. 2013;56(suppl 1);S372 (P931); 7. Barnett A, et al, Lancet Diabetes Endocrinol. 2014; doi:10.1016/S2213-8587(13)70208-0.
  • #21 Note to speakers: this slide has been build to communicate the efficacy of Empagliflozin across different therapeutic scenarios. Therefore, when presenting this slide it should be highlighted that Empagliflozin provides clinically meaningful reductions in FPG across a number of different background therapies. A thorough description of the individual studies is not recommended.
  • #22 Note to speakers: this slide has been build to communicate the efficacy of Empagliflozin across different therapeutic scenarios. Therefore, when presenting this slide it should be highlighted that Empagliflozin provides clinically meaningful reductions in body weight across a number of different background therapies. A thorough description of the individual studies is not recommended.
  • #26 We can also see a small dip in the uric acid levels with both doses of empagliflozin as compared to placebo, uric acid elevation seems to be related to early morning rise in the blood pressure. Its clinical significance yet seems to be evaluated.
  • #27 There is data with empagliflozin about reduction of albuminuria. There is said to be a correlation between albuminuria and CV risk.
  • #28 Low risk of hypoglycemia, slightly increased in the background of SU, reduce SU dose.
  • #30 Most of the events are mild in nature, respond to a single course of anti-bacterial therapy with few recurrences or discontinuation
  • #31 Increase in LDL, HDL, LDL:HDL ratio unchanged. Relative increase due to hemoconc possible, Not absolute increase
  • #32 Reference Zinman B et al. N Engl J Med 2015;doi:10.1056/NEJMoa1504720
  • #33 Abbreviations CV, cardiovascular; HR, hazard ratio; 3P-MACE, 3-point major adverse cardiovascular events; MI, myocardial infarction Reference Zinman B et al. N Engl J Med 2015;doi:10.1056/NEJMoa1504720
  • #34 Abbreviations CV, cardiovascular; HR, hazard ratio Reference Zinman B et al. N Engl J Med 2015;doi:10.1056/NEJMoa1504720
  • #35 Abbreviation HR, hazard ratio Reference Zinman B et al. N Engl J Med 2015;doi:10.1056/NEJMoa1504720
  • #36 Abbreviation HR, hazard ratio Reference Zinman B et al. N Engl J Med 2015;doi:10.1056/NEJMoa1504720
  • #37 As for new or worsening nephropathy, the event rates for empagliflozin (pooled and individual doses) and placebo started to separate at about Day 90.
  • #38 Figure 15.2.4.2.4: 2 indiv. empa doses vs placebo - treated set Table 15.2.4.2.4: 2 indiv. empa doses vs placebo − treated set
  • #40 Figure 15.2.4.2.7: 1 and Table 15.2.4.2.7: 1 A separation of the event rates for empagliflozin (pooled and individual doses) and placebo started at about Day 360 and was maintained throughout the trial.