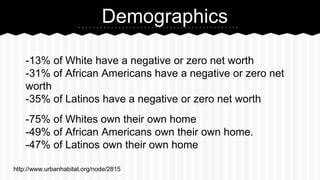
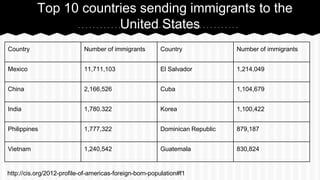
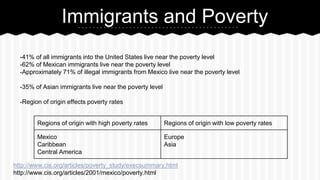
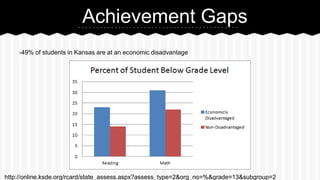
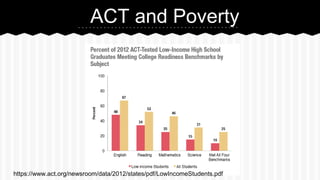
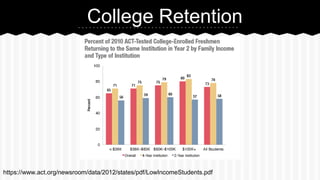
1. SocioEconomic Status: How does it
impact students?
By Matthew Dunning, Megan Henley, and Elena Buckner
2. What will we talk about?
1. Demographics
a. Racial Makeup
b. Gender
c. Immigration
2. Achievement Gaps
a. Test scores
b. Graduation rates
c. College Retention
3. Poor Performing Schools
a. Location
b. Title I Schools
c. Demographics
4. Implication for Students
a. Home Support
b. Food
c. Shelter
d. Clothing
3. Demographics
-13% of White have a negative or zero net worth
-31% of African Americans have a negative or zero net
worth
-35% of Latinos have a negative or zero net worth
-75% of Whites own their own home
-49% of African Americans own their own home.
-47% of Latinos own their own home
http://www.urbanhabitat.org/node/2815
4. Poverty Rate by Race/Ethnicity
Location
White
Black
Hispanic
Other
Total
United States
13%
35%
33%
22%
20%
Kansas
12%
40%
42%
28%
18%
Missouri
15%
37%
41%
26%
19%
http://kff.org/other/state-indicator/poverty-rate-by-raceethnicity/
5. Median Household Net Worth
http://money.cnn.com/2012/06/21/news/economy/wealth-gap-race/index.htm
7. Top 10 countries sending immigrants to the
United States
Country
Number of immigrants
Country
Number of immigrants
Mexico
11,711,103
El Salvador
1,214,049
China
2,166,526
Cuba
1,104,679
India
1,780.322
Korea
1,100,422
Philippines
1,777,322
Dominican Republic
879,187
Vietnam
1,240,542
Guatemala
830,824
http://cis.org/2012-profile-of-americas-foreign-born-population#f1
8. Immigrants to Kansas and Missouri
-In 2010 there were 186,942 immigrants that moved to
Kansas most of these came from Mexico, Vietnam, and
India
-In 2010 there were 232,537 immigrants that moved to
Missouri most of these come from Mexico, China, and
India
http://www.maptheimpact.org/state/kansas/
http://www.maptheimpact.org/state/missouri/
9. Immigrants and Poverty
-41% of all immigrants into the United States live near the poverty level
-62% of Mexican immigrants live near the poverty level
-Approximately 71% of illegal immigrants from Mexico live near the poverty level
-35% of Asian immigrants live near the poverty level
-Region of origin effects poverty rates
Regions of origin with high poverty rates
Regions of origin with low poverty rates
Mexico
Caribbean
Central America
Europe
Asia
http://www.cis.org/articles/poverty_study/execsummary.html
http://www.cis.org/articles/2001/mexico/poverty.html
10. Achievement Gaps
-49% of students in Kansas are at an economic disadvantage
http://online.ksde.org/rcard/state_assess.aspx?assess_type=2&org_no=%&grade=13&subgroup=2
16. Poverty and Achievement Gaps
-22% of children that have lived in poverty will not graduate on time
-32% of children that have spent over half of their childhood in poverty will not
graduate on time
-6% of children that have never lived in poverty will not graduate on time.
-26% of children that were poor for just one year and are not reading proficient
by the third grade will not graduate
-11% of children that are proficient at reading by the third grade that lived in
poverty will not graduate
http://www.aecf.org/~/media/Pubs/Topics/Education/Other/DoubleJeopardyHowThirdGradeReadingSkillsandPovery/DoubleJeopardyReport0405
11FINAL.pdf
17. Poor Performing Schools
Kansas has a wide array of high- and low-performing
schools throughout the state. In the following few
slides, we will explore those schools and how their
location affects them.
18. What is “Poor Performance”?
A school characterized as “low performing” can be many things...Some schools
are called low performing because of low test scores, but they don’t have to be
defined by test scores alone. Some public schools are called low-performing
schools if a substantial number of students (usually 20 percent or more) are not
proficient in reading or mathematics for two or more years.
-Psyche Pascual, GreatSchools.org
19. Where are Poor Performing Schools?
● Most schools designated as poor performing are also in non-wealthy areas.
This leads to…
○ limited funding
○ fewer well-qualified teachers
○ inferior facilities and resources
○ overcrowding
○ discipline problems
○ lack of systematic organization
○ low student expectations
(Education Week, 2004)
20. Title I Schools in KS
In Kansas there are 3 types of Title I schools: Tier I, Tier II, and Tier III.
● Tier I: Title I schools that are in improvement, corrective action or restructuring.
These schools are all identified as persistently low-achieving.
● Tier II: secondary schools that are eligible for but do not receive Title I funds.
These schools are also identified as persistently low-achieving. Any secondary
school that is eligible for Title I funds with a graduation rate of less than 60% over
three years will be added to the list of Tier II schools.
● Tier III: Title I schools that are identified in improvement, corrective action or
restructuring that are not included in Tier I or Tier II
A list of all Title I schools in Kansas is on the interactive map in a following slide.
*This information is based on data from the 2009-10 academic year.
http://www.chappell4ksboe.com/uploads/chappell4representative/KS%20Schools%20Not%20Meeting%20AYP%204-20-
21. Best Performing High Schools KS
1.
Sumner Academy of Arts & Science
2.
a. Kansas City, KS
Blue Valley North High School
3.
a. Overland Park, KS
Blue Valley High School
4.
a. Stilwell, KS
Olathe Northwest High School
5.
a. Olathe, KS
Northeast Magnet High School
6.
a. Wichita, KS
Gardner Edgerton High
7.
a. Gardner, KS
Liberal Sr. High
8.
a. Liberal, KS
Fort Scott Sr. High
9.
Best Performing Title I Schools - KS
•
a. Fort Scott, KS
Maize Sr. High
•
•
Washington Elementary (Category 2)*
o Junction City, KS
Nelson Elementary (Category 1)
o Haysville, KS
K. O’Loughlin McCarthy Elementary
School (Category 1)
o Hays, KS
*Category 1: Exceptional student
performance for two or more consecutive
years.
Category 2: Closing the achievement gaps
between student groups.
a. Maize, KS
10. Louisburg High
http://www.usnews.com/education/best-high-schools/kansas
http://www.titlei.org/ds/
22. Wealth Distribution in Kansas
Wealthiest Counties in KS
1. Johnson
Highest Performing Schools + County
1. Sumner Acad. of Arts & Sci. (Wyandotte)
2. Scott
2. Blue Valley North (Johnson)
3. Greeley
3. Blue Valley High School (Johnson)
4. Ness
4. Olathe Northwest (Johnson)
5. McPherson
5. Northeast Magnet (Sedgwick)
Sedgwick County = 11th
wealthiest
Poorest Counties in KS
101. Neosho
Tier 1 Title I Schools + County
Curtis Middle School (Sedgwick)
102. Bourbon
103. Lyon
Emerson Elementary School (Wyandotte)
104. Seward
Mark Twain Middle School (Wyandotte)
105. Pawnee
http://factfinder2.census.gov/faces/nav/jsf/pages/index.xhtml
South Middle School (Seward)
Northwest Middle School (Wyandotte)
23. Interactive School Map
This map includes pinpointed placemarks for the Top 10 performing high
schools in KS, the 3 “Distinguished” Title I schools in KS, and a list of all
45 schools designated as Title I for the 2009-10 school year.
Take a moment to explore, click some of the links, and consider the
geographical locations of the various school...there is a distinct correlation
between neighborhood and performance for most of these schools.
https://mapsengine.google.com/map/edit?mid=zjldahO7_xAc.kRYjDuXpW1
qo
24. Implications for Students
When looking at the implications for students in low SES
households there are four major factors that influence a child’s
life. Those factors are: home support, food, shelter, and
clothing.
“Low-income caregivers frequently do not know the names of their
children's teachers or friends. One study found that only 36 percent
of low-income parents were involved in three or more school
activities on a regular basis, compared with 59 percent of parents
above the poverty line (U.S. Department of Health and Human
Services, 2000).”
http://www.ascd.org/publications/books/109074/chapters/How-Poverty-Affects-Behavior-and-AcademicPerformance.aspx
25. Home Support for Low SES
students
There are many factors when looking at home support that is available for low SES
students such as lack of educational resources, lack of time from parents, and lack
of parent involvement.
● Many families don’t have the money to devote towards supplying their
students with books, supplies or computers to help facilitate the learning
process at home.
● Parents in low ses households usually hold multiple jobs or our single parents
which leaves little to no time to spend helping their children with educational
needs.
● Parents may also just not be involved in their children’s learning. “Only 36% of
low SES parents read to their kindergartners, compared to 62% in the highest
SES students” (Coley, 2002).
http://www.scilearn.com/blog/helping-low-ses-students-thrive.php
26. Home Support
“Low-SES children are often left home to fend for themselves and their younger siblings while their caregivers work
long hours; compared with their well-off peers, they spend less time playing outdoors and more time watching
television and are less likely to participate in after-school activities (U.S. Census Bureau, 2000). Unfortunately,
children won't get the model for how to develop proper emotions or respond appropriately to others from watching
cartoons; they need warm, person-to-person interactions. The failure to form positive relationships with peers
inflicts long-term socioemotional consequences (Szewczyk-Sokolowski et al., 2005).”
http://www.ascd.org/publications/books/109074/chapters/How-Poverty-Affects-Behavior-and-Academic-Performance.aspx
Home support is so important for students because they need to be having those connections with
people in order for their brain to develop properly. The earlier a child begins learning the better
that they will do academically but so often parents of low SES homes don’t have access to preschool
or the educational resources which begins growing that gap between low SES achievement and high
SES. What can we do? School districts need to be allowing preschool classes as well as
transportation for those students. The earlier schools can get these students into school the better
they will be.
27. Food and Low SES Students
Food clearly has an impact on students all over the world but the amount of students receiving free or
reduced lunches is mind boggling. Below you will find a few facts about low SES students and school
lunches.
● As of June 2013 there were 19,700,000 students receiving free or reduced lunches out of the 29
million that are eligible, according to the National Center for Education Statistics, School
Nutrition Assistance.
● 47.5% of students in the USA are eligible for free and reduced lunches.
● The highest state/territory for students receiving free and reduced lunches is Washington D.C
with 72.3%.
● The lowest state for students receiving free and reduced lunches is New Hampshire with 23.5%.
Besides food being a factor of living a healthy life the lunches that are served have a high nutritional
value which has many positive effects on a students educational experience.
http://www.statisticbrain.com/free-and-reduced-lunch-statistics/
28. Nutrition and Education
The students that are receiving free and reduced lunches are having a better nutritional experience
than students who are not participating or bring food from home. That being if the students eat the
food that is on the plate. “Reimbursable meals must meet federal nutritional needs.” They can have
“no more than 30 percent of calories from fat and less than 10 percent of calories from saturated fat.”
Studies show that students that eat the proper nutrition have better behavior, school performance
and overall cognitive development. The students are also more willing to participate in the
educational experience which benefits everyone and they are learning proper eating habits which will
help them in their overall life.
So many students from low SES homes don’t get proper nutrition due to lack of funding and healthy
food is usually more expensive. A high number of students will only eat breakfast or lunch at school
and little to nothing at home. The gap of food intake and lack of nutrition at home hurts school
performance and brain development.
http://frac.org/newsite/wp-content/uploads/2009/09/cnnslp.pdf
29. Shelter
Shelter and care is extremely important for students to feel safe, comfortable, and cared for. These
factors will directly affect the educational experience for students because they will be coming to
school for shelter more than education.
There are a variety of different situations that students in low SES families will be exposed to such
as: homeless shelters, apartments, vehicles, constant moving, living with family members, and
homes without the necessary needs such as heat, a/c, electricity, or running water.
All the different situations listed above will directly impact the student and hurt their development.
Last year alone there were 1.1 million students homeless in the United States of America.
http://thinkprogress.org/economy/2013/10/24/2830651/homeless-students/#
“Children in derelict housing had lower average reading and math skills, and more emotional and
behavioral problems.”
http://www.theatlanticcities.com/housing/2013/10/how-crummy-run-down-housing-harms-children-who-live-it/7345/
30. Clothing Needs for Students
As we have been reading, coming from a low SES family means there are many sacrifices and one of
the biggest would be clothing, shoes, outerwear, etc. Families do not have the financial stamina to
keep up with trends in the school system and very frequently students will get bullied or feel self
conscious about their clothes.
Students in these situations will normally get hammy downs from families or parents which may be not
the correct size, overly worn out, or stained. They may not be getting the option for regular laundry
days so those clothes are worn multiple days in a row which will lead to body odor. All of these
reasons will make the child self conscious, a target for bullying and less likely to join in the educational
experience.
There are many programs out there that supply clothing/winter jackets/shoes for children. Here is just
a few: Coats-for-Kids, Salvation Army, and Solemates Organizations. Communities and schools can
have coat drives, shoe donations, and clothing drives to help out their students in need.
31. Conclusion
-Higher chance of performing poorly in school
-Less likely to complete high school or college
-Poor performing school in Kansas have large populations of
disadvantaged students
-Some schools with large disadvantaged population that
achieve high standards
-Other implications for students are food, shelter, clothing, and
support at home