Download to read offline


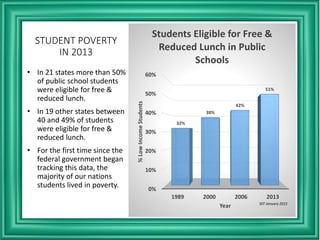
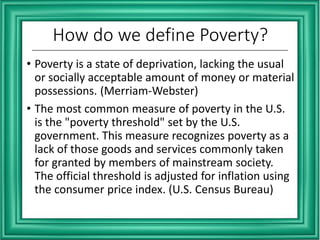


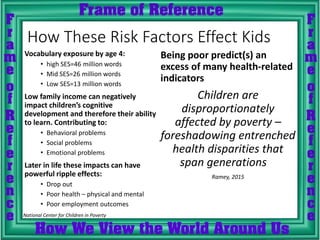

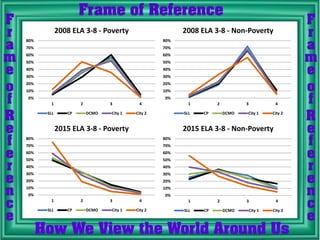
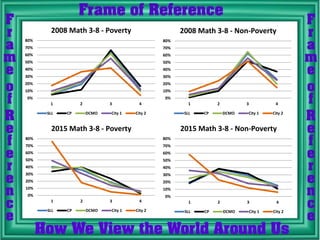


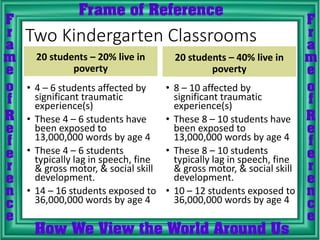


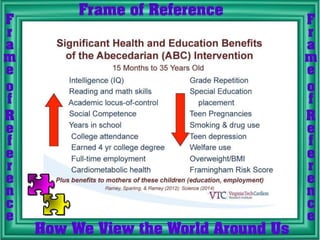

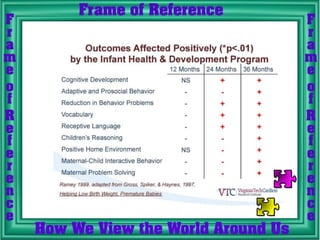


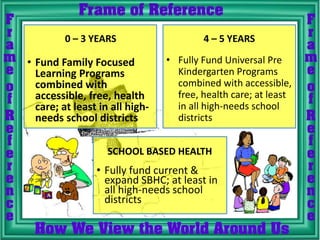

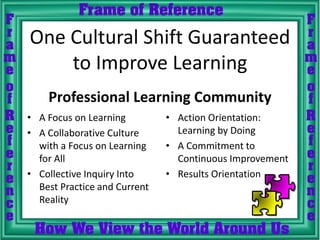


The document discusses rural poverty and its impact on education, highlighting that over half of public school students in certain areas were eligible for free lunch in 2013. It underscores the importance of understanding poverty's effects on student learning and development, presenting risk factors associated with poverty that affect children's cognitive and emotional well-being. Recommendations include early childhood educational interventions and a commitment to equity literacy to enhance educational outcomes for disadvantaged students.


