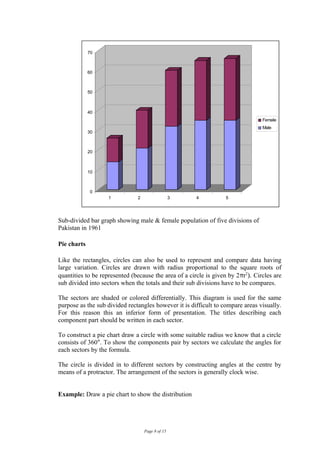
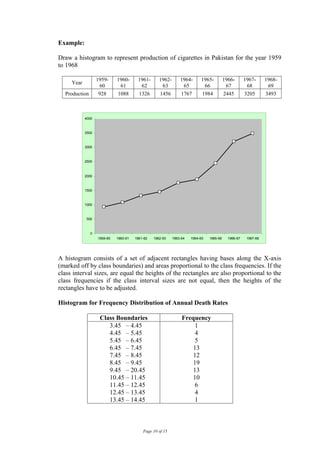
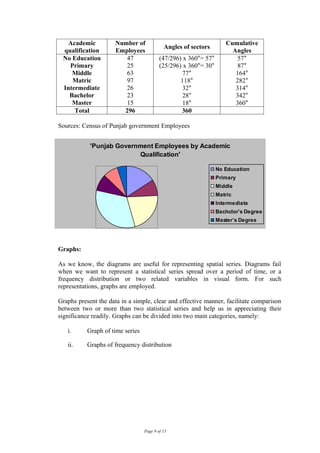
The document discusses different methods for presenting data, including classification, tabulation, and graphical representation. Classification involves organizing data into mutually exclusive categories based on common attributes. Tabulation arranges data into a table with rows and columns for easy interpretation. Graphical representation uses visual displays like charts, graphs, and diagrams to convey patterns and relationships in the data. Examples of each method are provided.
The document discusses social welfare programs in the United States. It covers topics such as how Americans' views of government assistance for the poor have changed over time, different types of welfare programs, and debates around universal health care. The key points are:
1) Americans have historically taken a more restrictive view than other nations on who is entitled to government assistance and have been slower to embrace the welfare state.
2) There are two kinds of welfare programs - majoritarian programs like Social Security that most citizens support, and client programs like Medicaid that are means-tested and face more questions about legitimacy.
3) Debates continue around ensuring access to health care for all Americans while containing costs and not reducing the quality
1. Statistics is used to analyze data beyond what can be seen in maps and diagrams by using mathematical manipulation, which can reveal patterns that may otherwise go unnoticed.
2. It is important to justify any statistical techniques used and to only use techniques that are appropriate for the type of data.
3. Common methods for summarizing large data sets include calculating the mean, mode, and median. The mean is the average, the mode is the most frequent value, and the median is the middle value when the data is arranged from lowest to highest.
This document provides an overview of statistics for social work research. It defines statistics as the science of developing knowledge through empirical data expressed quantitatively, based on probability theory. Statistics involves collecting, summarizing, and analyzing numerical data. Descriptive statistics summarize and describe data, while inferential statistics model patterns in data to draw inferences about populations. The document discusses the characteristics, functions, scope, limitations, and potential misuse of statistics.
The document summarizes several major theories of deviance:
- Anomie or strain theory proposes that deviance results from a gap between cultural goals and the legitimate means to achieve them. There are five types of adaptation.
- Conflict theories view deviance as resulting from inequalities in power and resources under capitalism that marginalize the poor and force them into crime.
- Labeling theory argues that behaviors become deviant based on the labels attached by authorities, not inherent qualities, perpetuating deviance.
- Control or social bond theory suggests deviance occurs when social bonds and constraints that normally inhibit antisocial behavior are weakened. Four elements are attachment, commitment, involvement, and belief.
- Differential
CAPE Sociology Marx theory of_population-1capesociology
Marx believed that population growth is tied to the economic system and the two cannot be separated. To Marx, poverty and unemployment were caused not by overpopulation itself, but by the failure of the capitalist system to provide enough jobs. Surplus population was the consequence of real production and the uneven distribution of wealth under capitalism. Marx also argued that under socialism, reproductive behavior would develop in full harmony with society. However, critics note that communist countries still saw the need to check population growth, contrary to Marx's assumptions, calling into question his view that economic inequality is the sole cause of differences in birth rates.
This document provides an overview of demography and population studies. It defines demography as the statistical study of human populations, examining their size, structure and changes over time and space. Key points include:
- Demography analyzes population dynamics like birth, death, and migration and their influence on society. It uses data from government censuses and registrations.
- A nation typically progresses through five stages of a demographic cycle from high stationary population to declining population.
- India has over 1.3 billion residents and is projected to surpass China as the world's most populous country by 2027. The UN expects the global population to increase by 2 billion by 2050.
- Demography
Introduction to statistics for social sciences 1Minal Jadeja
This document provides an introduction to statistics. It defines statistics as the collection, presentation, analysis, and interpretation of numerical data. Statistics can refer to either quantitative information or a method of dealing with quantitative or qualitative information. There are two main approaches in statistics - descriptive statistics, which deals with presenting data in tables or graphs to get a general picture of a sample, and inferential statistics, which involves techniques for making inferences about a whole population based on a sample. Some key uses and applications of statistics include showing how samples differ from normal distributions, facilitating comparisons, simplifying messages in data, helping to formulate and test hypotheses, and aiding in prediction and inference. However, there are also some limitations to consider with statistics, such
Standardization of rates by Dr. Basil TumainiBasil Tumaini
Standardization of rates by Dr. Basil Tumaini, presented during the residency at Muhimbili University of Health and Allied Sciences, Epidemiology class
This document discusses social justice issues in the Caribbean, including gender equality, discrimination based on class/race, rights of minorities, indigenous peoples, disabled people, street people/AIDS victims, and children's rights. It examines concepts of equality versus equity, and defines social justice as equalizing opportunities regardless of attributes. While Caribbean countries have bills of rights, more work is needed to eliminate social injustices from lack of access to life necessities. Forms of institutionalized discrimination discussed include racism, sexism, ageism, ableism, and classism.
This document discusses different types of statistics used in research. Descriptive statistics are used to organize and summarize data using tables, graphs, and measures. Inferential statistics allow inferences about populations based on samples through techniques like surveys and polls. The key difference is that descriptive statistics describe samples while inferential statistics allow conclusions about populations beyond the current data.
This document provides summaries of several major sociological theories and perspectives:
- The functionalist perspective developed by Emile Durkheim focuses on how society functions as an interrelated system to maintain stability.
- The conflict perspective developed by Karl Marx focuses on how competition for scarce resources leads to social change and conflict.
- Max Weber's interactionist perspective focuses on how individuals interact through symbols and attach subjective meanings to actions.
It also provides brief biographies of Durkheim, Marx, and Weber, outlining their major concepts and contributions to sociology.
The document discusses various sampling methods used in research including population, sample, random sampling, cluster sampling, and systematic random sampling. Random sampling methods aim to select a sample that accurately represents the population without bias. Cluster sampling divides the population into clusters or groups and then randomly selects clusters. Systematic random sampling selects every nth unit from a randomly chosen starting point with a fixed interval between selections. Both cluster and systematic random sampling can reduce costs compared to simple random sampling of large, dispersed populations.
Neo-functionalism emerged in the 1980s as a revision and expansion of Parsonian functionalism. Jeffrey Alexander and Paul Colomy are the main proponents of neo-functionalism in the US. They define it as a self-critical strand of functional theory that broadens its scope while retaining its theoretical core. Specifically, neo-functionalism aims to incorporate conflict, subjective meaning, contingency, and creativity into functionalism, address its anti-individualism and resistance to change, and analyze systems as tendencies rather than givens. It also pushes functionalism to the left by rejecting optimism about modernity and emphasizing democracy.
Emile Durkheim was a pioneering French sociologist born in 1858 who established sociology as an academic discipline. He viewed society as a complex system of interdependent parts greater than the sum of individuals. Durkheim analyzed how social order is maintained amid change through concepts like mechanical and organic solidarity, and the influence of social facts - external social forces that individuals cannot control but influence them, such as religion, education, and morality. He studied suicide rates to understand how lack of social integration and regulation can lead to anomie, a state of normlessness. Durkheim's works on topics like the division of labor, religion, and the collective conscience helped establish structural functionalism as a key framework in sociology.
The document discusses various measures of central tendency and dispersion. It defines central tendency as the average value of a statistical series and discusses different types of averages including arithmetic mean, median, mode, geometric mean, harmonic mean, and weighted mean. It also defines dispersion as the spread or variability in a distribution and discusses various measures of dispersion such as range, mean deviation, standard deviation, variance, quartile deviation, and coefficient of variation. The key properties and uses of each measure are provided. The document also discusses the normal distribution and its key properties.
Social Research: nature, types and scientific methodSameena Siddique
Social research examines social phenomena using concepts from the social sciences. It aims to illuminate changes in society, but human behavior is irregular and difficult to predict compared to natural sciences. There are different types of social research including descriptive research that reports current conditions, analytical research that critically evaluates existing data, applied research that solves problems, and fundamental research that develops theories. Research can also be qualitative and focus on meanings, or quantitative and rely on measurable data. The scientific method is a systematic process used in social research involving observation, hypothesis, and verification through empirical evidence, concepts, and logical reasoning. However, whether human behavior can truly be studied scientifically is debated.
This document discusses the different meanings and definitions of statistics. It explains that statistics has three different meanings: (1) plural sense referring to numerical facts and figures collected systematically, (2) singular sense referring to the science of collecting, analyzing, and presenting numerical data, and (3) plural of the word "statistic" referring to numerical quantities calculated from samples. The document also provides several definitions of statistics from different authors, describing it as the science of collecting, organizing, and interpreting quantitative data.
This document discusses comparative social policy and welfare regimes. It summarizes Esping-Anderson's three welfare regimes based on stratification and decommodification. It notes critiques of Esping-Anderson's narrow data and ignoring of unpaid labor. Gender is an important element of welfare regimes. Family forms are changing in Europe with increased cohabitation and births outside marriage. The pace of gender equality's private and public spheres varies across countries putting family pressure on fertility. [/SUMMARY]
This document outlines four principal models of social welfare: 1) The familial model, best exemplified by France, where the family plays a large role in welfare. 2) The residual model, best exemplified by the US, where public welfare aims to help only the poor and needy. 3) The mixed economy model, seen in countries like Germany and Britain, that blend public and private insurance. 4) The model of state control, exemplified by the former Soviet Union, where the state controls all welfare. Each model is then described in 1-2 paragraphs.
This document discusses key concepts and techniques for analyzing migration patterns. It begins by defining migration as a change in usual residence between geographic units, and defines related terms like migrants, place of origin/destination, migration streams, and types of migration. It then discusses major data sources for migration like censuses and surveys. The document outlines several methods for measuring migration patterns, like using place of birth, duration of residence, and survival ratios. It concludes by discussing determinants and consequences of internal migration and references for further information.
This document discusses ethics in social work research. It begins with an introduction defining ethics and the importance of research ethics. It then outlines some basic ethical principles for social work research including causing no harm, respecting participants' rights and dignity, and conducting research with integrity. The document goes on to discuss specific issues in social work research such as authorship, plagiarism, peer review, conflicts of interest, data management, and research misconduct. Guidelines for ethical research with human subjects are also provided. The document concludes with references on research ethics and methodology.
There are two main types of sampling: probability sampling and non-probability sampling. Probability sampling involves methods where the probability of selection of each individual is known, such as simple random sampling, systematic random sampling, stratified random sampling, and cluster random sampling. Simple random sampling involves selecting a sample that gives each individual an equal chance of being selected by identifying the population, determining sample size, listing all population members, assigning them numbers, selecting numbers at random from a table, and including individuals in the sample if their number is selected. The advantages are it is easy to conduct and requires minimum population knowledge, while disadvantages include needing all population member names and potential over or under representation.
The document discusses the concept of social exclusion, which was coined in the 1970s to describe populations that fell through social safety nets. There are multiple definitions of social exclusion involving problems like unemployment, low income, poor housing, and family breakdown. Social exclusion has greater negative impacts on individuals and communities than just the sum of its parts. The document also examines three perspectives on social exclusion: the moral underclass discourse which sees exclusion as a result of individual faults; the social integrationist discourse which focuses on getting people into paid work; and the redistributionist discourse which views exclusion as caused by structural inequality that needs to be addressed through government intervention.
This document discusses key concepts in demography and population studies. It defines demography as the scientific study of human populations, including their size, structure, and distribution. It notes that population growth is influenced by birth rates, death rates, and migration patterns. The document also summarizes several important demographic indicators used to measure and analyze populations, such as fertility rates, mortality rates, sex ratios, and age distribution. It outlines the stages of demographic transition that populations typically progress through as mortality declines and birth rates adjust.
The document discusses various phases and methods involved in community organization. It begins by outlining key phases like study, analysis, assessment, decision making, organization, action, evaluation and modification. It then examines specific methods that can be used in each phase, such as surveys, interviews, meetings and committees for gathering and analyzing information. The summary emphasizes that community organization involves systematic planning, assessment of community needs and resources, and collective decision making and action to address issues in a sustainable manner.
Community organization has a broad scope that can be applied to different types of communities from villages to cities. It is used across many fields including politics, art, education, economics, and more to help individuals and groups pool their resources and efforts to improve community life. Specifically, community organization can help with economic upliftment, education, health, corrections, infrastructure like roads and housing, recreation, culture, social services, industry, rural areas, and urban areas. The process of community organization generally involves assessing needs, prioritizing problems, developing objectives and plans, mobilizing resources, taking action, and evaluating outcomes.
Social work research aims to systematically gather and analyze data to advance knowledge in the field of social work. It provides information to help social workers make decisions that impact clients, programs, and agencies. Social work research can be applied in areas like casework, group work, and community organization. The objectives of social work research include facilitating understanding of human behavior, acquiring knowledge about social issues and problems, and formulating solutions to social problems. Some key benefits of social work research are the discovery of facts and relationships, diagnosis and analysis of problems, development of a systematic body of knowledge, and informing social development planning and welfare efforts.
This document discusses various methods of graphically representing data, including bar diagrams, pie charts, histograms, and line graphs. It describes the construction and purposes of simple bar diagrams, multiple bar diagrams, compound bar diagrams, pie charts, and histograms. The document emphasizes that graphical representations are important for conveying insights from data more effectively than tables alone and for understanding patterns.
The document provides instructions for organizing raw data into a frequency distribution table and describes different ways to represent the distribution graphically, including histograms, frequency polygons, and cumulative frequency curves. It explains how to calculate class intervals and frequencies from raw data and construct tables showing the distribution. It also discusses representing the same data through vertical bar graphs, line graphs connecting class points, and curves showing cumulative frequencies below given values.
Variables describe attributes that can vary between entities. They can be qualitative (categorical) or quantitative (numeric). Common types of variables include continuous, discrete, ordinal, and nominal variables. Data can be presented graphically through bar charts, pie charts, histograms, box plots, and scatter plots to better understand patterns and trends. Key measures used to summarize data include measures of central tendency (mean, median, mode) and measures of variability (range, standard deviation, interquartile range).
The document describes a student result management system that will manage information about users, subjects offered each semester, and marks obtained by students. It will generate reports. The system requirements include maintaining data on students, subjects, marks and user accounts with validation checks. The system will have security, maintainability and portability. Key modules include login, subject info maintenance, marks entry and maintenance of user accounts.
William Playfair, a Scottish engineer and economist, is considered the principal inventor of statistical graphs. In 1786, he published the 'Commercial and Political Atlas' containing 44 charts, which introduced the line graph, bar graph, and pie chart. Graphical representations visually display data using plots and charts to quantify, sort, and present information in an understandable way for various audiences. Common types include bar graphs, line graphs, histograms, and pie charts, which each have specific rules for effectively displaying different types of data.
Samsung vs Nokia-Comparative Marketing AnalysisPinnakk Paul
Nokia and Samsung are two leading mobile phone manufacturers. Nokia has been the world's largest manufacturer of mobile phones for many years, with a global market share of around 38% in 2007. Samsung is also a major player in the global mobile phone market. The document provides an overview of the mobile phone industry in India and the key developments in that market between 2004-2008. It then profiles Nokia and Samsung, describing their history, product lines, marketing strategies, and role in the Indian mobile market.
This chapter presents the analysis and results of a study of 200 psychology students at PUP. It includes tables on the demographic profile of respondents and effects of technological development on their socialization, self-esteem, and school performance. It also analyzes whether there is a correlation between technological developments of cellular phones and changes in respondents' behavior.
Here are the class widths, marks and boundaries for the given class intervals:
a. Class interval (ci): 4 – 8
Class Width: 4
Class Mark: 6
Class Boundary: 3.5 – 8.5
b. Class interval (ci): 35 – 44
Class Width: 9
Class Mark: 39.5
Class Boundary: 34.5 – 43.5
c. Class interval (ci): 17 – 21
Class Width: 4
Class Mark: 19
Class Boundary: 16.5 – 20.5
d. Class interval (ci): 53 – 57
Class Width: 4
Class Mark: 55
Class Boundary: 52.5 –
A project report on comparative analysis of marketing strategies of vodafone ...Projects Kart
The document provides information about a project report on the comparative analysis of marketing strategies of Bharti Airtel and Vodafone. It includes an introduction to the topic, background details on the telecom sector in India and profiles of Airtel and Vodafone. It also describes the objectives of the study, research methodology used and the contents that will be covered in the report such as the marketing strategies, SWOT analysis, suggestions and conclusions.
The document outlines the steps for planning and conducting data analysis, including determining the method of analysis, processing and interpreting the data, and presenting the findings through descriptive and inferential statistical analysis techniques to answer research questions. It also discusses the components and format for writing up the final research paper, including the preliminary pages, main body, and supplementary pages.
CLASSIFICATION AND TABULATION OF DATA for I BSC II Semester.pptaigil2
The document discusses classification and tabulation of data. Classification involves organizing raw data into meaningful groups according to characteristics. Tabulation then systematically arranges the classified data into tables to facilitate analysis and draw conclusions. There are different types of classification such as chronological, geographical, qualitative, and quantitative. Tabulation summarizes data in columns and rows for easy comparison. Both processes work together to condense large amounts of data into understandable forms.
This document defines data and different types of data presentation. It discusses quantitative and qualitative data, and different scales for qualitative data. The document also covers different ways to present data scientifically, including through tables, graphs, charts and diagrams. Key types of visual presentation covered are bar charts, histograms, pie charts and line diagrams. Presentation should aim to clearly convey information in a concise and systematic manner.
This document discusses data analysis and various techniques used in data analysis such as data editing, coding, classification, tabulation, and statistical analysis. It describes different types of statistical tests like z-test, t-test, chi-square test, and their uses. It also discusses various types of tables, diagrams, and graphical representations that are used to present statistical data in a meaningful way. Key types of diagrams mentioned include bar charts, pie charts, histograms and scatter plots. Rules for properly constructing tables and graphs are also provided.
The document discusses tabulation of data, including definitions, types, and preparation of tables. It defines tabulation as the systematic presentation of numeric data in rows and columns to facilitate comparison and analysis. The key types of tabulation are simple/one-way, double/two-way, and complex tabulation based on number of characteristics. Preparing tables involves including only essential data, sufficient detail, and citations in text.
Data presentation/ How to present Research outcome dataDr-Jitendra Patel
In this power point viewer will be able to know about how to present data which is the out comes of any sincere research. The way of presentation is very very important because ultimately it should reach to the particular audience in proper and effective way.
In this PPT viewers will be able to know how to present data obtained as a result of any kind of Research. In report writing the information received need to reach to targeted audience and received data need to reflect in impressive and understandable manner therefore data presentation is very important.
portion covered
1. Data presentation
2. Textual data presentation
3. Tabular data presentation
4. Qualitative Tabular data presentation
5. Quantitative tabular data presentation
6. Temporal tabular data presentation
7. Spatial tabular data presentation
This document provides an overview and outline of a statistics course. It discusses the following key points:
1) The objective of the course is to introduce students to the history and basic concepts of statistics, as well as topics like descriptive statistics, probability distributions, statistical inference, correlation and regression.
2) The course will be organized into 9 sections that cover introductions, descriptive statistics, probability distributions, and statistical methods.
3) Examples of assignments are provided, including how to construct stem-and-leaf plots and calculate the mean, median and other statistical measures using sample data sets.
This document discusses the organization and classification of data in statistics. Classification involves arranging data into groups based on common characteristics to make the data easier to understand and analyze. There are different types of classification such as geographical, chronological, quantitative, and qualitative. Geographical classification organizes data by location. Chronological classification orders data by time periods. Quantitative classification groups numerical data by measured values. Qualitative classification sorts non-numerical attributes like gender or education. Classified data can be presented in tables to facilitate comparison and analysis.
2. week 2 data presentation and organizationrenz50
Here are the answers to the questions:
A.
1. The variables in the graph are age (x-axis) and frequency (y-axis).
2. The variables are quantitative.
3. The variables are discrete.
4. No, a pie chart could not be used to display this data since it involves quantitative variables rather than categorical variables.
B.
1. A line graph would most appropriately represent the number of students enrolled at a local college for each year during the last 5 years. This involves two quantitative variables - years on the x-axis and enrollments on the y-axis.
2. A bar graph would most appropriately represent the frequency of each type of crime committed in
Stat 511-mannual-prof saxena-i sem IGKV COLLEGE OF AGRICULTURE RAIPURDebasis Panda
1. The document discusses various methods for organizing and presenting data, including classification, tabulation, and diagrammatic representations. Classification involves arranging data into logical groups, while tabulation involves systematically listing data in rows and columns. Common types of classification include geographical, chronological, qualitative, and quantitative.
2. Several methods for visually presenting data are described, including line and bar diagrams, histograms, frequency polygons, frequency curves, and ogives. Boxplots are also introduced as a method that splits data into quartiles to depict the median and interquartile range.
3. Formulas for calculating measures of central tendency are provided, including the arithmetic mean, which is the sum of all values divided by the total number of
This document discusses various methods of processing and analyzing data, including classification, tabulation, and graphical presentation. It covers the following key points:
1. Classification involves organizing data into categories based on characteristics like geography, time, qualitative attributes, or quantitative values. Common classification types include geographical, chronological, qualitative, and quantitative.
2. Tabulation is the orderly arrangement of data in columns and rows to simplify, condense, and compare information. Good tables are clear, appropriately sized, self-explanatory, and include titles, captions, stubs, and footnotes.
3. Graphical presentation of data through diagrams and charts like bar graphs and pie charts can help with understanding, interpretation, and
The document discusses tabulation, which is presenting data in tables to interpret results easily. It describes characteristics of good tables, types of tables including simple, complex, and multi-way tables. Rules of tabulation include title, size, structure. Significance is that tables allow easy data comparison, analysis, and detect missing data. Tabulation simplifies complicated data and maximizes data representation in minimal space.
This document discusses the process of data processing which involves reducing raw data into a manageable size between the stages of data collection and analysis. The four main stages of data processing are:
1) Editing - Checking for errors and omissions to ensure consistent and complete data
2) Coding - Reducing large amounts of data into a form that can be easily handled by computer programs
3) Classification - Grouping related data into classes and subclasses based on common characteristics
4) Tabulation - Arranging classified data into tabular form using rows and columns for presentation and comparison.
The document discusses the meaning and objectives of descriptive statistics. It defines descriptive statistics as a branch of statistics that deals with describing and summarizing collected data through organization, classification, and presentation. The key aspects covered include:
- Organizing data through classification, tabulation, and graphical/diagrammatic presentation. This includes frequency distributions, histograms, polygons, etc.
- Measures of central tendency and variability that summarize data distributions, such as mean, median, and standard deviation.
- Descriptive statistics involves organizing and summarizing raw data to define characteristics of populations. This enables researchers to describe phenomena based on sample data.
Introduction to statistics.pptx basic of introduction to statisticsRakshuPadesur
An introduction to statistics presentation by Rakshita Padesuron slideshare covers topic such as:
defination ,charaterstic, types, function of statistics
classificatio, types, ojectives ,functions and some example
tabulation , table of tabulation ect..,
these help toundestand basic of statistics and it help to competative exams,
Tabulation of data-Development of Research Instrument/ Tool and Analysis ShaharyarShoukatShou
The document discusses tabulation, which is the process of systematically organizing data into a table. The key aspects covered include:
- Tabulation facilitates comparison, statistical analysis, and interpretation of data by arranging related information close together.
- The main components of a statistical table are the title, caption, stub, body, footnotes, and source note. Proper tabulation follows guidelines like using consistent row/column headings and including subtotals.
- Tabulation has benefits like simplifying complex data, enabling easy comparison, economizing space, and facilitating statistical analysis. Well-structured tables clearly present essential data features.
- There are three main methods for collecting data: direct observation, experiments, and surveys. Some common ways to conduct surveys include mailing questionnaires, telephone interviews, and face-to-face interviews.
- Data can be either qualitative (characterized by words) or quantitative (characterized by numbers). Quantitative data can further be classified as discrete or continuous.
- It is important to ensure data is both valid, meaning it accurately measures what it intends to, and reliable, meaning consistent results are produced. Primary data collection directly by the researcher allows for more control but takes more time and resources than using secondary sources.
This section discusses analyzing categorical data:
- It introduces categorical variables and how to construct frequency tables and graphs like bar graphs and pie charts to display categorical variable distributions.
- It explains how to construct and interpret two-way tables to analyze relationships between two categorical variables, and how to examine marginal and conditional distributions.
- It emphasizes organizing statistical problems using a four step approach of stating the question, planning an approach, doing calculations/graphs, and concluding.
This document provides information on various methods of presenting data, including tabular, graphical, and textual presentation. It discusses principles of data presentation and different types of tables, charts, and diagrams that can be used including simple tables, frequency distribution tables, bar charts, histograms, line graphs and pie charts. It also covers concepts like class intervals, frequency, relative frequency and discusses worked examples of various methods of data presentation.
This document discusses tabulation, which is the process of organizing and presenting statistical data in a table with rows and columns. It describes the key parts of a table including the title, stubs, column headings, body, source and footnotes. The document outlines different types of tables such as simple, double and complex tables. It also explains the differences between classification and tabulation, and highlights the importance of tabulation for summarizing, comparing and analyzing data in a clear format.
Focus Group Discussions (FGDs) are defined as semi structured group discussions, which yield qualitative data on the community level by facilitating interaction between participants.
This document provides an overview of human resource development (HRD). It defines HRD as activities designed by an organization to provide members with necessary skills. HRD emerged to address employee development beyond training. HRD is a function of human resource management (HRM) that focuses on training, organizational development, and career development. Effective HRD requires needs assessment, design, implementation, and evaluation. Key challenges for HRD include a changing workforce, global competition, skills gaps, and the need for lifelong and organizational learning.
This document provides information about a student resource guide for the third edition of the textbook "Human Resource Development: Managing Learning and Knowledge Capital" by Brian Delahaye. The resource guide is intended to provide students with a concise and practical study support for the textbook. It includes the learning objectives, a brief chapter overview, a suggested lecture outline, and multiple choice questions for each chapter to aid the student's learning. Additionally, complementary PowerPoint presentations and an instructor's resource guide are available.
Gender refers to the socially constructed roles, responsibilities, identities, and expectations assigned to men and women by society, as opposed to sex which refers to biological and physiological differences. Gender is influenced by social and cultural factors rather than biology alone. Sociological perspectives on gender include functionalism, which views traditional gender roles as serving important social functions, and feminism, which argues that patriarchal societies promote gender inequality that benefits men over women. Evidence from different cultures demonstrates that gender roles vary significantly across societies and over time, supporting the view that gender is socially constructed rather than innate.
This document provides an overview of human rights and their classification. It defines human rights as the inherent rights of all people by virtue of being human, as derived from human dignity. Human rights are categorized into civil/political rights and economic/social/cultural rights. It also describes Karel Vasak's three generations of human rights: first generation as civil/political, second as economic/social/cultural, and third as collective rights. The document outlines the core provisions of the two main international human rights covenants and discusses various UN human rights bodies and instruments.
Industrial sociology is the scientific study of human social behavior and interactions within industrial settings, including work organizations, labor markets, and the effects of technological change and globalization. It examines relationships within businesses between owners, managers, and workers, as well as the conditions affecting industries like politics, laws, and economic performance. Industrial relations encompass the whole field of relationships that exist due to necessary collaboration between men and women in industry, including organizations of workers and management, the state, companies, and individual workers. The goal of industrial relations is to avoid disputes and raise productivity through collective bargaining, participation, and mutual trust between unions and management.
Sociology work and industry 5th edition slideswaheedaq
The document discusses various theoretical perspectives in the sociology of work, including Durkheim's structural functionalism, Marx's conflict theory, and Weber's interpretivism. It also addresses key topics like bureaucracy, globalization, gender inequality, and occupations. The document takes a sociological approach to defining and analyzing different aspects of work.
The structure of religion includes various components such as theologies, creeds, rituals, sects, symbols and sacred literature. Theologies are systematic explanations of a religion's beliefs regarding the relationship between God and the universe. Creeds represent the codified set of doctrines of a religious group. Rituals are standardized religious practices and ceremonies that are performed for various purposes like communicating with the supernatural. Sects are religious groups that split off from larger denominations due to doctrinal or other differences. Symbols represent religious groups and concepts. Sacred literature includes religious texts that outline the theological principles and beliefs of a faith.
Sociology is the study of human social life, groups, and societies. It examines how people interact and form relationships within social groups and how these relationships shape human behavior and experience. Sociologists study social behavior scientifically and systematically to understand how individuals are influenced by living in groups and being part of society. They investigate social structures like institutions, social groups, and social order to explain how order is created, maintained, and reproduced in human societies.
1. THE UNIVERSITY OF AZAD JAMMU & KASHMIR
MUZAFFARABAD
Social Statistics
Assignment No. 01
Submitted to:
Sir Atif Abbasi
Submitted by:
Waheed Ahmad Qureshi
Roll No. 67
Page 1 of 15
2. Q. No.1: Discuss the different methods for the presentation of Data with Examples.
Methods for the Presentation of Data
Introduction:
Data may be collected through different sources. It is difficult to learn anything by examining
the un-organized data which is more often confusing than clarifying. The mass of data is
therefore to be organized and condensed into a form that can be easily understood and
interpreted. For this purpose techniques of classification, tabulation and graphic displays are
introduced.
Data:
Data is the collection of facts from which the conclusion may be drawn. It is further classified
into two types:
1. Primary Data
2. Secondary Data
Presentation of Data:
The methods which are used for the presentation of data are as under:
1. Classification
2. Tabulation
3. Graphical Representation
4. Diagrammatic Representation
1. CLASSIFICATION:
One of the methods of the Presentation of data is classification. It is a process of
dividing a set of observations or objects into classes or groups in such a way that:
i. Observations or objects in the same class or group are similar.
ii. Observations or objects in each class or group are dissimilar to the other
groups.
Definition:
“The process of arranging data into classes or categories according to some common
characteristics present in the data is called classification”. e.g. attributes, weights,
geographical characteristics etc.
Examples:
i. The population of country may be classified by religion as Muslim,
Christians, and Hindus etc.
ii. If in a primary school examination, we have the results of 1000 students, it
is difficult to tell. Similarly, by looking at the marks, as how many
Page 2 of 15
3. students obtained marks from 350 to 449, 450 to 549, 550 to 659 and so
on. Now if we arrange the data and make the groups and find out number
of students in each group. It is easy to understand.
Basis of classification:
Although data can be classified by many characteristics but there are four
important basis for classification of data
Qualitative:
When data are classified by attributes, e.g., sex, religion,, martial status,
morality, friendship etc.
Quantitative:
When data are classified by quantitative characteristics, e.g., heights, weights,
age, speed etc
Spatial or Geographical:
When data are classified by geographical region or location e.g., the
population of a country may be classified by provinces, divisions, districts or
towns
Chronological or Temporal:
When data are classified by their time of occurrence such arrangement is
called a time series.
Basic principals of classification:
While classifying large sets of data, the following points should be taken into
consideration
• The classes or categories, into which the data are to be divided, should be
mutually exclusive and no overlap should exist between successive
classes. In other words, classes should be arranged so that each
observation or object can be placed in one and only one class.
• The classes or categories should be all inclusive. All inclusive classes are
classes that include all the data.
• As far as possible, the conventional classification procedure should be
adopted.
• The classification procedure should not be so elaborate as to lead to trivial
classes nor should it be so crude as to concentrate all the data in one or two
classes.
2. TABULATION:
Statistical table is a systematic arrangement of data into vertical columns and
horizontal rows. The process of arranging data into rows and columns is called
tabulation. According to Prof. Bowely, “Tabulation is the intermediate process
between the accumulations of data, in whatever form they are obtained and the final
accounts of the results shown by the statistics”.
Page 3 of 15
4. Tabulation may be:
Simple
When tabulation is done according to one way classification, like the population of a
country is classified according to religion or marital status, called simple
classification.
Double
When tabulation corresponding to two way classification, such as tabulation of data
classified by religion and sex or religion and material status is an example of double
tabulation.
Complex
When tabulation is done by many-way classification, it is called complex tabulation.
An example of complex tabulation is the presentation of data on the population of a
country classified by age, sex, religion and marital status etc.
Main Parts of Table:
As statistical table has at least four parts – the title, stub, head and body. In addition,
some tables have one or more prefatory notes, a foot note and a source note. All these
are shown in the following Table:
Population of Punjab and Baluchistan provinces by sex for 1961 and 1972 censuses1
Punjab Baluchistan
Census
Male Female Total Male Female Total
1961 1364 19938 2558 640 521 1161
3 1
1972 1994 17566 3750 1272 1133 2405
2 8
A description of there parts are given below:
Title:
Every table must have title; it should be brief, clearly worded and self explanatory.
The title should describe
a. what the data represents
b. where the data come from
c. how the data have been classified
d. where the data were observed
Column, Captions and Box Head
The heading of a column is called a column caption and the section or parts of the
table containing the column caption is known as box head. The captions should
clearly defined and written in the centre of the columns.
Row Captions and Stub
1
Population census reports, 1961 and 1972
Page 4 of 15
5. The heading or title of a row is called the row caption and the section of the table
containing row captions is known as stub.
Prefatory Notes and Foot Notes
Both these notes are used to explain certain characteristics of the data. They give
additional specification of the data.
a. The prefatory notes appear between the title and the body.
b. A foot note appears immediately below the body of the table.
3. GRAPHICAL REPRESENTATION
Visual display of statistical data in the form of points, lines, areas and other
geometrical forms and symbols is the most general term known as graphical
representation of data.
Statistical data can be studies with this method without going through figures
presented in the form of tables.
Graph
It is in the form of continuous curve, shown on a graph paper.
Diagram
It Is in the form of one, two or three dimensional or in pictorial form.
Types of diagrams or charts
Following types of diagrams are in common use
One dimensional diagrams or charts
These diagrams have only one dimension. They are used to represent data not having
large variations. It consists of
• Simple bar diagram or chart.
• Multiple bar diagram or chart
• Sub divided bar diagram or component chart.
Simple Bar Diagram or Chart
This chart consists of vertical or horizontal bars of equal width. The length of bars is
taken proportional to the magnitude of the values presented.
Example
Draw simple bar chart to represent the production of wheat in Pakistan during the
years 1971 to 1976
Page 5 of 15
6. Year 1971 1972 1973 1974 1975 1976
Production
55 60 72 69 69 72
(lake tons)
lakh tons
80
70
60
50 wheat
40
30
20
10
0
1971
1972
1973
1974
1975
1976
Simple bar chart showing production of wheat in Pakistan for the years 1971 to 1976
Multiple Bar Charts
It is an extension of simple bar chart. In this chart grouped bars are used to represent
related set of data. For example, we may represent the imports of a country for a
number of years by means of multiple bars chart, taking groups of 2 bars each--- one
representing imports and the other representing exports. Each bar in a group is shaded
or colored differentially for distinction. Similarly it may have more than 2 groups of
data
Example; draw a multiple bar chart to represent the imports and exports of Pakistan
(value in crores of rupees ) for the year 1970-71 to 1974-75
Years Imports Exports
1970-1971 370 200
1971-1972 350 337
1972-1973 840 855
1973-1974 1438 1016
1974-1975 2092 1029
Source: state bank of Pakistan
Page 6 of 15
7. 2500
2000
1500
Imports
Exports
1000
500
0
1970-1971 1971-1972 1972-1973 1973-1974 1974-1975
Multiple bar chart showing Imports and Exports of Pakistan from 1970-71 to 1974-75
Sub Divided or Component Bar Chart
This chart is used when it is desired to present data which are subdivisions of totals.
Since the bars show the various component parts, it is also called component bar
charts. In this charts simple bars are drawn with lengths proportion to the totals and
then sub divided in to the parts in the ratio of their components. The components or
shaded or colored differentially so as to distinguish differ parts.
Example: Draw sub divided bar diagram to represent the male and female population
of five divisions of Pakistan in 1961.
Division Male Female Both Sexes
Bahawalpur 14 12 26
Rawalpindi 21 19 40
Sargodha 32 28 60
Lahore 35 30 65
Multan 35 31 66
Source: Population census Report, 1961.
Page 7 of 15
8. 70
60
50
40
Female
Male
30
20
10
0
1 2 3 4 5
Sub-divided bar graph showing male & female population of five divisions of
Pakistan in 1961
Pie charts
Like the rectangles, circles can also be used to represent and compare data having
large variation. Circles are drawn with radius proportional to the square roots of
quantities to be represented (because the area of a circle is given by 2πr2). Circles are
sub divided into sectors when the totals and their sub divisions have to be compares.
The sectors are shaded or colored differentially. This diagram is used for the same
purpose as the sub divided rectangles however it is difficult to compare areas visually.
For this reason this an inferior form of presentation. The titles describing each
component part should be written in each sector.
To construct a pie chart draw a circle with some suitable radius we know that a circle
consists of 360°. To show the components pair by sectors we calculate the angles for
each sectors by the formula.
The circle is divided in to different sectors by constructing angles at the centre by
means of a protractor. The arrangement of the sectors is generally clock wise.
Example: Draw a pie chart to show the distribution
Page 8 of 15
9. Academic Number of Cumulative
Angles of sectors
qualification Employees Angles
No Education 47 (47/296) x 360°= 57° 57°
Primary 25 (25/296) x 360°= 30° 87°
Middle 63 77° 164°
Matric 97 118° 282°
Intermediate 26 32° 314°
Bachelor 23 28° 342°
Master 15 18° 360°
Total 296 360
Sources: Census of Punjab government Employees
'Punjab Government Employees by Academic
Qualification'
No Education
Primary
Middle
Matric
Intermediate
Bachclor’s Degree
Master’s Degree
Graphs:
As we know, the diagrams are useful for representing spatial series. Diagrams fail
when we want to represent a statistical series spread over a period of time, or a
frequency distribution or two related variables in visual form. For such
representations, graphs are employed.
Graphs present the data in a simple, clear and effective manner, facilitate comparison
between two or more than two statistical series and help us in appreciating their
significance readily. Graphs can be divided into two main categories, namely:
i. Graph of time series
ii. Graphs of frequency distribution
Page 9 of 15
10. Example:
Draw a histogram to represent production of cigarettes in Pakistan for the year 1959
to 1968
1959- 1960- 1961- 1962- 1964- 1965- 1966- 1967- 1968-
Year
60 61 62 63 65 66 67 68 69
Production 928 1088 1326 1456 1767 1984 2445 3205 3493
4000
3500
3000
2500
2000
1500
1000
500
0
1959-60 1960-61 1961-62 1962-63 1963-64 1964-65 1965-66 1966-67 1967-68
A histogram consists of a set of adjacent rectangles having bases along the X-axis
(marked off by class boundaries) and areas proportional to the class frequencies. If the
class interval sizes, are equal the heights of the rectangles are also proportional to the
class frequencies if the class interval sizes are not equal, then the heights of the
rectangles have to be adjusted.
Histogram for Frequency Distribution of Annual Death Rates
Class Boundaries Frequency
3.45 – 4.45 1
4.45 – 5.45 4
5.45 – 6.45 5
6.45 – 7.45 13
7.45 – 8.45 12
8.45 – 9.45 19
9.45 – 20.45 13
10.45 – 11.45 10
11.45 – 12.45 6
12.45 – 13.45 4
13.45 – 14.45 1
Page 10 of 15
11. Academic Number of Cumulative
Angles of sectors
qualification Employees Angles
No Education 47 (47/296) x 360°= 57° 57°
Primary 25 (25/296) x 360°= 30° 87°
Middle 63 77° 164°
Matric 97 118° 282°
Intermediate 26 32° 314°
Bachelor 23 28° 342°
Master 15 18° 360°
Total 296 360
Sources: Census of Punjab government Employees
'Punjab Government Employees by Academic
Qualification'
No Education
Primary
Middle
Matric
Intermediate
Bachclor’s Degree
Master’s Degree
Graphs:
As we know, the diagrams are useful for representing spatial series. Diagrams fail
when we want to represent a statistical series spread over a period of time, or a
frequency distribution or two related variables in visual form. For such
representations, graphs are employed.
Graphs present the data in a simple, clear and effective manner, facilitate comparison
between two or more than two statistical series and help us in appreciating their
significance readily. Graphs can be divided into two main categories, namely:
i. Graph of time series
ii. Graphs of frequency distribution
Page 9 of 15