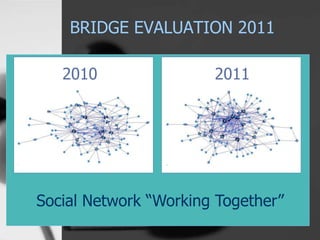
SOCIAL NETWORK
ANALYSIS
AN INTRODUCTION
Presented by Nadia Williams
on 17 July 2014
INTRODUCTION
• Social Network Analysis (SNA) is an approach/tool
that enables us to examine and understand the
connections between people/organisations/etc.
• SNA is derived from both sociology and mathematics,
and can be explained as the use of network theory to
analyse social networks
INTRODUCTION
• It focuses on the connections that drive certain
phenomenon that involve a network of human players
• In other words, SNA helps us to understand how
relationships form, what kinds of relational structures
emerge from the building blocks of individual
relationships, and what, if any, are the impacts of
these relationships.
NODES AND TIES
• Social network analysis views social relationships in
terms of network theory consisting of nodes (actors,
vertices) and ties (also called edges, links, or
connections).
• Nodes are the individual actors within the networks,
and ties are the relationships between the actors.
• There can be many kinds of ties between the nodes.
NODES AND TIES
• In its simplest form, a social network is a map of
specified ties, such as friendship, between the nodes
being studied.
• Nodes are the individual actors within the networks,
and ties are the relationships between the actors.
Ties
Nodes
•Nodes / Actors / Vertices
− People
−Teams
−Organizations
−Etc.
•Ties / Links / Edges
Any relationships including:
−Friendship
−Family
−Communication
−Etc.
APPLICATION of SNA
SNA can be used for research in a number of fields
including:
• Sociology – crime detection, formation of gangs etc.
• Epidemiology – spread of diseases such as HIV/AIDS,
etc.
• Economics – social capital, framework for understanding
international trade, etc.
• Management – change management, how an
organization is mapped out, etc.
• Information Sciences – scientific collaborations, trend
analysis, etc.
EXAMPLE
Evaluation of Bridge’s Maths & Science Learner
Support Programmes Community for Effective
Practice
• Is the Bridge social network helpful to you and
your practice?
– Do you follow Bridge on its other social networks
(LinkedIn, Facebook, Twitter)?
– Do you prefer communication to be face-to-face?
– Do you read email reports of meetings and colloquia?
– Do you receive too little or too much communication from
Bridge?
BRIDGE EVALUATION 2011
• Identify boundaries:
– All who have attended (approximately 180 out of 210)
• Compiled the list
• Rate for 2010 and 2011
– if you do not know the person
– if you do know the person
– if you work/collaborate with the person
BRIDGE EVALUATION 2011
2010
2011
CONNECTEDNESS
BRIDGE EVALUATION 2011
Social Network “Know Each Other”
2010 2011
BRIDGE EVALUATION 2011
Social Network “Working Together”
2010 2011
BRIDGE EVALUATION 2011
One hub in 2010
BRIDGE EVALUATION 2011
Multiple hubs in 2011
ASH REGIONAL LANDSCAPE
• Khulisa Management Services was asked to perform a
SNA to show (as a graph) the relationships between
organisations for USAID on behalf of GMS ASH.
• We were provided with an Excel spreadsheet describing
the relationships through a matrix:
Collaboration Matrix –
Regional Landscape Analysis
WAHO UEMOA ECOWAS AU COMESA EAC
ECOWAS: Economic Community of West African
States
F, I, T I
Information
Exchange
Information
Exchange
Information
Exchange
Information
Exchange
SADC: Southern Africa Development Community I
Information
Exchange
Information
Exchange
Information
Exchange
Information
Exchange
UNICEF
Information
Exchange
ECCAS: Economic Community of Central African
States
I
Information
Exchange
Information
Exchange
Information
Exchange
Information
Exchange
IGAD: Intergovernmental Authority on
Development
Information
Exchange
Information
Exchange
Information
Exchange
Information
Exchange
UEMOA: West African Economic and Monetary
Union (in French)
I
Information
Exchange
Information
Exchange
CEFOREP - Centre de Formation et de Recherche
en Santé de la Reproduction
SIDA
Financial
Support
ASH REGIONAL LANDSCAPE
ASHREGIONALLANDSCAPE
SOCIAL NETWORK
ANALYSIS
ANY QUESTIONS?
Presented by Nadia Williams
on 17 July 2014

Social Network Analysis

  • 1.
    SOCIAL NETWORK ANALYSIS AN INTRODUCTION Presentedby Nadia Williams on 17 July 2014
  • 2.
    INTRODUCTION • Social NetworkAnalysis (SNA) is an approach/tool that enables us to examine and understand the connections between people/organisations/etc. • SNA is derived from both sociology and mathematics, and can be explained as the use of network theory to analyse social networks
  • 3.
    INTRODUCTION • It focuseson the connections that drive certain phenomenon that involve a network of human players • In other words, SNA helps us to understand how relationships form, what kinds of relational structures emerge from the building blocks of individual relationships, and what, if any, are the impacts of these relationships.
  • 4.
    NODES AND TIES •Social network analysis views social relationships in terms of network theory consisting of nodes (actors, vertices) and ties (also called edges, links, or connections). • Nodes are the individual actors within the networks, and ties are the relationships between the actors. • There can be many kinds of ties between the nodes.
  • 5.
    NODES AND TIES •In its simplest form, a social network is a map of specified ties, such as friendship, between the nodes being studied. • Nodes are the individual actors within the networks, and ties are the relationships between the actors. Ties Nodes •Nodes / Actors / Vertices − People −Teams −Organizations −Etc. •Ties / Links / Edges Any relationships including: −Friendship −Family −Communication −Etc.
  • 6.
    APPLICATION of SNA SNAcan be used for research in a number of fields including: • Sociology – crime detection, formation of gangs etc. • Epidemiology – spread of diseases such as HIV/AIDS, etc. • Economics – social capital, framework for understanding international trade, etc. • Management – change management, how an organization is mapped out, etc. • Information Sciences – scientific collaborations, trend analysis, etc.
  • 7.
    EXAMPLE Evaluation of Bridge’sMaths & Science Learner Support Programmes Community for Effective Practice • Is the Bridge social network helpful to you and your practice? – Do you follow Bridge on its other social networks (LinkedIn, Facebook, Twitter)? – Do you prefer communication to be face-to-face? – Do you read email reports of meetings and colloquia? – Do you receive too little or too much communication from Bridge?
  • 8.
    BRIDGE EVALUATION 2011 •Identify boundaries: – All who have attended (approximately 180 out of 210) • Compiled the list • Rate for 2010 and 2011 – if you do not know the person – if you do know the person – if you work/collaborate with the person
  • 9.
  • 10.
    BRIDGE EVALUATION 2011 SocialNetwork “Know Each Other” 2010 2011
  • 11.
    BRIDGE EVALUATION 2011 SocialNetwork “Working Together” 2010 2011
  • 12.
  • 13.
  • 14.
    ASH REGIONAL LANDSCAPE •Khulisa Management Services was asked to perform a SNA to show (as a graph) the relationships between organisations for USAID on behalf of GMS ASH. • We were provided with an Excel spreadsheet describing the relationships through a matrix: Collaboration Matrix – Regional Landscape Analysis WAHO UEMOA ECOWAS AU COMESA EAC ECOWAS: Economic Community of West African States F, I, T I Information Exchange Information Exchange Information Exchange Information Exchange SADC: Southern Africa Development Community I Information Exchange Information Exchange Information Exchange Information Exchange UNICEF Information Exchange ECCAS: Economic Community of Central African States I Information Exchange Information Exchange Information Exchange Information Exchange IGAD: Intergovernmental Authority on Development Information Exchange Information Exchange Information Exchange Information Exchange UEMOA: West African Economic and Monetary Union (in French) I Information Exchange Information Exchange CEFOREP - Centre de Formation et de Recherche en Santé de la Reproduction SIDA Financial Support
  • 15.
  • 16.
  • 17.
    SOCIAL NETWORK ANALYSIS ANY QUESTIONS? Presentedby Nadia Williams on 17 July 2014