Downloaded 33 times


![9
2. Principles
2.1. Clinker phases
Essentially cement clinker consists of tricalcium silicate (Alite), dicalcium silicate (Belite),
tricalcium aluminate (Aluminate) and calcium aluminoferrite (Aluminoferrite). It is produced
from a raw material mix which contains mainly calcium oxide (CaO), silicon dioxide (SiO2),
aluminium oxide (Al2O3) and iron oxide (Fe2O3). A summary of the potential phase
composition are shown in Table 1.
Table 1: Potential phase composition of German cement clinker [1].
Clinker phases
Chemical
formula
Abbreviated
formula
Content in % by mass
max 85
av 65
Tricalcium silicate
Alite
3CaO*SiO2 C3S
min 52
max 27
av 13
Dicalcium silicate
Belite
2Cao*SiO2 C2S
min 0.2
max 16
av 8
Calcium aluminoferrite
(Aluminoferrite)
2CaO*(Al2O3,
Fe2O3)
C2(A,F)
min 4
max 16
av 11
Tricalcium aluminate
(Aluminate)
3CaO*Al2O3 C3A
min 7
max 5.6
av 1.2Free CaO CaO
min 0.1
max 4.5
av 1.5MgO, total MgO
min 0.7
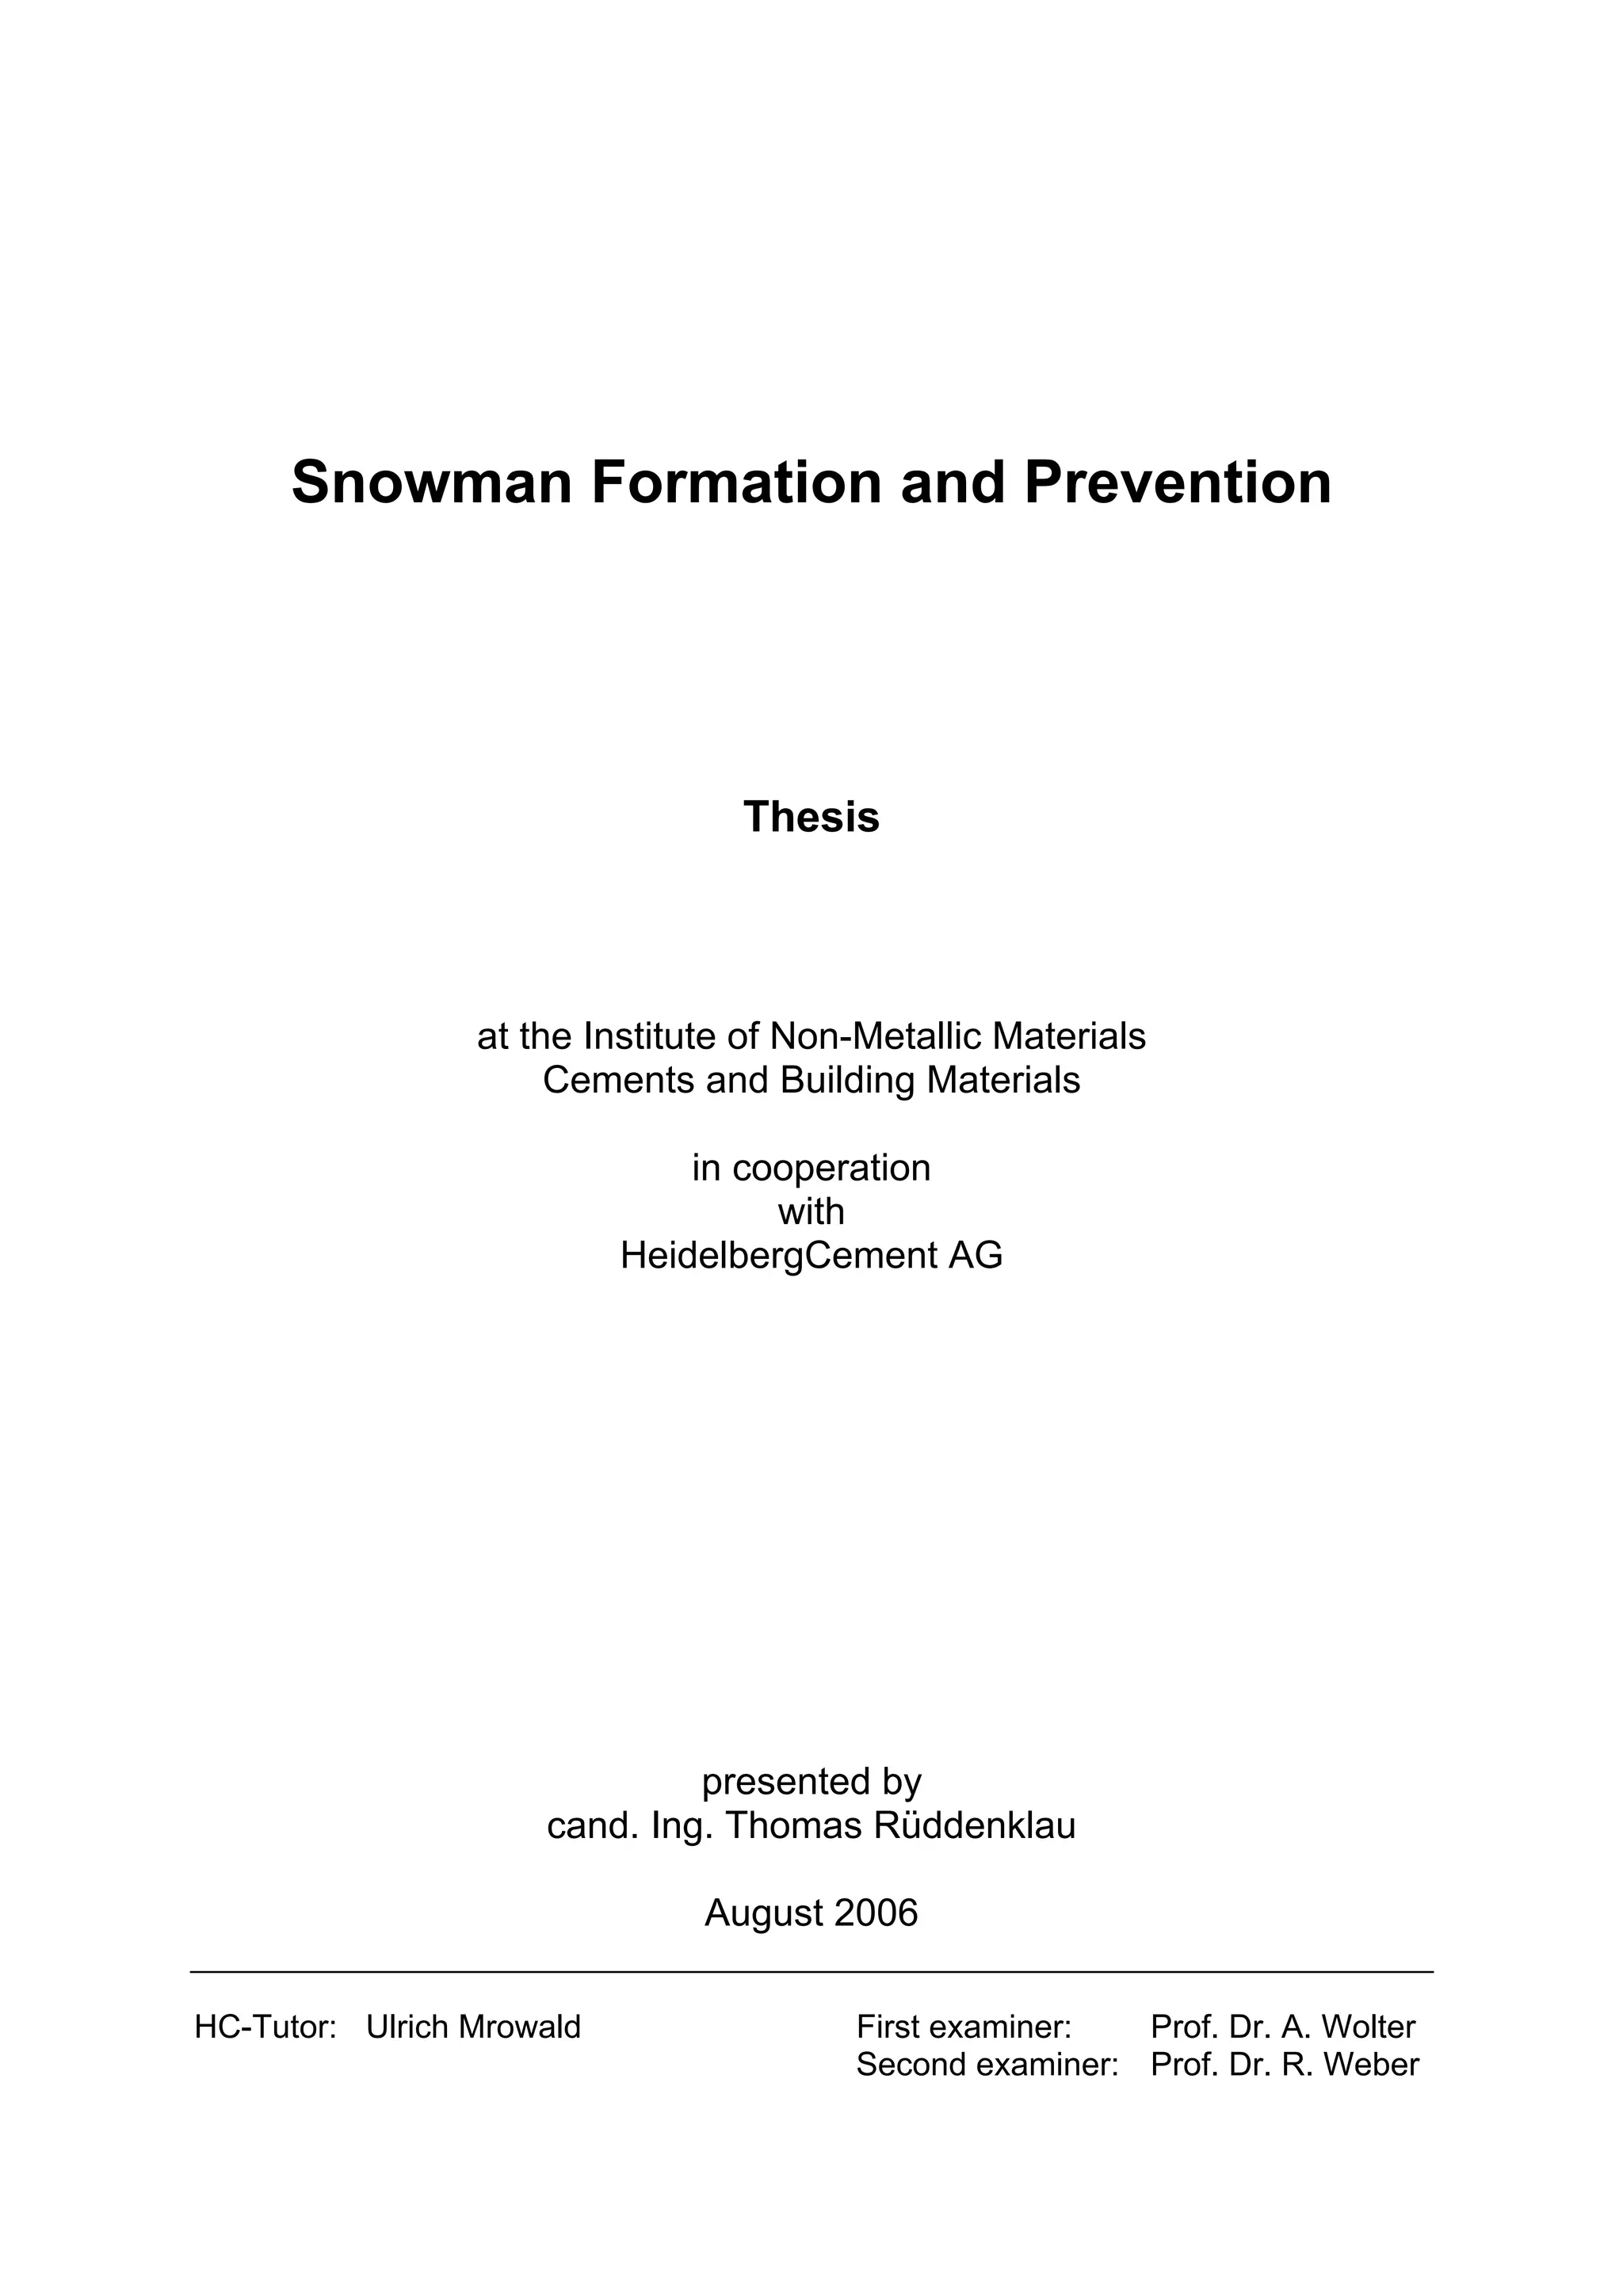
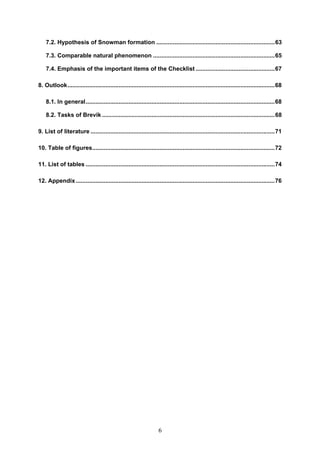
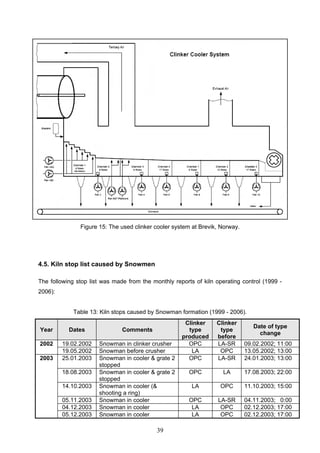
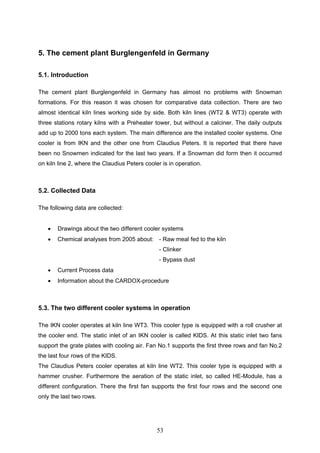
The raw material mix is fed into the kiln (see chapter Burning process). By increasing the
temperature during the process the following reactions take place to form clinker phases
(Figure 1) [2]:
100°C Evaporation of free water
>500°C Evolution of combined water
>860°C CaCO3 CaO + CO2
>900°C Reactions between CaO and Al2O3, Fe2O3 and SiO2
>1200°C Melting phase formation
>1250°C Formation of C3S and finished reaction of CaO](https://image.slidesharecdn.com/rueddenklau-snowman-prevention-180622055019/85/snowman-9-320.jpg)
![10
Figure 1: Clinker phases formation [3].
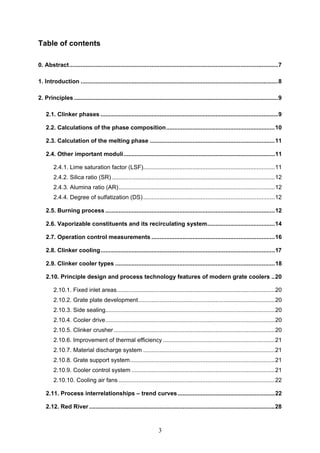
2.2. Calculations of the phase composition
The phase composition of a cement clinker can be calculated from the values of the chemical
analyses according to R.H. Bogue. For a cement clinker of usual composition, which
contains C3S, C2S, C3A and C4AF and has the AR >0.638, the following formulae can be
used:
C3S = 4.071*CaO – 7.600*SiO2 – 6.718*Al2O3 – 1.430*Fe2O3
C2S = 2.867*SiO2 – 0.754* C3S
C3A = 2.670*Al2O3 – 1.692*Fe2O3
C4AF = 3.043 Fe2O3
These calculations do not reflect the reality but give a potential composition, which is used in
practice. However the phase composition given by the calculation is only valid if the clinker
melt is always in thermodynamic equilibrium with the solid clinker phases Alite and Belite. In](https://image.slidesharecdn.com/rueddenklau-snowman-prevention-180622055019/85/snowman-10-320.jpg)
![11
practice this precondition is never fulfilled. Therefore the calculation of Bogue always gives
too low values for the Alite and too high values for Belite content. But the difference between
the calculated and the actual clinker composition can be determined by quantitative
microscopic methods or by X-ray diffraction analysis. [1]
2.3. Calculation of the melting phase
The clinker contains 15 % to 25 % by mass of melt at the sintering temperature. The quantity
of melt (S) at 1400 °C can be calculated as follows [1]:
3232 2.295.2 OFeOAlS %mass
2.4. Other important moduli
The calculation of the Bogue potential clinker composition is descriptive but it does not give
any impression of the contents of CaO in the clinker. Therefore the raw material and the
clinker compositions are generally characterized by moduli in practice. These are called the
lime saturation factor (LSF), the silica ratio (SR) and the alumina ratio (AR). Additionally, the
degree of sulfatization (DS) is used. Table 2 shows potential values of German cement
clinker for those moduli. [1]
Table 2: Moduli of German cement clinker [1].
max av min
Lime saturation factor LSF 104 97 90
Silica ratio SR 4.1 2.5 1.6
Alumina ratio AR 3.7 2.3 1.4
Degree of sulfatization DS 109 77 35
2.4.1. Lime saturation factor (LSF)
The lime saturation factor shows the actual CaO content in the raw material mix or in cement
clinker relative to the maximum CaO amount, which can be combined with the SiO2, Al2O3
and Fe2O3 under industrial burning and cooling conditions. It can be calculated as follows [1]:
32322 65.018.180.2
100
OFeOAlSiO
CaO
LSF
%
%
mass
mass](https://image.slidesharecdn.com/rueddenklau-snowman-prevention-180622055019/85/snowman-11-320.jpg)
![12
2.4.2. Silica ratio (SR)
The silica ratio is the mass ratio of the silicon dioxide content relatively to the total of the
aluminum and iron oxide contents. It describes the solid/liquid ratio in the sintering zone of
the cement kiln. The following formula shows the mentioned relation [1]:
3232
2
OFeOAl
SiO
SR
%
%
mass
mass
2.4.3. Alumina ratio (AR)
The alumina ratio gives information about the quantity of calcium aluminate to calcium
aluminoferrite. It reflects the behaviour of the clinker melt. The following formula can be used
for calculation [1]:
32
32
OFe
OAl
AR
%
%
mass
mass
2.4.4. Degree of sulfatization (DS)
The degree of sulfatization shows the percentage of the alkalis, which are presented as alkali
sulfates. It can be calculated as follows:
ClONaOK
SO
DS
13.129.185.0
100
22
3
%
%
mass
mass
(* The chloride content will be considered if Cl (loI-free) is higher than 0.015 % by-mass.)[3]
A degree of sulfatization of 100 % means that all the alkalis in the clinker are totally
combined to alkali sulfate. If the degree of sulfatization is higher than 100 %, then there is a
sulfur excess, which forms Ca-langbeinite (K2SO4*2CaSO4) and/or anhydrite (CaSO4) [1].
2.5. Burning process
At present there are two different techniques of clinker manufacturing; one is the dry and the
other the wet process. For this thesis, only the dry process is relevant and will be described.
In the fifties and early sixties two types of external preheaters were developed; a preheater](https://image.slidesharecdn.com/rueddenklau-snowman-prevention-180622055019/85/snowman-12-320.jpg)
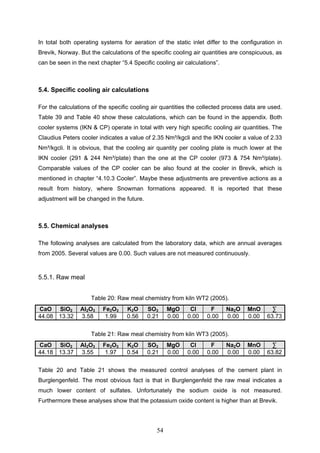
![13
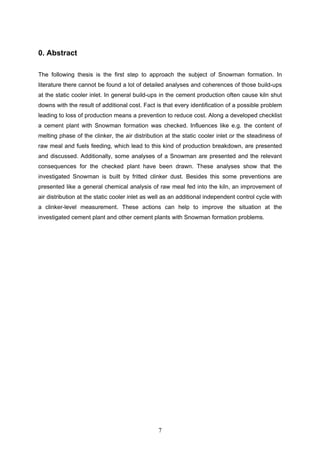
with Lepol grate and a suspension preheater. Progressively the suspension preheaters
predominate and are only important for this thesis [4].
Figure 2: Diagram of cyclone
preheater [1].
Figure 3: Diagram of cyclone preheater with
precalcination [1].
The suspension preheaters, also called cyclone preheaters, have a simple layout and
several designs. The first system of this type was developed by Klöckner-Humboldt-Deutz.
Several cyclones are arranged superposed and displaced sideways. They are connected
and form the preheater tower. The first one consists of four cyclone stages (Figure 2), but
newer kiln systems have up to six stages. The main task is to preheat the raw material. The
exhaust gases from the rotary kiln pass through the cyclones from bottom to top. The dry raw
material is added to the exhaust gases before the top cyclone stage, is separated from the
gas and then drops back into the gas flow before the next cyclone stage. This process is
repeated up to five times until the material is discharged from the last cyclone stage into the
kiln.
Since 1970 those kiln systems got a new development, which is called precalcination. This
means that the supply of fuel energy is divided into two firing systems. The new additional
firing system takes place at the preheater (Figure 3). This means that the calcium carbonate](https://image.slidesharecdn.com/rueddenklau-snowman-prevention-180622055019/85/snowman-13-320.jpg)
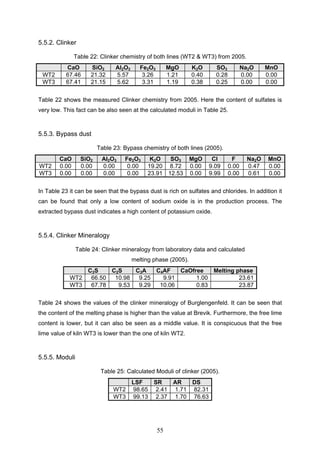
![14
in the kiln feed is dissociated over 90 %, when it enters the kiln. The degree of dissociation of
the kiln feed is between 40 – 50 % at conventional burning processes.
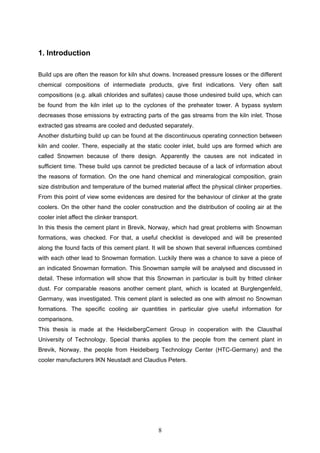
Figure 4: Different combustion air supply systems for
precalcination [1].
In the precalcining process the combustion air required for the firing system can be taken
from two different ways (Figure 4). On the one hand, through the rotary kiln (a) and on the
other hand directly from the clinker cooler through a special duct, which is called tertiary air
duct (b). The connection of this duct can be located in two different positions. The first one is
on top of the kiln head (connection between kiln and cooler) and the second is directly after
the kiln head on top of the cooler enclosure.
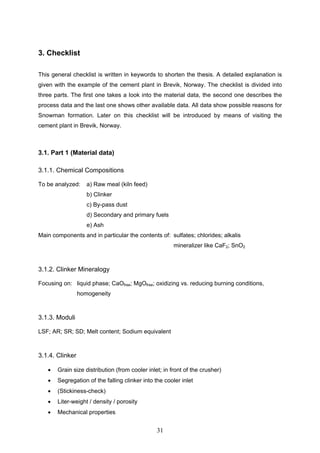
2.6. Vaporizable constituents and its recirculating system
The hot kiln gas, which heats the kiln feed by counter-current flow, contains various gaseous
or vapour compounds. These are formed from vaporized or disassociated constituents of the](https://image.slidesharecdn.com/rueddenklau-snowman-prevention-180622055019/85/snowman-14-320.jpg)
![15
kiln feed and the fuel. These are mostly alkali, sulphur and chloride compounds as well as
some trace elements like zinc, lead, chromium, cadmium, thallium, mercury and fluoride.
The vapour compounds condense in the cooler parts of the kiln or in the preheater or in the
downstream installations and deposit on the kiln feed and dust. If the fraction deposited on
the kiln feed passes the hot zone of the kiln again and vaporizes, then internal circulations
can be formed. The constituents are often carried out of the kiln and preheater area and
collected in the gas cleaning system. These constituents are added to the raw meal again
with the dust and go back to the kiln. This creates an external recirculating system (e.g. the
green line in Figure 5). The internal and external recirculation can be reduced by removing
part of the recirculating substances from the system e.g. by a bypass system.
Figure 5: Recirculating system [3].
The most important recirculating substances are alkali sulphates and alkali chlorides, which
can affect the operation of a cement kiln system. This recirculation system can be found at
the high temperature part of the kiln system (red line). They can form an additional melt in
the clinker, which influences the flow characteristics of the material in the kiln. [1]](https://image.slidesharecdn.com/rueddenklau-snowman-prevention-180622055019/85/snowman-15-320.jpg)
![16
2.7. Operation control measurements
The kiln operation is mostly monitored by several measurements:
Production rate [t/h]
Operating hours
Involuntary downtime hours
Total fuel rate [t/h]
Specific heat consumption [kcal/kg]
Proportion of fuel to precalciner / riser [%]
Secondary air temperature [°C]
ID fan draft [mmH2O]
Preheater exhaust gas temperature [°C]
O2 Kiln feed-end and exhaust gas [Vol.-%]
Downcomer O2 [%]
Kiln feed-end material: - LoI [%]
- SO3 [%]
Kiln drive power [kW]
There are also numerous other process parameters which should be logged. Those data are
needed to observe trends, which may indicate problems and to provide necessary mean data
for process analyses. Those factors are [2]:
Primary air tip velocity [m/sec]
Specific kiln volume loading [%]
Gas velocity in burning zone [m/sec]
Specific heat loading of burning zone [kcal/h per m² of effective burning zone cross-
section area]
Cooler air [Nm³/h per m² grate area]
Cooler + primary air [Nm³ per kg clinker]
Temperature, pressure and oxygen profile of preheater
NOx and CO in the waste gas](https://image.slidesharecdn.com/rueddenklau-snowman-prevention-180622055019/85/snowman-16-320.jpg)
![17
2.8. Clinker cooling
The cooling process influences the structure of the clinker, its mineralogical composition as
well as the grind ability and in consequence the quality of the produced cement.
The speed of clinker cooling has an influence on the ratio of crystalline and melting phases in
the clinker. During slow cooling almost all clinker components are formed of crystals,
whereas fast cooling delays the formation of crystals and avoids the generation of the
melting phase. A typical value of melting phase in clinkers from rotary kilns is in the range
from 20 – 25 mass-%. Additional fast cooling prevents the crystal growing and has also an
influence on the formation of the periclase crystals (MgOfree). The faster the cooling of clinker,
the smaller the periclase crystals grow, which emerge by crystallization of the melting phase.
A typical size of fast cooled clinker is in the range from 5 – 8 µm. Slow cooled ones have up
to 60 µm large crystals [5].
It is reported that the best clinker is obtained by cooling slowly to 1250 °C followed by rapid
cooling [4]. A summary of the effects of cooling rate on the clinker phase and their properties
can be seen in Figure 6.
Figure 6: Effect of cooling rate on cement properties and phases [4].](https://image.slidesharecdn.com/rueddenklau-snowman-prevention-180622055019/85/snowman-17-320.jpg)
![18
2.9. Clinker cooler types
Clinker coolers can be found basically in three different types. They are built as grate, rotary
or planetary coolers (Figure 7). The coolers differ mainly in the type of heat transfer, the
length and the design of pre-cooling zone (see the dot and dash line in Figure 7), the clinker
inlet temperature and the controllability.
Figure 7: Conventional cooler types [6].
The rotary coolers (Rohrkühler) are the older ones. The heat transfer of the hot clinker to the
cooling air occurs by counter current flow. The pre-cooling zone is longer than the one from
the grate coolers (Rostkühler), which decreases the clinker inlet temperature (1400 –> 1200
°C). The rotary cooler has an independent adjustable rotation speed from the rotary kiln. A
summary of essential technology data of rotary coolers can be found in Table 3.](https://image.slidesharecdn.com/rueddenklau-snowman-prevention-180622055019/85/snowman-18-320.jpg)
![19
Table 3: Essential technical data of rotary coolers [6].
Technical terms Unit Value
Throughputs t/d <2,000 – 4,500
L/D-relation - approx. 10:1
Rotation speed min-1 1 – 3
Incline % 3 – 5
Specific cooling air quantity m3N/kgCli. 0.8 – 1.1
Clinker inlet temperature °C 1,200 – 1,400
Clinker outlet temperature °C 200 – 400
Coolant efficiency ratio % 56 – 70
The planetary coolers (Satellitenkühler) consist of nine to eleven cooling tubes attached
around the perimeter of the kiln tube. The heat transfer also takes place by counter current
flow like the rotary coolers. This cooler cannot be adjusted. The specific cooling air quantity
is identical with the amount of combustion air. Caused by a longer pre-cooling zone the
clinker inlet temperature is lower compared to rotary coolers. Table 4 shows essential
technology data for this type of cooler.
Table 4: Essential technical data of planetary coolers [6].
Technical terms Unit Value
Throughputs t/d <3,000 – 4,000
L/D-relation - 9 – 11
Specific cooling air quantity m3N/kgCli. 0.8 – 1.0
Clinker inlet temperature °C 1,100 – 1,250
Clinker outlet temperature °C 200 – 300
Coolant efficiency ratio % 60 – 68
A grate cooler is nowadays the usual cooler type. In this cooler the clinker bed is transported
on a grate, which is cooled by transverse flow of air. This type of cooler requires more
cooling air than is needed for the combustion. The cooler exhaust air can be used e.g. for
drying the raw material. Table 5 presents the relevant information about the technology of
grate coolers.
Table 5: Essential technical data of grate coolers [6].
Technical terms Unit Value
Throughputs t/d 700 – >10,000
Grate area loading t/m2d 26 – 55 (100)
Grate incline degree up to 10
Specific cooling air quantity m3N/kgCli. (1.4) 1.6 – 2.6
Clinker inlet temperature °C 1,300 – 1,400
Clinker outlet temperature °C 70 – 120
Coolant efficiency ratio % 60 – 75](https://image.slidesharecdn.com/rueddenklau-snowman-prevention-180622055019/85/snowman-19-320.jpg)
![20
2.10. Principle design and process technology features of modern grate
coolers
2.10.1. Fixed inlet areas
The fixed inlet of a cooler is the most important interface between the rotary kiln discharge
and the clinker cooler. Almost all cooler manufacturers use a fixed inlet area with direct
aeration to improve the thermal efficiency of the cooler system and to increase the availability
of the grate plates in the hot zone. But the static inlet also increases the risk of the formation
of a “Snowman”, which is further strengthened by using more and more secondary fuels [7].
2.10.2. Grate plate development
Modern grate plates and their systems enhance the grate resistance for improving the air
distribution and its thermal efficiency of both aeration systems (air beam and chamber). The
new developed plates raise the service life of mechanical parts and minimize their wear.
Additionally they achieve a constant grate resistance over a longer operating time and
reduce the grate riddling by having constant, narrow gaps and slots [7].
2.10.3. Side sealing
New developments of grate seals minimize the gaps during thermal expansion of the grate
surface. Very long service lives are achieved by hardening the surface of the moving parts of
a plate. This prevents air channelling at the edges of a clinker cooler [7].
2.10.4. Cooler drive
The hydraulic cylinder drive is developed continuously. The stroke lengths and the cylinder
speeds are optimized to an effective conveying and minimization of wear (fewer thrusts) [7].
2.10.5. Clinker crusher
A modern cooler requires a roll crusher. This type of crusher is in fact more expensive than a
hammer crusher but the maintenance and spare-parts costs are very low. The dust load at
the end of a cooler is lower by using a roll crusher. This type of crusher deals with very large
pieces of coating from the kiln, which avoids unplanned kiln shut downs [7].](https://image.slidesharecdn.com/rueddenklau-snowman-prevention-180622055019/85/snowman-20-320.jpg)
![21
2.10.6. Improvement of thermal efficiency
By using a specific and controlled direct aeration of the static inlet, the efficiency of a cooler
can be improved significantly. The air and material distribution play a decisive role. The main
goals are that the clinker is optimally cooled down and gets the best heat recuperation. In
other words a good material distribution at the start of the grate, maintains a constant clinker
bed with a depth of about 500 to 900 mm over the entire grate area. This is achieved by a
static grate or special distribution grates for large widths. Additionally, a partition wall
between the recuperation zone and the cooling area minimizes the heat radiation loss and
assists the heat exchange [7].
2.10.7. Material discharge system
The discharge of grate riddling can be solved in different ways. One is the traditional hopper
arrangement with double flap valves or the other the level-controlled slides with a drag chain
to remove the material. Furthermore coolers with small gaps reduce the grate riddling.
The newest development is a cooler design without grate riddling. At this type of cooler,
known as a reciprocating beam cooler, the transport mechanism is separated from the
cooling mechanism. This means that the aeration base has no moving parts and is protected
by a stationary layer of clinker [7].
2.10.8. Grate support system
The internal roller or axle support systems are used for supporting the grate or moving frame.
The design and material of these systems is improved to reduce the wear [7].
2.10.9. Cooler control system
The following measuring and control loops can be used for an automatic process control of a
clinker cooler:
Cooling air volume flow
Chamber pressure / grate thrust rate
Kiln hood pressure
Grate plate temperature
Secondary / tertiary air temperature
Exhaust air temperature](https://image.slidesharecdn.com/rueddenklau-snowman-prevention-180622055019/85/snowman-21-320.jpg)
![22
Normally the grate speed is controlled by the pressure in the first air chamber or by a
combination of several initial air chambers. New developments like level radar, which
measures the clinker bed depth at the inlet of the cooler directly, can be very useful for the
control of the grate speed [7].
2.10.10. Cooling air fans
In general the cooling air comes from radial fans with double bearings. By using fans
operating at constant speed with small changes in air quantity the air volume is controlled by
a vane controller with an actuating mechanism. Only fans with large control reserves (e.g. at
the inlet area) are operating with frequency-controlled motors. The first fans indicate a
rotational speed of over 2000 rpm due to the high pressures of 80 – 130 mbar [7].
2.11. Process interrelationships – trend curves
The following trend curves show the qualitative coherence between the described process
parameters. The quantitative coherence and the wave shape are not taken into account. For
simplification all curves are drawn linear to get an impression for the existing
interdependency [8].](https://image.slidesharecdn.com/rueddenklau-snowman-prevention-180622055019/85/snowman-22-320.jpg)
![23
Table 6: Clinker capacity - clinker exit temperature - cooling air quantity [8].
Higher clinker capacity Higher clinker exit temperature
Constant: Thrust rate, cooling air
quantity
Increasing the capacity means a rise
of the specific grate area load
(capacity / grate area). If the cooler
is operating with the same cooling
air quantity and thrust rate after an
increase of capacity then the clinker
exit temperature will rise.
Higher cooling air quantity Lower clinker exit temperature
Constant: Clinker capacity, thrust
rate
It is significant, for the coherence
between clinker exit temperature
and cooling air quantity, that an
enhanced air volume leads to a
lower clinker exit temperature by
constant capacity.
Lower thrust rate Lower clinker exit temperature
Constant: Clinker capacity, cooling
air quantity
A lower thrust rate supports the heat
transfer between cooling air and
clinker and therewith it produces a
lower clinker exit temperature.
Higher clinker capacity Higher cooling air quantity
Constant: Clinker exit temperature
The clinker exit temperature will be
constant if the clinker capacity and
the cooling air is increased at the
same time and / or the thrust rate is
dropped. The cooling air quantity
and the thrust rate have to be
adjusted to reach an optimum.
The main statement is that an optimal adjustment of cooling air quantity and thrust rate is
preconditioned for a low clinker exit temperature.](https://image.slidesharecdn.com/rueddenklau-snowman-prevention-180622055019/85/snowman-23-320.jpg)
![24
Table 7:Specific cooling air quantity - secondary air temperature - cooler efficiency [8].
Lower cooling air admission Higher secondary air temperature
Constant: --
A change from an conventional grate plate
arrangement to a direct aeration in the first
chamber enables the reducing of specific
cooling air admission. A lower specific
cooling air admission accords with a lower
air speed and therewith an increasing of the
air stay in the cooler. The result is a better
heat transfer and a higher secondary air
temperature.
The specific cooling air admission at the
beginning of the cooler has to be high
enough to prevent clinker agglomeration.
Higher secondary air temperature Higher cooler efficiency
Constant: --
A higher secondary air temperature (higher
heat content of the secondary air) increases
the cooler efficiency.
Higher cooler efficiency Lower kiln heat requirement
Constant: --
A higher heat recuperation of the clinker
accords with a reduction of fuel in the kiln.
Therewith the kiln heat requirement and the
production cost of the kiln system decrease.
The main statement is that the cooling air admission at the beginning of a cooler affects
essentially the recuperation efficiency of the cooler.](https://image.slidesharecdn.com/rueddenklau-snowman-prevention-180622055019/85/snowman-24-320.jpg)
![25
Table 8: Clinker bed level - thrust rate/time of stay - clinker exit temperature - wear [8].
Lower thrust rate Higher clinker bed level
Constant: Clinker capacity
If the pressure-set point for the thrust
rate controlling is increased (higher
clinker bed level) than the grate thrust
rate will be lower and the time of stay of
the clinker in the cooler will be
enhanced.
Higher time of stay
Lower clinker exit temperature
Constant: Clinker capacity
The time of stay of the clinker per row or
rather chamber is higher with a lower
speed of the clinker. This means that
there is more time for heat transfer
between hot clinker and cold air. The
result is a lower clinker exit temperature
at the end of the cooler.
Lower thrust rate Less wear
Constant: Clinker capacity
A decreasing of the thrust rate means a
lower friction between the clinker and
the grate plate surface. The result is a
reducing of the wear.
The main statement is that a lower thrust rate affects a higher clinker bed level and a higher
time of stay of the clinker in the cooler. Furthermore the grate plate wear is lower by having a
lower thrust rate standard.](https://image.slidesharecdn.com/rueddenklau-snowman-prevention-180622055019/85/snowman-25-320.jpg)
![26
Table 9:Clinker bed level - clinker exit temperature - cooler efficiency - power requirement[8].
Higher clinker bed level Lower clinker exit temperature *
By increasing the clinker bed level
the time of stay of cooling air in the
clinker bed is enhanced. Therefore
the heat transfer is better and leads
to a lower clinker exit temperature.
This is confirmed when the clinker
bed level limit is not reached. At this
limit the cooling air starts to blow
through and causes a worser
cooling with higher exit
temperatures.
Higher clinker bed level Higher cooler efficiency *
A good heat transfer during a higher
clinker bed level causes an
increasing recuperation air
temperature. This leads to an
enhanced cooler efficiency. To pass
the clinker bed level limit has the
result of a worse heat transfer and
efficiency.
Higher clinker bed level
Higher fan pressure *
A high clinker bed level means a
higher resistance, which has to be
overcome by the fan. Until reaching
the clinker bed level limit, the fan
pressure will increase. After passing
this limit the pressure will decrease
because the air blows through.
The available fan pressure (by
definition of the cooling air quantity)
limits the maximum of the clinker
bed level.
Higher clinker bed level Higher power requirement
The rise of the clinker bed level and
the fan pressure effect an increasing
of the specific power requirement of
the fans by reducing the kiln heat
requirement.
* It is only essential until reaching the optimal clinker bed level.
The main statement is that clinker bed level optimizing decreases the operating expenses.](https://image.slidesharecdn.com/rueddenklau-snowman-prevention-180622055019/85/snowman-26-320.jpg)
![27
Table 10: Cooling air quantity - thrust rate - exhaust air quantity - exhaust air temperature [8].
Higher cooling air quantity Higher exhaust air quantity
If the cooling air quantity is increased in the
cooler (especially at the after-cooling-zone)
then the exhaust air quantity rises.
Higher thrust rate Higher exhaust air and clinker exit temperature
Constant: Clinker capacity, cooling air
quantity
If the cooler operates with a higher thrust
rate, then the time of recuperation will be
lower to achieve a sufficient heat transfer.
The result is that an enhanced amount of
heat will be transferred to the after-cooling-
zone. This leads to an increasing of the
exhaust air and clinker exit temperature.
Lower cooling air quantity Higher exhaust air temperature
Constant: Amount of combustion air, clinker
exit temperature
If the total cooling air quantity is reduced at
constant combustion terms, then the amount
of exhaust air will be decreased. The result
is a higher exhaust air temperature.
Higher exhaust air temperature Higher potential heat recovery
An efficient heat recovery leads to a higher
exhaust air temperature. This can be mainly
found at stage coolers because of their
intermediate cooling.
The main statement is that a higher thrust rate standard increases the heat losses of the
cooler, which means that clinker exit and cooler exhaust air temperature rises.](https://image.slidesharecdn.com/rueddenklau-snowman-prevention-180622055019/85/snowman-27-320.jpg)
![28
2.12. Red River
The “Red River” is a phenomenon in the cooler. Distinctive for it is a narrow stream of fine
clinker which appears far down in the cooler at higher temperatures than the neighboured
clinker. This narrow stream is often red hot (hence the name). Fine and coarse clinker will be
partly segregated in the kiln and fall separated to the right/left side of the static inlet. The fine
clinker falls on the kiln load side and the coarse clinker on the other one. If, additional to the
segregation, a clinker bed with unilateral or bilateral slope is formed on the static inlet, the
fine clinker slides down the slope to the side (Figure 8).
Figure 8: Formation of Red River [9].
The segregation and slope, not inclined in clinker flow direction, are the reasons for “Red
River”. Furthermore a “Red River” can be caused by a “Snowman” because of the
disturbance of aeration at the static inlet in the cooler. A fine clinker has a higher resistance
to the airflow than the coarse clinker, so the cooling air takes the path of least resistance,
which intensifies the “Red River” formation. Figure 9 shows the pressure losses of various
clinker sizes as a function of free air velocity. It can be seen that the particle size has a great
influence on air distribution, which can be described by pressure losses [10].](https://image.slidesharecdn.com/rueddenklau-snowman-prevention-180622055019/85/snowman-28-320.jpg)
![29
Figure 9: Pressure losses of various clinker sizes as a function of free air velocity [10].
2.13. Snowman
Another phenomenon in the cooler is the formation of a “Snowman”. A Snowman (SM) is a
type of build up formed in the static inlet. In general a snowman is caused by [9]:
fine and sticky clinker
fall of coating from the kiln.
A sticky clinker occurs when the content of the melting phase or the kiln temperature is too
high. In the one case the melting phase works as a binder and bonds the clinker together. In
the other case, fall of coating, a big lump stays in the cooler inlet without transport. The
surface of the big lump means an additional free area. Those formed platforms are the base
where a snowman can grow (Figure 10).](https://image.slidesharecdn.com/rueddenklau-snowman-prevention-180622055019/85/snowman-29-320.jpg)
![30
Figure 10: Formation of Snowman [9].
These big lumps cannot be cooled down. They store a lot of heat and disturb the aeration.
Figure 11 presents the non-steady state cooling of clinker for a number of different clinker
sizes as a function of time. It shows that it is physically impossible to cool large clinker
particles (> 100 mm) to an acceptable temperature within a reasonable retention time of 20
min, which is typical for grate coolers [10].
Figure 11: Effect of clinker size on needed retention time [10].
Clinker build ups at the static inlet of the cooler are mainly formed at clinker temperatures
over 1250 °C in the kiln outlet [11].
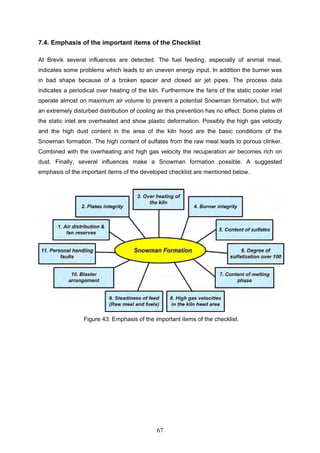
The following checklist was made before visiting the cement plant Brevik in Norway. It was
the first step to approach the Snowman phenomenon.](https://image.slidesharecdn.com/rueddenklau-snowman-prevention-180622055019/85/snowman-30-320.jpg)
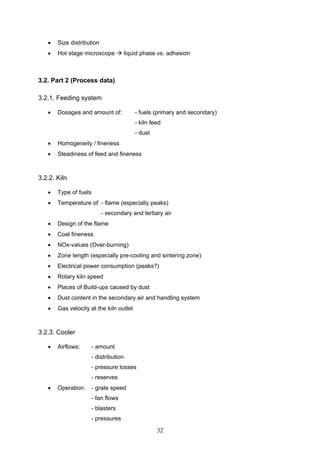
![35
Bauxite, Iron ore, Oxiton, Quartz and limestone of two different qualities are the raw
materials for the production in Brevik. They are fed over a cross belt analyzer to the raw meal
production. The material is milled first with an aero fall mill followed by a roll mill and a
hammer mill. After this the coarse and fine material is separated in the separator. The
finished raw meal is stored in an 25,000 tons raw meal silo. This silo stores the material up to
100 hours. After that the raw meal is fed into the kiln at the second cyclone stage. It goes
through the cyclones of the preheater tower into the kiln and leaves the burning process at
the cooler end. The clinker is also stored in a silo. Typical mass flows can be found in Table
30 in the appendix.
The two red arrows, which can be seen in Figure 12 show the two regular checkpoints of raw
material and raw meal (see also paragraph “4.6 Chemical Compositions”).
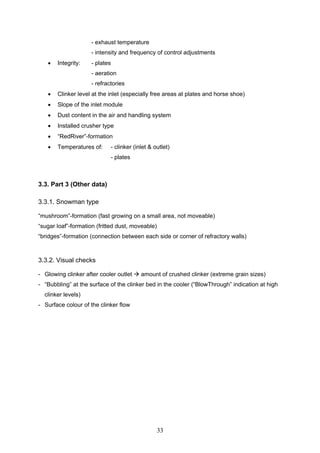
4.3. Kiln system modification
A summary of the various tasks of the kiln system modification in Brevik during 2003 and
2004 and the purpose of each task can be found in Table 11.
Table 11: Overview of the kiln system modification items [12].
Part Item Purpose
Installation of a “hot-spot”
combustion chamber (down-draft
type) with high-temperature zone,
high-O2 zone, increased residence
time and increased turbulence level
Improve burnout of lumpy fuels in
the calciner system
Installation of mixing chamber Mixing kiln gas and gas from the
new combustion chamber
Installation of a KHD Pyrotop swirl
chamber at the top of the loop duct
of the calciner
Improve burnout of lumpy fuels
fed to the calciner system
Installation of an orifice in the riser
duct
Balance kiln gas and tertiary air,
as well as ensure sufficient gas
velocity in the riser duct to avoid
drop-through of fuel fragments
Re-routing and extension of the
tertiary air duct
Adapt the tertiary air duct to the
new combustion chamber
Modification of lower cyclone stage
on string 1
Make space for the new
combustion chamber
Re-routing of meal pipes Make space for the new
combustion chamber
Calciner/preheater
system
Modification of the kiln inlet chamber Ensure sufficient inclination of the
re-routed meal pipes
Installation of new 70 m³ cylindrical
silo, equipped with a rotary
discharge feeder
Provide intermediate storage and
waste buffer, with a trouble-free
discharge, in front of weigh feeder
Waste feeding
system
Installation of weight feeder with a
waste feeding capacity of 25 tph
Provide accurate and sufficient
feeding of waste fuels to the new](https://image.slidesharecdn.com/rueddenklau-snowman-prevention-180622055019/85/snowman-35-320.jpg)
![37
Figure 13: The modified kiln system [12].
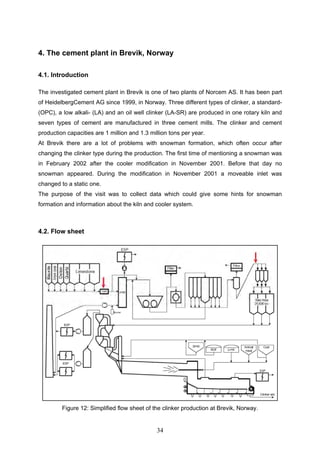
These bypass installation features are an environmentally friendly concept for re-cycling the
bypass gas in the system and avoid new emissions. The hot gas is bled stream at the rotary
kiln inlet, cleaned by an ESP and taken back into the second and third chamber of grate
number one from the cooler.
Figure 14: The new bypass system [12].](https://image.slidesharecdn.com/rueddenklau-snowman-prevention-180622055019/85/snowman-37-320.jpg)
![38
The cleaning of the bypass gas is sometimes not good enough, which leads to a high dust
concentration in chamber two and three. This causes some problems like clogging of the
cooler grate plates, which reduces the cooler efficiency. Additionally, it is reported that
sometimes Snowman formation in front of the cooler can be seen. It is suggested that this
Snowman formation is caused by insufficient cooling. To prevent this effect, the bypass filter
system has to be improved. At the moment the hot bypass gas is rerouted to the exhaust air
stream of the cooler.
Some characteristics of the modified kiln system are given in the following Table 12.
Table 12: Kiln system characteristics [12].
Parameter Value Unit
Rotary kiln length 68 m
Rotary kiln (outer) diameter 4.4 m
Clinker production capacity 3,300 tpd
Typical specific fuel consumption 3,400 kJ/kgCli
Representative temperature interval in rotary kiln 1,100 – 2,000 °C
Representative temperature interval in the precaliner 840 – 1,300 °C
Typical gas residence time in the rotary kiln 5 s
Typical gas residence time in the precalciner 5 s
Typical O2 concentration in rotary kiln exhaust gas 3.5 %
Typical O2 concentration in precalciner exhaust gas 4 %
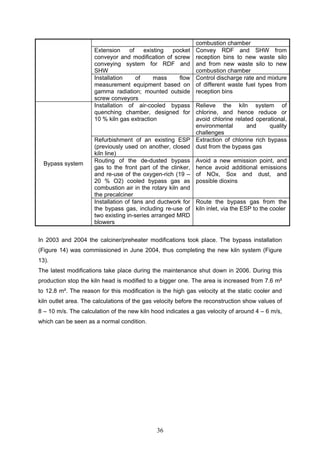
4.4. Actual Cooler at Brevik
The following cooler type is used in Brevik (Figure 15). It is a rebuilt Claudius Peters (CP)
cooler with a static inlet. The tertiary air is extracted from the cooler roof directly after the kiln
hood. A hammer crusher is located at the end. Additional this cooler has a so called
“Fishbone aeration” with stoppers, which intensify the cooling of fine clinker at side to prevent
the Red River formation [10].](https://image.slidesharecdn.com/rueddenklau-snowman-prevention-180622055019/85/snowman-38-320.jpg)
![42
4.7. Clinker mineralogy
Table 17 shows the calculated values by Bogue. Furthermore it gives the content of the
melting phase, calculated by Lea and the average analyzed content of free lime.
Table 17: Clinker mineralogy calculated by Bogue and Lea (06.03.06 - 11.03.06).
C3S C2S C3A C4AF CaOfree (analyzed) Melting phase
67.16 10.93 5.81 10.52 1.30 20.49
Demonstrative is the value of melting phase. It stays by 20.49 %. This value can be seen as
having a very low content, which can be depicted as a preventive measure, suggested in a
dissertation by Dr. D. Optiz [11]. Besides this, the free lime lays at 1.3 and can be considered
as a middle value.
4.8. Moduli
In Table 18 the calculated moduli from the LA-clinker values (Table 15) can be found. The
most demonstrative value is the degree of sulfatization which lies over 100.
Table 18: Calculated Moduli (06.03.06 - 11.03.06).
LSF SR AR SD
96.27 2.74 1.26 141.15
4.9. Clinker analyses
No analyses of clinker are made at the cement plant in Brevik. Even the Liter-weight, which
is a very fast and easy way to check the density of a clinker, is not used.
To analyze the grain size distribution from the cooler inlet a lot of time is required and this
means an intervention into the process. Because of safety reasons the segregation analyses
of the falling clinker into the cooler inlet is impossible today. Maybe a system with a CCD-
Camera which is used for particle analyses can help to make this analysis possible in the
future.
4.10. Burning system (Process Data)
There are a lot of influences which can affect the measurement of the process data, and
which cause difficulties in analyzing such data. This has to be remembered by taking a look
into the process data. It must also been taken in consideration, that other problems also](https://image.slidesharecdn.com/rueddenklau-snowman-prevention-180622055019/85/snowman-42-320.jpg)
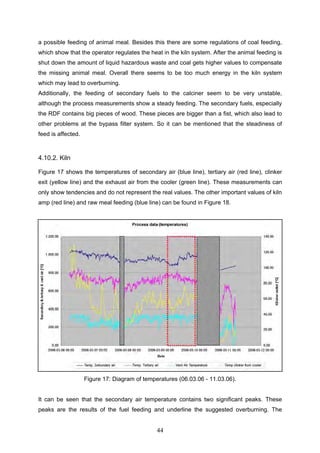
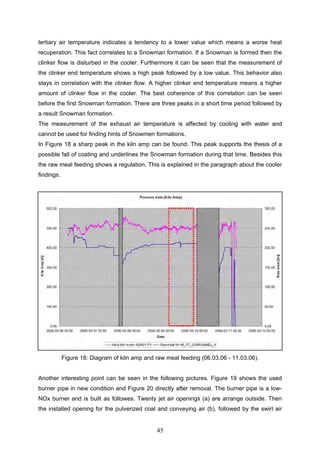
![47
and takes corrective action by regulating the raw meal dosage, which correspond to the peak
in Figure 18. The almost periodically grate 1 speed is accelerated significantly for short
periods. This behaviour cannot be explained.
Figure 21: Diagram of fuels feeding into kiln (06.03.06 - 11.03.06).
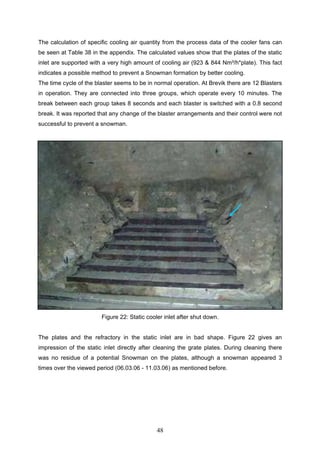
Table 19 shows the used cooling air volume. By checking the reserves of the operating fans,
it is conspicuous that the fan HE-2 is operating at almost maximum air flow. Furthermore this
fan is working with a steady amount of cooling air flow. There is no regulation module. The
task of this fan is to supply the twelve center plates of the static inlet with cooling air. This fan
in particular is operating in the potential area where a Snowman could be formed.
Table 19: The used cooling air volume calculated from process data (06.03.06 - 11.03.06).
Fan No. HE-1 HE-2 3 4 5 6 7 8 9 10
Process
data ( )
[Bm³/h]
22000 10500 22000 29279 52398 4900 4900 30808 34698 75648
Process
data ( )
[Nm³/h]
21223 10129 21223 28245 50548 4727 4727 29721 33474 72977
Installed air
quantity
[Nm³/h]
23300 10500 22900 38900 69100 12500 12500 36100 39300 92000
Working
load [%]
91.09 96.47 92.68 72.61 73.15 37.82 37.82 82.33 85.18 79.32
Reserves
[%]
8.91 3.53 7.32 27.39 26.85 62.18 62.18 17.67 14.82 20.68](https://image.slidesharecdn.com/rueddenklau-snowman-prevention-180622055019/85/snowman-47-320.jpg)
![56
An obvious fact of the calculated moduli, which are mentioned in Table 25, is that the clinker
from both kiln lines indicates a degree of sulfatization lower than 100. The main reason is the
low content of sulfates in the raw meal and fuels.
5.6. Process data
At Burglengenfeld the employed control system allows only to save data for one week. It is
impossible to see the process data digitally during the time period where a Snowman
formation is indicated. But the current process data is used to calculate the specific cooling
air quantities.
5.7. CARDOX-procedure
Besides the calculated specific cooling air quantities the procedure to destroy build ups at
refractory walls, is very interesting. This method, called CARDOX, is often used at rotary kiln
and at cyclones of the preheater tower (Figure 30 & Figure 31). This system is installed at
the inlet area of the CP cooler at Burglengenfeld.
Figure 30: CARDOX system at rotary kiln
[13].
Figure 31: CARDOX system at cyclones of the
preheater tower [13].
The mode of action is simple. A pressure pipe with different screwable tops is filled up with
CO2-gas. A priming charge and a pressure gas generator are also placed in the pipe. By
igniting the pressure gas generator produced additional 50 litres CO2 gas. This expansion
takes places at 20 milliseconds and has a around 15 tonnes of shear force. This shear force
moves to the top and breaks the build ups.](https://image.slidesharecdn.com/rueddenklau-snowman-prevention-180622055019/85/snowman-56-320.jpg)
![59
MnO 0.0987 0.0972 0.0992 0.1020 0.0989 0.0992 0.0848
SrO 0.0693 0.0693 0.0700 0.0708 0.0703 0.0699 0.0730
Cl 0.00 0.00 0.00 0.00 0.00 0.00 0.13
CaOfree 0.17 0.10 0.14 0.18 0.14 0.15 5.26
It is an obvious fact that the Snowman has a lower content of sulfates and alkalis than the
collected clinker samples. This coherence can also be found by comparing with the LA-
clinker chemistry from the laboratory data of the cement plant in Brevik. Furthermore this
Snowman indicates a very low free lime value and holds no chlorides.
The free lime value of the collected clinker shows an extreme value of 5.26 %. So this clinker
is burnt weakly. This fact is also underlined by the XRD analyses, see chapter 6.2.3 XRD –
Rietveld and appendix.
The XRF calculated moduli and melting phase value are shown in Table 27. Those are
calculated from values of Table 26. For detailed values of each row see Table 42 in the
appendix.
Table 27: Calculated values (LSF, SR, AR, DS, S).
LSF SR AR DS Melting phase
Snowman 96.01 2.85 1.30 285.01 20.28
Clinker 98.24 2.64 1.35 233.86 22.40
The most interesting fact is the very low content of melting phase of the Snowman. This
value lays at 20.28 % and is a surprise because it is in contradiction to the proposed
hypothesis, which assumed a high content of melt.
6.2.3. XRD – Rietveld
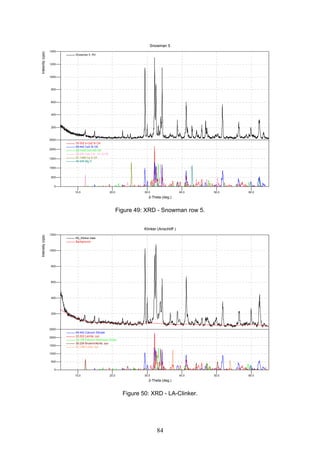
For the XRD analyses a Siemens D 5000 is used. This system operates with an CuK -
radiation. Table 28 shows the average data of the XRD-analyses. These values will be
compared to the calculated values of phases, which can be found in Table 17 in chapter “4.7
Clinker mineralogy”. For detailed values of each row see Table 43 in the appendix.
Table 28: XRD - Snowman sample corresponding to the LA-clinker.
C2S C3S C3A C4AF Anhydrite Periclase
Snowman [%-by mass] 15.0 67.5 2.6 14.1 0.2 0.7
The Snowman has high contents of the C2S and C4AF phases. Beside this the content of the
aluminates phase has quite low value.
The XRD analyses of the clinker sample can be found at Table 44 in the appendix. It shows
very low contents of C3S and C3A phases. Furthermore the C2S phase is increased. This fact](https://image.slidesharecdn.com/rueddenklau-snowman-prevention-180622055019/85/snowman-59-320.jpg)
![60
also indicates a weak burning. This piece of a clinker was collected directly after the shut
down of the kiln. The rotary kiln was emptied for maintenance. An explanation for this weak
burnt clinker is that some residual material in the kiln is burnt with insufficient sintering
temperature. This configuration leads to a weak burnt clinker.
6.2.4. Water soluble salts
The water soluble salts, tested by the DEV-S4-procedure (a leaching test), of the Snowman,
lay at 1.39 %. The composition of these can be seen in Table 29. These values indicate that
the salts exist mainly of sodium and potassium sulfates. The rest are carbonates, which
explain the content of calcium. The compositions are analysed with an Atom Absorbing
Spectrometer (AAS).
Table 29: Water soluble salts.
Weight
[mg]
[%]
SO4 21 29.62
Na 10 14.10
K 16 22.57
Ca 6 8.46
Rest 17.9 25.25
Total 70.9 100.00
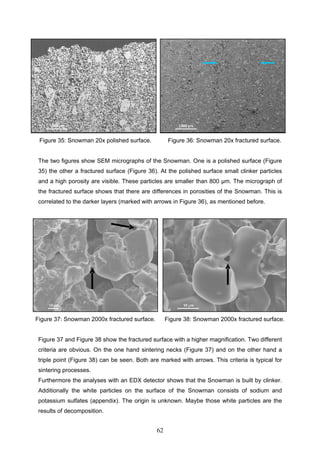
6.2.5. Reflected light microscopy
The reflected light microscopy from Axio Phot Zeiss, Germany is used to make the following
micrographs.
Figure 33: Clinker 2.5x polished surface. Figure 34: Snowman 2.5x polished surface.](https://image.slidesharecdn.com/rueddenklau-snowman-prevention-180622055019/85/snowman-60-320.jpg)
![61
Figure 33 and Figure 34 show the polished samples of one Snowman and one clinker. The
first visible feature is the porosity. The Snowman has a porosity of 46.28 % in contradiction to
the clinker with a porosity of 8.35 %. The calculations of the porosity are made with a particle
analysing program. The different layers of the Snowman (Figure 29), have different
porosities. The black layer has a higher porosity than the area between two of them. This can
be also seen at the SEM analyses (Figure 36).
Unfortunately the etching with hydrofluoric acid, which will make the different phases visual,
was not successful. Only parts of the samples are etch. But the SEM with the EDX-analyses
show the different clinker phases, which can be found in the appendix. It should be remarked
that the Snowman contains ordinary clinker phases, as analysed with XRD.
6.2.6. Hot stage microscopy
The hot stage microscope, which is used for the analyses, is a self-construction after DIN
51730 [14]. These analyses do not present the correlation, which can be found in literature
[15]. Because of the low content of liquid phase the temperature, which indicates the
softening point, is located at 1560 °C calculated from the following formula [15].
xTEB 1.171907
TEB: Temperature of the softening point
X: Melting phase content in %
The temperature limit of the used hot stage microscope is 1450 °C. Because of this only a
slumping down of the samples can be seen.
6.2.7. SEM
The scanning electron microscope (SEM) CamScan CS4 is used for the following
micrographs. Additionally for the chemical compositions an EDX-detector from Tracor
Northern 5502 is used, which can be found at the appendix.](https://image.slidesharecdn.com/rueddenklau-snowman-prevention-180622055019/85/snowman-61-320.jpg)
![65
7.3. Comparable natural phenomenon
In nature glowing dust clouds are called Ignimbrite. Geologists also call them pyroclastic flow
deposits. They are formed during volcanic eruptions. Generally, three different ways of
formations can be found in nature (Figure 40).
Figure 40: Some ways the pyroclastic flows can
originate [16].
The first one is a vertical eruption and column collapse, the second one a low pressure
boiling over and the third one a directed blast or dome collapse. All of them produce a lava
stream combined with glowing dust clouds. The glowing dust clouds consist of particles with
a size of < 2 mm. Those streams have high velocities from 14 up to 230 km/h under
temperatures around 500 - 650 °C and up to 850 °C. The dust content of those clouds varies
around 1 g/cm³. Figure 41 shows such an ignimbrite in detail.](https://image.slidesharecdn.com/rueddenklau-snowman-prevention-180622055019/85/snowman-65-320.jpg)
![66
Figure 41: Diagram showing development of block and ash flow [16].
It can be seen that the structure of a Ignimbrite is caused by dense segregation. The
particles with a higher density and a bigger size can be found after cooling down at the
bottom layers. In contrast to the particles with a lower density, they deposit more at the top of
the rock. This segregation leads to the typical structure of an Ignimbrite. Furthermore under
high temperatures a plastic deformation affects the structure. Some dust particles are welded
together which can be seen in Figure 42. Lines separate the different layers in this Ignimbrite
from Gran Canaria.
Figure 42: Strongly welded pantelleritic ignimbrite
from Gran Canaria [16].
The affinity to the investigated Snowman is obvious (see Figure 42).](https://image.slidesharecdn.com/rueddenklau-snowman-prevention-180622055019/85/snowman-66-320.jpg)
![69
The first point should be to analyze the kiln feed. It has been known for the elimination of
fluctuations in raw meal chemistry. Furthermore the cooler fans which supports the static
inlet with cooling air has to be checked to get reserves of air volume. This point can be
combined with an improvement of the air distribution. The goal should be to operate with a
lower cooling air quantity beside a better distribution. It should be clear that the gaps in the
plates should be repaired. An improvement of the refractory arrangement should also be
done. It was reported that in history very often a Snowman was formed on top of the
horseshoe. The people from Claudius Peters suggest the following refractory arrangement
(Figure 44).
Figure 44: Modification lining HE-Modul [17].
The aim must be to avoid platforms at the static inlet.
Another point should be to improve the secondary fuels situation by avoiding the use of big
pieces of wood. A better fineness will also help.
Saving pieces of Snowman should also always be a task. Snowmen formation is not well
described in the literature. Especially the liquid phase correlation seems to contradict the
shown results of this thesis.
Furthermore the pre-cooling zone can be increased to get a lower temperature of the falling
clinker.
The next point is to install a clinker-level measurement for the static inlet. This measurement
can be integrated in the process control system and will be another indicator to improve the
discontinuous operating connection between kiln and cooler.](https://image.slidesharecdn.com/rueddenklau-snowman-prevention-180622055019/85/snowman-69-320.jpg)

![71
9. List of literature
[1] Locher, F.W.: Cement - Principles of Production and Use. Verlag Bau+Technik
GmbH, Düsseldorf, 2006.
[2] Alsop, P.A.: Cement Plant Operations Handbook. International Cement
Review, 1998, Second Edition.
[3] Wolter, A.: Vorlesungsunterlagen. 2005.
[4] Ghosh, S.N.: Advances in Cement Technology - Critical Reviews and Case
Studies on Manufacturing, Quality Control, Optimisation and Use. Pergamon
Press, 1983.
[5] Duda, W.H.: Cement Data Book - International Process Engineering in the
Cement Industry. Bauverlag GmbH, 1985, 3rd. edition.
[6] Buzzi, S. and G. Sassone: Optimierung des Klinkerkühlerbetriebs. ZKG, 1993,
Jahrg. 46, (Nr. 12), S. 755-760.
[7] Wallis, H.: Produktübersicht Klinkerkühler. ZKG International, 2004, Vol. 57,
(No. 7), p. 40-49.
[8] ClaudiusPeters: Klinkerkühler Betriebsanleitung. 2002.
[9] IKN: Betriebsanleitung für den IKN-Pendelrostkühler. 2003.
[10] Bentsen, B. and B.P. Keefe: Der SF Cross-Bar Cooler - ein neuer
Klinkerkühler mit innovativer Luftverteilung. ZKG International, 1999, Vol. 52,
(No. 11), S.608-619.
[11] Opitz, D.: Die Ansatzringe in Zementdrehöfen. Schriftenreihe der
Zementindustrie, Beton-Verlag GmbH, Düsseldorf, 1974, Heft 41.
[12] Tokheim, L.-A.: An Alternative Solution. World Cement, 2005, Vol. 11, p. 57-
63.
[13] ATD-Abbausysteme: ATD-System: Druckgasverfahren Cardox. Düsseldorf.
[14] Görke, R. and K.J. Leers: Automatisierung eines Erhitzungsmikroskops mit
Hilfe digitaler Bildverabeitung. Keramische Zeitschrift, 1996, 48, (No.4), S.300-
305.
[15] Reich, R.: Zur Bestimmung der Ersthaftung von Klinker auf feuerfestem
Material. Silikattechnik, 1985, Vol. 36, (Heft 9), p. 291-292.
[16] Fisher, R.V. and H.-U. Schmincke: Pyroclastic Rocks. Springer Verlag, Berlin,
1984.
[17] ClaudiusPeters: Information sheet of Claudius Peters. 2006.](https://image.slidesharecdn.com/rueddenklau-snowman-prevention-180622055019/85/snowman-71-320.jpg)
![72
10. Table of figures
Figure 1: Clinker phases formation [3]. ................................................................................... 10
Figure 2: Diagram of cyclone preheater [1]............................................................................. 13
Figure 3: Diagram of cyclone preheater with precalcination [1]. ............................................ 13
Figure 4: Different combustion air supply systems for precalcination [1]. ............................. 14
Figure 5: Recirculating system [3]........................................................................................... 15
Figure 6: Effect of cooling rate on cement properties and phases [4]...................................... 17
Figure 7: Conventional cooler types [6]................................................................................... 18
Figure 8: Formation of Red River [9]. ..................................................................................... 28
Figure 9: Pressure losses of various clinker sizes as a function of free air velocity [10]. ....... 29
Figure 10: Formation of Snowman [9]..................................................................................... 30
Figure 11: Effect of clinker size on needed retention time [10]............................................... 30
Figure 12: Simplified flow sheet of the clinker production at Brevik, Norway....................... 34
Figure 13: The modified kiln system [12]................................................................................ 37
Figure 14: The new bypass system [12]................................................................................... 37
Figure 15: The used clinker cooler system at Brevik, Norway................................................ 39
Figure 16: Diagram of fuels feeding (06.03.06 - 11.03.06). .................................................... 43
Figure 17: Diagram of temperatures (06.03.06 - 11.03.06). .................................................... 44
Figure 18: Diagram of kiln amp and raw meal feeding (06.03.06 - 11.03.06). ....................... 45
Figure 19: Burner in new condition. ........................................................................................ 46
Figure 20: Burner in used condition......................................................................................... 46
Figure 21: Diagram of fuels feeding into kiln (06.03.06 - 11.03.06)....................................... 47
Figure 22: Static cooler inlet after shut down. ......................................................................... 48
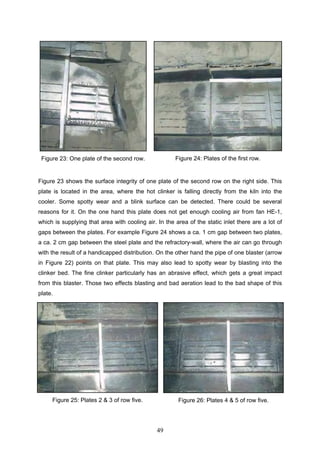
Figure 23: One plate of the second row. .................................................................................. 49
Figure 24: Plates of the first row.............................................................................................. 49
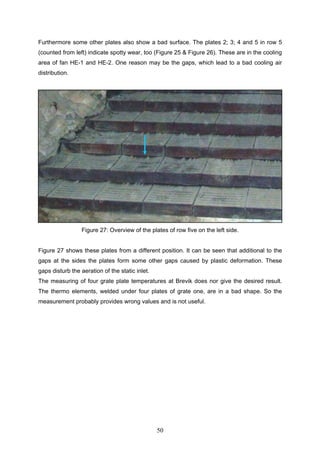
Figure 25: Plates 2 & 3 of row five.......................................................................................... 49
Figure 26: Plates 4 & 5 of row five.......................................................................................... 49
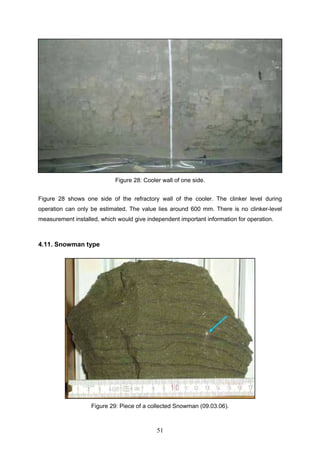
Figure 27: Overview of the plates of row five on the left side................................................. 50
Figure 28: Cooler wall of one side........................................................................................... 51
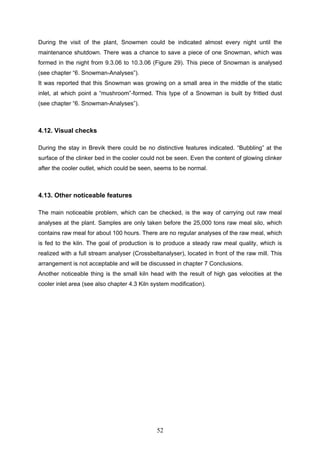
Figure 29: Piece of a collected Snowman (09.03.06). ............................................................. 51
Figure 30: CARDOX system at rotary kiln [13]...................................................................... 56
Figure 31: CARDOX system at cyclones of the preheater tower [13]..................................... 56
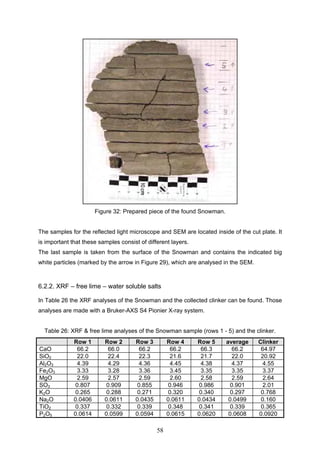
Figure 32: Prepared piece of the found Snowman. .................................................................. 58
Figure 33: Clinker 2.5x polished surface. ................................................................................ 60
Figure 34: Snowman 2.5x polished surface. ............................................................................ 60
Figure 35: Snowman 20x polished surface. ............................................................................. 62
Figure 36: Snowman 20x fractured surface. ............................................................................ 62
Figure 37: Snowman 2000x fractured surface. ........................................................................ 62
Figure 38: Snowman 2000x fractured surface. ........................................................................ 62
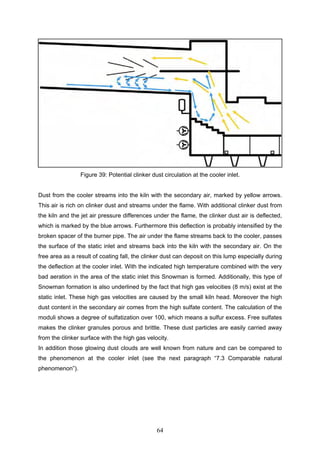
Figure 39: Potential clinker dust circulation at the cooler inlet. .............................................. 64
Figure 40: Some ways the pyroclastic flows can originate [16]. ............................................. 65
Figure 41: Diagram showing development of block and ash flow [16]................................... 66
Figure 42: Strongly welded pantelleritic ignimbrite from Gran Canaria [16]. ........................ 66
Figure 43: Emphasis of the important items of the checklist................................................... 67
Figure 44: Modification lining HE-Modul [17]. ...................................................................... 69
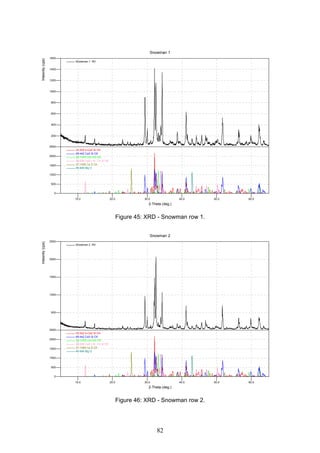
Figure 45: XRD - Snowman row 1. ......................................................................................... 82
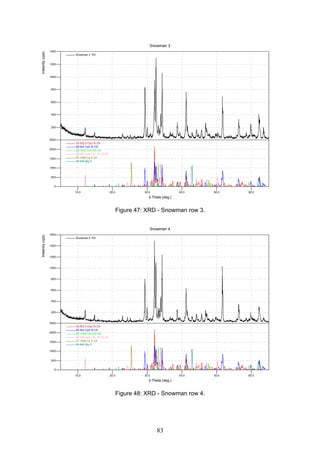
Figure 46: XRD - Snowman row 2. ......................................................................................... 82
Figure 47: XRD - Snowman row 3. ......................................................................................... 83](https://image.slidesharecdn.com/rueddenklau-snowman-prevention-180622055019/85/snowman-72-320.jpg)
![74
11. List of tables
Table 1: Potential phase composition of German cement clinker [1]........................................ 9
Table 2: Moduli of German cement clinker [1]. ...................................................................... 11
Table 3: Essential technical data of rotary coolers [6]............................................................. 19
Table 4: Essential technical data of planetary coolers [6]........................................................ 19
Table 5: Essential technical data of grate coolers [6]............................................................... 19
Table 6: Clinker capacity - clinker exit temperature - cooling air quantity [8]. ...................... 23
Table 7:Specific cooling air quantity - secondary air temperature - cooler efficiency [8]. ..... 24
Table 8: Clinker bed level - thrust rate/time of stay - clinker exit temperature - wear [8]. ..... 25
Table 9:Clinker bed level - clinker exit temperature - cooler efficiency - power
requirement[8]............................................................................................................ 26
Table 10: Cooling air quantity - thrust rate - exhaust air quantity - exhaust air temperature [8].
.................................................................................................................................... 27
Table 11: Overview of the kiln system modification items [12].............................................. 35
Table 12: Kiln system characteristics [12]............................................................................... 38
Table 13: Kiln stops caused by Snowman formation (1999 - 2006)........................................ 39
Table 14: Raw meal chemistry of LA-clinker (06.03.06 - 11.03.06) *FSA. ........................... 41
Table 15: LA-Clinker chemistry (06.03.06 - 11.03.06). .......................................................... 41
Table 16: Bypass dust chemistry (06.03.06 - 11.03.06)........................................................... 41
Table 17: Clinker mineralogy calculated by Bogue and Lea (06.03.06 - 11.03.06)................ 42
Table 18: Calculated Moduli (06.03.06 - 11.03.06)................................................................. 42
Table 19: The used cooling air volume calculated from process data (06.03.06 - 11.03.06). . 47
Table 20: Raw meal chemistry from kiln WT2 (2005)............................................................ 54
Table 21: Raw meal chemistry from kiln WT3 (2005)............................................................ 54
Table 22: Clinker chemistry of both lines (WT2 & WT3) from 2005..................................... 55
Table 23: Bypass chemistry of both lines (2005)..................................................................... 55
Table 24: Clinker mineralogy from laboratory data and calculated melting phase (2005)...... 55
Table 25: Calculated Moduli of clinker (2005)........................................................................ 55
Table 26: XRF & free lime analyses of the Snowman sample (rows 1 - 5) and the clinker.... 58
Table 27: Calculated values (LSF, SR, AR, DS, S)................................................................. 59
Table 28: XRD - Snowman sample corresponding to the LA-clinker..................................... 59
Table 29: Water soluble salts. .................................................................................................. 60
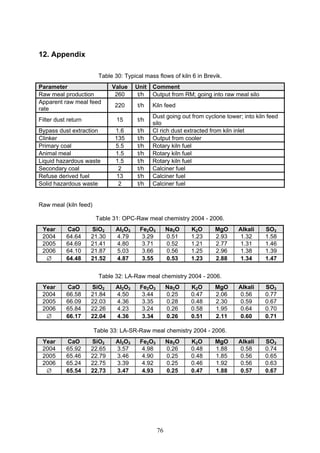
Table 30: Typical mass flows of kiln 6 in Brevik.................................................................... 76
Table 31: OPC-Raw meal chemistry 2004 - 2006. .................................................................. 76
Table 32: LA-Raw meal chemistry 2004 - 2006...................................................................... 76
Table 33: LA-SR-Raw meal chemistry 2004 - 2006................................................................ 76
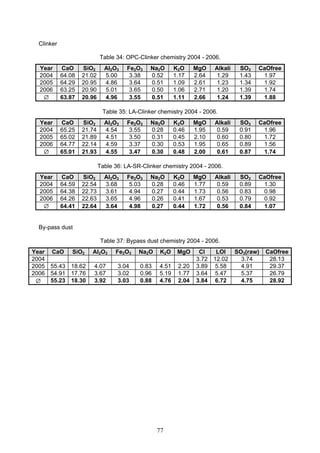
Table 34: OPC-Clinker chemistry 2004 - 2006. ...................................................................... 77
Table 35: LA-Clinker chemistry 2004 - 2006.......................................................................... 77
Table 36: LA-SR-Clinker chemistry 2004 - 2006.................................................................... 77
Table 37: Bypass dust chemistry 2004 - 2006. ........................................................................ 77
Table 38: Calculations of specific cooling air quantity, Brevik (Kiln 6)................................. 78
Table 39: Calculations of specific cooling air quantity, Burglegenfeld (Kiln 2 - CP)............. 79
Table 40: Calculations of specific cooling air quantity, Burglengenfeld (Kiln 3 - IKN)......... 80
Table 41: XRF & free lime analyses of the Snowman sample (rows 1 - 5) and the clinker.... 81
Table 42: Calculated values (LSF, SR, AR, DS, S)................................................................. 81
Table 43: XRD - Snowman (SM) sample (rows 1 - 5). ........................................................... 81
Table 44: XRD - LA-Clinker sample....................................................................................... 81
Table 45: EDX-analyses of SM(a)-fractured 1000x. ............................................................... 85](https://image.slidesharecdn.com/rueddenklau-snowman-prevention-180622055019/85/snowman-74-320.jpg)
![78
Table 38: Calculations of specific cooling air quantity, Brevik (Kiln 6).
Coolingairquantity
percoolingsurface
[Nm³/m²]
9,259
8,470
7,098
4,571
3,572
1,976
1,976
3,728
3,359
4,307
44,009
Coolingsurface
[m²]
2.29
1.20
2.99
6.18
14.15
2.39
2.39
7.97
9.97
16.94
49.53
Coolingairquantity
percoolingplate
[Nm³/plate]
923
844
707
456
356
197
197
372
335
429
4,386
Rows
6
4
8
17
8
10
17
53
Aerated
plates
23
12
30
62
142
24
24
80
100
170
667
Specificcooling
airquantity
[Nm³/kgcli]
0.16
0.08
0.16
0.21
0.37
0.04
0.04
0.22
0.25
0.54
2.05
Ambienttemp.[°C]:10
Coolingair
quantity
[Nm³/h]
21,223
10,129
21,223
28,245
50,548
4,727
4,727
29,721
33,474
72,977
276,994
Coolingair
quantity
[Bm³/h]
22,000
10,500
22,000
29,280
52,400
4,900
4,900
30,810
34,700
75,650
287,140
Table38:Calculationsofspecificcoolingairquantity,Brevik(kiln6).
Clinker[t/d]:3240
Fan
HE-Modul(1)
HE-Modul(2)
Chamber2
Chamber3
Chamber4
FishboneFan6
FishboneFan7
Chamber1
Chamber2
Chamber3
Total](https://image.slidesharecdn.com/rueddenklau-snowman-prevention-180622055019/85/snowman-78-320.jpg)
![79
Table 39: Calculations of specific cooling air quantity, Burglegenfeld (Kiln 2 - CP).
Coolingairquantity
percoolingsurface
[Nm³/m²]
9,760
7,568
8,045
3,709
2,524
1,846
1,721
35,174
Coolingsurface
[m²]
2.39
1.59
3.19
10.36
11.16
12.76
13.55
55.01
Coolingairquantity
percoolingplate
[Nm³/plate]
973
754
802
370
252
184
172
3,505
Rows
4
2
4
13
14
16
17
70
Aerated
plates
24
16
32
104
112
128
136
552
Specificcooling
airquantity
[Nm³/kgcli]
0.31
0.16
0.35
0.52
0.38
0.32
0.31
2.35
Ambienttemp.[°C]:20
Coolingair
quantity
[Nm³/h]
23,345
12,068
25,656
38,444
28,178
23,542
23,331
174,563
Coolingair
quantity
[Bm³/h]
25,055
12,952
27,536
41,260
30,242
25,267
25,040
187,352
Table39:Calculationsofspecificcoolingairquantity,Burglengenfeld(Kiln2-CP).
Clinker[t/d]:1780
Fan
HE-Modul(1)
HE-Modul(2)
Chamber1
Chamber2
Chamber3
Chamber4
Chamber5
Total](https://image.slidesharecdn.com/rueddenklau-snowman-prevention-180622055019/85/snowman-79-320.jpg)
![80
Table 40: Calculations of specific cooling air quantity, Burglengenfeld (Kiln 3 - IKN).
Coolingairquantity
percoolingsurface
[Nm³/m²]
5,266
4,420
4,291
3,508
3,274
2,936
23,695
Coolingsurface
[m²]
1.79
3.38
8.30
11.00
11.00
12.90
48.37
Coolingairquantity
percoolingplate
[Nm³/plate]
291
244
283
230
214
193
1,455
Rows
3
4
9
12
12
14
54
Aerated
plates
32
61
126
168
168
196
752
Specificcooling
airquantity
[Nm³/kgcli]
0.13
0.20
0.48
0.52
0.49
0.51
2.33
Ambienttemp.[°C]:20
Coolingair
quantity
[Nm³/h]
9,426
14,940
35,613
38,587
36,015
37,881
172,461
Coolingair
quantity
[Bm³/h]
10,117
16,034
38,222
41,414
38,653
40,656
185,096
Table40:Calculationsofspecificcoolingairquantity,Burglengenfeld(Kiln3-IKN).
Clinker[t/d]:1780
Fan
Stat.Grate
(1)
Stat.Grate
(2)
Chamber1
Chamber2
Chamber3
Chamber4
Total](https://image.slidesharecdn.com/rueddenklau-snowman-prevention-180622055019/85/snowman-80-320.jpg)
![81
SEM-Analyses
Table 41: XRF & free lime analyses of the Snowman sample (rows 1 - 5) and the clinker.
Row 1
[m.-%]
Row 2
[m.-%]
Row 3
[m.-%]
Row 4
[m.-%]
Row 5
[m.-%]
Average
[m.-%]
Clinker
[m.-%]
CaO 66.2 66.0 66.2 66.2 66.3 66.2 64.97
SiO2 22.0 22.4 22.3 21.6 21.7 22.0 20.92
Al2O3 4.39 4.29 4.36 4.45 4.38 4.37 4.55
Fe2O3 3.33 3.28 3.36 3.45 3.35 3.35 3.37
MgO 2.59 2.57 2.59 2.60 2.58 2.59 2.64
SO3 0.807 0.909 0.855 0.946 0.986 0.901 2.01
K2O 0.265 0.288 0.271 0.320 0.340 0.297 0.768
Na2O 0.0406 0.0611 0.0435 0.0611 0.0434 0.0499 0.160
TiO2 0.337 0.332 0.339 0.348 0.341 0.339 0.365
P2O5 0.0614 0.0599 0.0594 0.0615 0.0620 0.0608 0.0920
MnO 0.0987 0.0972 0.0992 0.1020 0.0989 0.0992 0.0848
SrO 0.0693 0.0693 0.0700 0.0708 0.0703 0.0699 0.0730
Cl 0.00 0.00 0.00 0.00 0.00 0.00 0.13
CaOfree 0.17 0.10 0.14 0.18 0.14 0.15 5.26
Table 42: Calculated values (LSF, SR, AR, DS, S).
Row 1 Row 2 Row 3 Row 4 Row 5 average Clinker
LSF 96.02 94.40 94.88 97.39 97.35 96.01 98.24
SR 2.85 2.96 2.89 2.73 2.81 2.85 2.64
AR 1.32 1.31 1.30 1.29 1.31 1.30 1.35
DS 290.60 280.78 298.38 269.56 285.74 285.01 233.86
S [m.-%] 20.28 19.87 20.25 20.72 20.29 20.28 22.40
XRD – Rietveld
Table 43: XRD - Snowman (SM) sample (rows 1 - 5).
Phase
SM 1
[wt.-%]
SM 2
[wt.-%]
SM 3
[wt.-%]
SM 4
[wt.-%]
SM 5
[wt.-%]
Average
[wt.-%]
C2S 16.7 12.9 17.7 14.1 13.4 15.0
C3S 67.3 68.1 66.1 66.8 69.1 67.5
C3A 2.3 2.6 2.6 2.7 2.7 2.6
C4AF 12.6 16.1 12.7 16.0 13.0 14.1
Anhydrite 0.1 0.1 0.1 0.1 0.4 0.2
Periclase 1.0 0.2 0.9 0.2 1.4 0.7
Table 44: XRD - LA-Clinker sample.
Phase [wt.-%]
C2S 31.9
C3S 44.8
C3A 0.9
C4AF 13.6
Periclase 0.7
Lime 5.0
Portlandite 1.0
Rest 2.0](https://image.slidesharecdn.com/rueddenklau-snowman-prevention-180622055019/85/snowman-81-320.jpg)
![85
White particles of the sample snowman
Overview:
Figure 51: SM-fractured 1000x. Figure 52: SM-fractured 100x.
Table 45: EDX-analyses of SM(a)-fractured 1000x.
Element
[wt.-%]
Oxide
[wt.-%]
Na 2.3 Na2O 3.1
Mg 5.2 MgO 8.7
Al 4.2 Al2O3 7.9
Si 7.4 SiO2 15.9
K 0.4 K2O 0.5
Ca 43.0 CaO 10.2
Fe 2.5 FeO 3.3
O 34.5 --
Figure 53: SM(a)-fractured 1000x.
Table 46: EDX-analyses of SM(b)-fractured 1000x.
Element
[wt.-%]
Oxide
[wt.-%]
Na 2.6 Na2O 3.5
Mg 0.3 MgO 0.6
Al 6.3 Al2O3 11.9
Si 6.8 SiO2 14.7
K 0.6 K2O 0.7
Ca 42.8 CaO 59.9
Fe 6.5 FeO 8.4
O 33.7 --
Figure 54: SM(b)-fractured 1000x.](https://image.slidesharecdn.com/rueddenklau-snowman-prevention-180622055019/85/snowman-85-320.jpg)
![86
Table 47: EDX-analyses of SM(c)-fractured 1000x.
Element
[wt.-%]
Oxide
[wt.-%]
Na 0.2 Na2O 0.3
Mg 0.3 MgO 0.5
Al 1.0 Al2O3 1.9
Si 10.0 SiO2 21.4
K 0.2 K2O 0.4
Ca 52.9 CaO 74.1
Fe 0.9 FeO 1.2
O 34.1 --
Figure 55: SM(c)-fractured 1000x.
Table 48: EDX-analyses of SM(d)-fractured 1000x.
Element
[wt.-%]
Oxide
[wt.-%]
Na 0.8 Na2O 1.1
Mg 0.9 MgO 1.5
Al 1.2 Al2O3 2.2
Si 8.7 SiO2 18.7
K 0.4 K2O 0.5
Ca 50.2 CaO 70.3
Fe 2.7 FeO 3.5
S 0.7 SO3 1.8
O 34.0 --
Figure 56: SM(d)-fractured 1000x.](https://image.slidesharecdn.com/rueddenklau-snowman-prevention-180622055019/85/snowman-86-320.jpg)
![87
White particles separate from the snowman sample
Overview:
Figure 57: White particles 200x. Figure 58: White particles 500x.
Figure 59: White particles 3000x.
Table 49: EDX-analyses point 1 (left table) & 2 (right table) of White particles 3000x.
Element
[wt.-%]
Oxide
[wt.-%]
Element
[wt.-%]
Oxide
[wt.-%]
Na 9.8 Na2O 13.2 Na 5.1 Na2O 6.9
Mg 0.0 MgO 0.0 Mg 0.2 MgO 0.3
Al 0.2 Al2O3 0.4 Al 0.3 Al2O3 0.6
Si 1.4 SiO2 2.9 Si 1.9 SiO2 4.2
K 26.3 K2O 31.7 K 26.0 K2O 31.4
Ca 4.7 CaO 6.6 Ca 8.6 CaO 12.0
Fe 0.0 FeO 0.0 Fe 0.0 FeO 0.0
S 18.0 SO3 44.9 S 17.7 SO3 44.4
O 39.4 -- O 39.8 --](https://image.slidesharecdn.com/rueddenklau-snowman-prevention-180622055019/85/snowman-87-320.jpg)
![88
Table 50: EDX-analyses point 3 (left table) & 4 (right table) of White particles 3000x.
Element
[wt.-%]
Oxide
[wt.-%]
Element
[wt.-%]
Oxide
[wt.-%]
Na 7.6 Na2O 10.3 Na 0.6 Na2O 0.9
Mg 0.0 MgO 0.0 Mg 0.0 MgO 0.0
Al 0.1 Al2O3 0.2 Al 0.0 Al2O3 0.0
Si 1.0 SiO2 2.2 Si 15.6 SiO2 33.5
K 27.9 K2O 33.7 K 0.6 K2O 0.8
Ca 2.4 CaO 3.4 Ca 45.1 CaO 63.1
Fe 0.8 FeO 1.1 Fe 0.4 FeO 0.5
S 19.6 SO3 48.9 S 0.4 SO3 1.0
O 40.2 -- O 36.9 --
Table 51: EDX-analyses point 5 (left) & 6 (right) of White particles 3000x.
Element
[wt.-%]
Oxide
[wt.-%]
Element
[wt.-%]
Oxide
[wt.-%]
Na 2.9 Na2O 3.9 Na 3.9 Na2O 5.3
Mg 0.0 MgO 0.0 Mg 0.9 MgO 1.5
Al 0.7 Al2O3 1.4 Al 0.2 Al2O3 0.4
Si 11.4 SiO2 24.4 Si 2.1 SiO2 4.6
K 5.7 K2O 6.8 K 24.8 K2O 29.9
Ca 36.3 CaO 50.8 Ca 9.0 CaO 12.7
Fe 0.0 FeO 0.0 Fe 0.7 FeO 0.9
S 4.9 SO3 12.4 S 17.8 SO3 44.5
O 37.8 -- O 40.2 --
Table 52: EDX-analyses point 7 of White particles 3000x.
Element
[wt.-%]
Oxide
[wt.-%]
Na 0.4 Na2O 0.5
Mg 0.2 MgO 0.4
Al 0.8 Al2O3 1.6
Si 11.5 SiO2 24.7
K 0.6 K2O 0.7
Ca 50.1 CaO 70.1
Fe 0.0 FeO 0.0
S 0.6 SO3 1.7
O 35.4 --](https://image.slidesharecdn.com/rueddenklau-snowman-prevention-180622055019/85/snowman-88-320.jpg)
![89
Fractured surface of the sample snowman
Figure 60: SM-fractured 20x.
Table 53: EDX-analyses of SM-fractured 100x.
Element
[wt.-%]
Oxide
[wt.-%]
Na 0.0 Na2O 0.0
Mg 0.9 MgO 1.6
Al 0.9 Al2O3 1.7
Si 6.5 SiO2 13.9
K 0.5 K2O 0.6
Ca 55.0 CaO 76.9
Fe 3.1 FeO 4.0
S 0.4 SO3 1.0
O 32.4 --
Figure 61: SM-fractured 100x.
Figure 62: SM-fractured 500x Figure 63: SM-fractured 1000x](https://image.slidesharecdn.com/rueddenklau-snowman-prevention-180622055019/85/snowman-89-320.jpg)
![90
Table 54: EDX-analyses point 1 of SM(a)-fractured-neck 2000x.
Element
[wt.-%]
Oxide
[wt.-%]
Na 0.0 Na2O 0.0
Mg 0.9 MgO 1.6
Al 0.9 Al2O3 1.8
Si 8.9 SiO2 19.0
K 0.4 K2O 0.5
Ca 52.7 CaO 73.7
Fe 1.4 FeO 1.8
S 0.5 SO3 1.3
O 34.0 --
Figure 64: SM(a)-fractured-neck 2000x.
Figure 65: SM(b)-fractured-neck 2000x.
Table 55: EDX-analyses of SM(a)-fractured-crystals 2000x.
Element
[wt.-%]
Oxide
[wt.-%]
Na 0.4 Na2O 0.5
Mg 1.1 MgO 1.8
Al 3.0 Al2O3 5.7
Si 6.9 SiO2 14.9
K 0.1 K2O 0.2
Ca 49.4 CaO 69.1
Fe 5.2 FeO 6.8
S 0.3 SO3 0.7
O 33.2 --
Figure 66: SM(a)-fractured-crystals 2000x.](https://image.slidesharecdn.com/rueddenklau-snowman-prevention-180622055019/85/snowman-90-320.jpg)
![91
Table 56: EDX-analyses of SM(b)-fractured-crystals 2000x.
Element
[wt.-%]
Oxide
[wt.-%]
Na 0.0 Na2O 0.0
Mg 3.0 MgO 5.0
Al 1.4 Al2O3 2.7
Si 11.8 SiO2 25.3
K 0.7 K2O 0.8
Ca 42.4 CaO 59.3
Fe 4.0 FeO 5.2
S 0.6 SO3 1.4
O 35.9 --
Figure 67: SM(b)-fractured-crystals 2000x.
Table 57: EDX-analyses of SM(a)-fractured-inter phase 2000x.
Element
[wt.-
%]
Oxide
[wt.-
%]
Na 0.0 Na2O 0.0
Mg 4.1 MgO 6.9
Al 8.1 Al2O3 15.3
Si 2.7 SiO2 5.7
K 0.1 K2O 0.2
Ca 42.4 CaO 59.3
Fe 8.7 FeO 11.2
S 0.4 SO3 1.1
O 33.1 --
Figure 68: SM(a)-fractured-inter phase
2000x.](https://image.slidesharecdn.com/rueddenklau-snowman-prevention-180622055019/85/snowman-91-320.jpg)
![92
Figure 69: SM(b)-fractured-inter phase 2000x.
Table 58: EDX-analyses point 1 (left table) & 2 (right table) of SM-fractured-inter phase
2000x.
Element
[wt.-%]
Oxide
[wt.-%]
Element
[wt.-%]
Oxide
[wt.-%]
Na 0.0 Na2O 0.0 Na 0.9 Na2O 1.2
Mg 3.3 MgO 5.5 Mg 1.2 MgO 2.0
Al 8.9 Al2O3 16.8 Al 0.7 Al2O3 1.4
Si 3.3 SiO2 7.1 Si 10.4 SiO2 22.3
K 0.1 K2O 0.1 K 0.2 K2O 0.2
Ca 42.7 CaO 59.7 Ca 50.9 CaO 71.3
Fe 7.7 FeO 9.9 Fe 0.4 FeO 0.6
S 0.2 SO3 0.6 S 0.3 SO3 0.8
O 33.6 -- O 34.6 --
Figure 70: SM-fractured 20x. Figure 71: SM(3)-polished 20x.](https://image.slidesharecdn.com/rueddenklau-snowman-prevention-180622055019/85/snowman-92-320.jpg)
![93
Table 59: EDX-analyses of SM(1)-polished 100x.
Element
[wt.-%]
Oxide
[wt.-%]
Na 1.0 Na2O 1.4
Mg 1.8 MgO 3.0
Al 1.8 Al2O3 3.4
Si 8.9 SiO2 19.2
K 0.3 K2O 0.3
Ca 48.9 CaO 68.4
Fe 1.4 FeO 1.9
S 0.8 SO3 2.0
O 34.7 --
Figure 72: SM(1)-polished 100x.
Figure 73: SM(3)-polished 20x. Figure 74: SM(3)-polished 100x.
Figure 75: SM(3)-polished 500x. Figure 76: SM(3)-polished 1000x.](https://image.slidesharecdn.com/rueddenklau-snowman-prevention-180622055019/85/snowman-93-320.jpg)
![94
Figure 77: SM(1)-polished 500x.
Table 60: EDX-analyses point 1(left table) & 2 (right table) of SM(1)-polished 500x.
Element
[wt.-%]
Oxide
[wt.-%]
Element
[wt.-%]
Oxide
[wt.-%]
Na 0.0 Na2O 0.0 Na 0.0 Na2O 0.0
Mg 0.7 MgO 1.1 Mg 58.5 MgO 97.1
Al 0.7 Al2O3 1.3 Al 0.0 Al2O3 0.0
Si 10.1 SiO2 21.7 Si 0.1 SiO2 0.4
K 0.0 K2O 0.0 K 0.0 K2O 0.0
Ca 52.7 CaO 73.7 Ca 1.0 CaO 1.4
Fe 0.5 FeO 0.6 Fe 0.7 FeO 1.0
S 0.5 SO3 1.2 S 0.0 SO3 0.0
O 34.6 -- O 39.4 --
Table 61: EDX-analyses point 3 (left table) & 4 (right table) of SM(1)-polished 500x.
Element
[wt.-%]
Oxide
[wt.-%]
Element
[wt.-%]
Oxide
[wt.-%]
Na 0.4 Na2O 0.5 Na 0.5 Na2O 0.7
Mg 0.4 MgO 0.6 Mg 0.9 MgO 1.5
Al 0.7 Al2O3 1.4 Al 0.7 Al2O3 1.4
Si 14.4 SiO2 30.8 Si 10.7 SiO2 22.9
K 0.2 K2O 0.2 K 0.2 K2O 0.2
Ca 45.4 CaO 63.5 Ca 51.4 CaO 72.0
Fe 0.7 FeO 0.9 Fe 0.4 FeO 0.5
S 0.7 SO3 1.8 S 0.2 SO3 0.5
O 36.9 -- O 34.7 --](https://image.slidesharecdn.com/rueddenklau-snowman-prevention-180622055019/85/snowman-94-320.jpg)
![95
Table 62: EDX-analyses point 5 (left table) & 6 (right table) of SM(1)-polished 500x.
Element
[wt.-%]
Oxide
[wt.-%]
Element
[wt.-%]
Oxide
[wt.-%]
Na 0.6 Na2O 0.9 Na 0.7 Na2O 0.9
Mg 0.9 MgO 1.5 Mg 0.8 MgO 1.3
Al 0.8 Al2O3 1.6 Al 11.6 Al2O3 22.0
Si 10.5 SiO2 22.4 Si 1.3 SiO2 2.8
K 0.0 K2O 0.0 K 0.1 K2O 0.1
Ca 50.6 CaO 70.8 Ca 36.3 CaO 50.8
Fe 0.7 FeO 0.9 Fe 16.2 FeO 20.9
S 0.6 SO3 1.6 S 0.3 SO3 0.8
O 34.9 -- O 32.3 --
Figure 78: SM(2)-polished 500x.
Table 63: EDX-analyses point 1 (left table) & 2 (right table) of SM(2)-polished 500x.
Element
[wt.-%]
Oxide
[wt.-%]
Element
[wt.-%]
Oxide
[wt.-%]
Na 0.0 Na2O 0.0 Na 1.5 Na2O 2.1
Mg 0.6 MgO 1.0 Mg 1.2 MgO 1.0
Al 1.7 Al2O3 3.3 Al 11.8 Al2O3 22.3
Si 8.5 SiO2 18.3 Si 0.2 SiO2 0.5
K 0.0 K2O 0.0 K 0.1 K2O 0.2
Ca 54.0 CaO 75.6 Ca 35.5 CaO 49.7
Fe 0.6 FeO 0.8 Fe 17.6 FeO 22.6
S 0.3 SO3 0.8 S 0.1 SO3 0.3
O 34.0 -- O 31.6 --](https://image.slidesharecdn.com/rueddenklau-snowman-prevention-180622055019/85/snowman-95-320.jpg)
![96
Table 64: EDX-analyses point 3 (left table) & 4 (right table) of SM(2)-polished 500x.
Element
[wt.-%]
Oxide
[wt.-%]
Element
[wt.-%]
Oxide
[wt.-%]
Na 0.0 Na2O 0.0 Na 0.8 Na2O 1.1
Mg 59.2 MgO 98.2 Mg 0.4 MgO 0.7
Al 0.0 Al2O3 0.0 Al 2.2 Al2O3 4.2
Si 0.2 SiO2 0.6 Si 12.6 SiO2 27.0
K 0.0 K2O 0.0 K 0.2 K2O 0.3
Ca 0.0 CaO 0.0 Ca 46.3 CaO 64.8
Fe 0.8 FeO 1.1 Fe 0.4 FeO 0.5
S 0.0 SO3 0.0 S 0.4 SO3 1.0
O 39.5 -- O 36.3 --
Table 65: EDX-analyses point 5 of SM(2)-polished 500x.
Element
[wt.-%]
Oxide
[wt.-%]
Na 1.0 Na2O 1.4
Mg 1.8 MgO 3.0
Al 1.8 Al2O3 3.4
Si 8.9 SiO2 19.2
K 0.3 K2O 0.3
Ca 48.9 CaO 68.4
Fe 1.4 FeO 1.9
S 0.8 SO3 2.0
O 34.7 --](https://image.slidesharecdn.com/rueddenklau-snowman-prevention-180622055019/85/snowman-96-320.jpg)
![97
Figure 79: SM(3)-polished 500x.
Table 66: EDX-analyses point 1 (left table) & 2 (right table of SM(3)-polished 500x.
Element
[wt.-%]
Oxide
[wt.-%]
Element
[wt.-%]
Oxide
[wt.-%]
Na 0.9 Na2O 1.2 Na 1.2 Na2O 1.6
Mg 0.4 MgO 0.7 Mg 1.3 MgO 2.1
Al 1.2 Al2O3 2.3 Al 10.7 Al2O3 20.3
Si 13.9 SiO2 29.8 Si 0.3 SiO2 0.7
K 0.2 K2O 0.3 K 0.0 K2O 0.0
Ca 44.3 CaO 62.0 Ca 36.4 CaO 51.0
Fe 0.8 FeO 1.1 Fe 18.6 FeO 24.0
S 0.9 SO3 2.3 S 0.0 SO3 0.0
O 37.0 -- O 31.1 --
Table 67: EDX-analyses point 3 (left table) & 4 (right table) of SM(3)-polished 500x.
Element
[wt.-%]
Oxide
[wt.-%]
Element
[wt.-%]
Oxide
[wt.-%]
Na 1.1 Na2O 1.6 Na 0.7 Na2O 0.9
Mg 0.8 MgO 1.4 Mg 0.5 MgO 0.9
Al 12.6 Al2O3 23.9 Al 0.6 Al2O3 1.1
Si 0.5 SiO2 1.1 Si 10.3 SiO2 22.0
K 0.1 K2O 0.2 K 0.0 K2O 0.0
Ca 37.3 CaO 52.2 Ca 52.0 CaO 72.8
Fe 14.7 FeO 19.0 Fe 0.4 FeO 0.6
S 0.1 SO3 0.4 S 0.5 SO3 1.3
O 32.2 -- O 34.6 --](https://image.slidesharecdn.com/rueddenklau-snowman-prevention-180622055019/85/snowman-97-320.jpg)
![98
Table 68: EDX-analyses of point 5 of SM(3)-polished 500x.
Element
[wt.-%]
Oxide
[wt.-%]
Na 1.0 Na2O 1.4
Mg 1.8 MgO 3.0
Al 1.8 Al2O3 3.4
Si 8.9 SiO2 19.2
K 0.3 K2O 0.3
Ca 48.9 CaO 68.4
Fe 1.4 FeO 1.9
S 0.8 SO3 2.0
O 34.7 --](https://image.slidesharecdn.com/rueddenklau-snowman-prevention-180622055019/85/snowman-98-320.jpg)
![100
Table 69: EDX-analyses of Clinker-polished 20x.
Element
[wt.-%]
Oxide
[wt.-%]
Na 0.0 Na2O 0.0
Mg 0.7 MgO 1.1
Al 0.7 Al2O3 1.3
Si 10.1 SiO2 21.7
K 0.0 K2O 0.0
Ca 52.7 CaO 73.7
Fe 0.5 FeO 0.6
S 0.5 SO3 1.2
O 34.6 --
Figure 87: Clinker-polished 500x.
Table 70: EDX-analyses point 1 (left table) & 2 (right table) of Clinker-polished 500x.
Element
[wt.-%]
Oxide
[wt.-%]
Element
[wt.-%]
Oxide
[wt.-%]
Na 0.7 Na2O 0.9 Na 0.4 Na2O 0.5
Mg 0.6 MgO 0.9 Mg 0.4 MgO 0.8
Al 0.5 Al2O3 1.0 Al 0.5 Al2O3 1.0
Si 10.3 SiO2 22.1 Si 10.5 SiO2 22.6
K 0.0 K2O 0.0 K 0.1 K2O 0.1
Ca 52.4 CaO 73.3 Ca 52.1 CaO 72.9
Fe 0.6 FeO 0.8 Fe 0.7 FeO 1.0
S 0.3 SO3 0.7 S 0.3 SO3 0.8
O 34.4 -- O 34.5 --](https://image.slidesharecdn.com/rueddenklau-snowman-prevention-180622055019/85/snowman-100-320.jpg)
![101
Table 71: EDX-analyses point 3 (left table) & 4 (right table) of Clinker-polished 500x.
Element
[wt.-%]
Oxide
[wt.-%]
Element
[wt.-%]
Oxide
[wt.-%]
Na 0.0 Na2O 0.0 Na 0.2 Na2O 0.3
Mg 0.2 MgO 0.3 Mg 0.7 MgO 1.2
Al 0.5 Al2O3 1.0 Al 0.3 Al2O3 0.5
Si 10.4 SiO2 22.3 Si 0.4 SiO2 0.9
K 0.1 K2O 0.1 K 0.1 K2O 0.2
Ca 52.7 CaO 73.8 Ca 68.3 CaO 95.5
Fe 1.1 FeO 1.4 Fe 0.5 FeO 0.7
S 0.3 SO3 0.8 S 0.1 SO3 0.3
O 34.4 -- O 29.0 --
Table 72: EDX-analyses point 5 (left table) & 6 (right table) of Clinker-polished 500x.
Element
[wt.-%]
Oxide
[wt.-%]
Element
[wt.-%]
Oxide
[wt.-%]
Na 0.5 Na2O 0.7 Na 0.3 Na2O 0.4
Mg 0.4 MgO 0.7 Mg 1.6 MgO 2.7
Al 0.3 Al2O3 0.6 Al 10.1 Al2O3 19.2
Si 11.0 SiO2 23.6 Si 1.0 SiO2 2.1
K 0.0 K2O 0.0 K 0.1 K2O 0.1
Ca 52.3 CaO 73.1 Ca 38.1 CaO 53.3
Fe 0.4 FeO 0.6 Fe 16.4 FeO 21.1
S 0.2 SO3 0.5 S 0.3 SO3 0.7
O 34.6 -- O 31.8 --
Table 73: EDX-analyses point 7 (left table) & 8 (right table) of Clinker-polished 500x.
Element
[wt.-%]
Oxide
[wt.-%]
Element
[wt.-%]
Oxide
[wt.-%]
Na 1.1 Na2O 1.5 Na 1.0 Na2O 1.3
Mg 0.8 MgO 1.4 Mg 1.6 MgO 2.8
Al 1.0 Al2O3 2.0 Al 10.1 Al2O3 19.1
Si 13.2 SiO2 28.4 Si 2.1 SiO2 4.6
K 0.4 K2O 0.5 K 0.0 K2O 0.0
Ca 44.9 CaO 62.8 Ca 39.0 CaO 54.6
Fe 1.0 FeO 1.2 Fe 13.2 FeO 17.0
S 0.7 SO3 1.9 S 0.1 SO3 0.2
O 36.5 -- O 32.5 --](https://image.slidesharecdn.com/rueddenklau-snowman-prevention-180622055019/85/snowman-101-320.jpg)
![102
Figure 88: Clinker(b)-polished 2000x.
Table 74: EDX-analyses point 1 (left table) & 2 (right table of Clinker(b)-polished 2000x.
Element
[wt.-%]
Oxide
[wt.-%]
Element
[wt.-%]
Oxide
[wt.-%]
Na 0.5 Na2O 0.7 Na 0.8 Na2O 1.1
Mg 12.9 MgO 21.3 Mg 0.8 MgO 1.3
Al 10.9 Al2O3 20.6 Al 0.8 Al2O3 1.5
Si 1.2 SiO2 2.5 Si 10.5 SiO2 22.5
K 0.2 K2O 0.3 K 0.0 K2O 0.0
Ca 35.7 CaO 50.0 Ca 50.9 CaO 71.2
Fe 2.8 FeO 3.6 Fe 0.8 FeO 1.0
S 0.2 SO3 0.5 S 0.4 SO3 1.0
O 35.2 -- O 34.7 --
Table 75: EDX-analyses point 3 (left table) & 4 (right table of Clinker(b)-polished 2000x.
Element
[wt.-%]
Oxide
[wt.-%]
Element
[wt.-%]
Oxide
[wt.-%]
Na 0.8 Na2O 1.1 Na 0.7 Na2O 0.9
Mg 0.7 MgO 1.3 Mg 1.7 MgO 2.9
Al 0.6 Al2O3 1.1 Al 9.0 Al2O3 17.1
Si 10.4 SiO2 22.2 Si 1.7 SiO2 3.7
K 0.0 K2O 0.0 K 0.1 K2O 0.1
Ca 51.4 CaO 71.9 Ca 38.3 CaO 53.6
Fe 0.9 FeO 1.2 Fe 16.4 FeO 21.1
S 0.4 SO3 0.9 S 0.1 SO3 0.4
O 34.5 -- O 31.7 --](https://image.slidesharecdn.com/rueddenklau-snowman-prevention-180622055019/85/snowman-102-320.jpg)

This document provides an overview of cement clinker production principles including: 1. Clinker phases that form during burning and their chemical formulas. 2. Calculations used to determine potential clinker phase composition and melting phase content. 3. Important production moduli like lime saturation factor, silica ratio, and alumina ratio that characterize raw materials and clinker. 4. The burning process and formation of clinker phases over increasing temperatures in the kiln. 5. Types of clinker coolers and their design features to cool clinker efficiently. The document serves as an introduction to cement production processes and parameters relevant to analyzing snowman formation issues.


