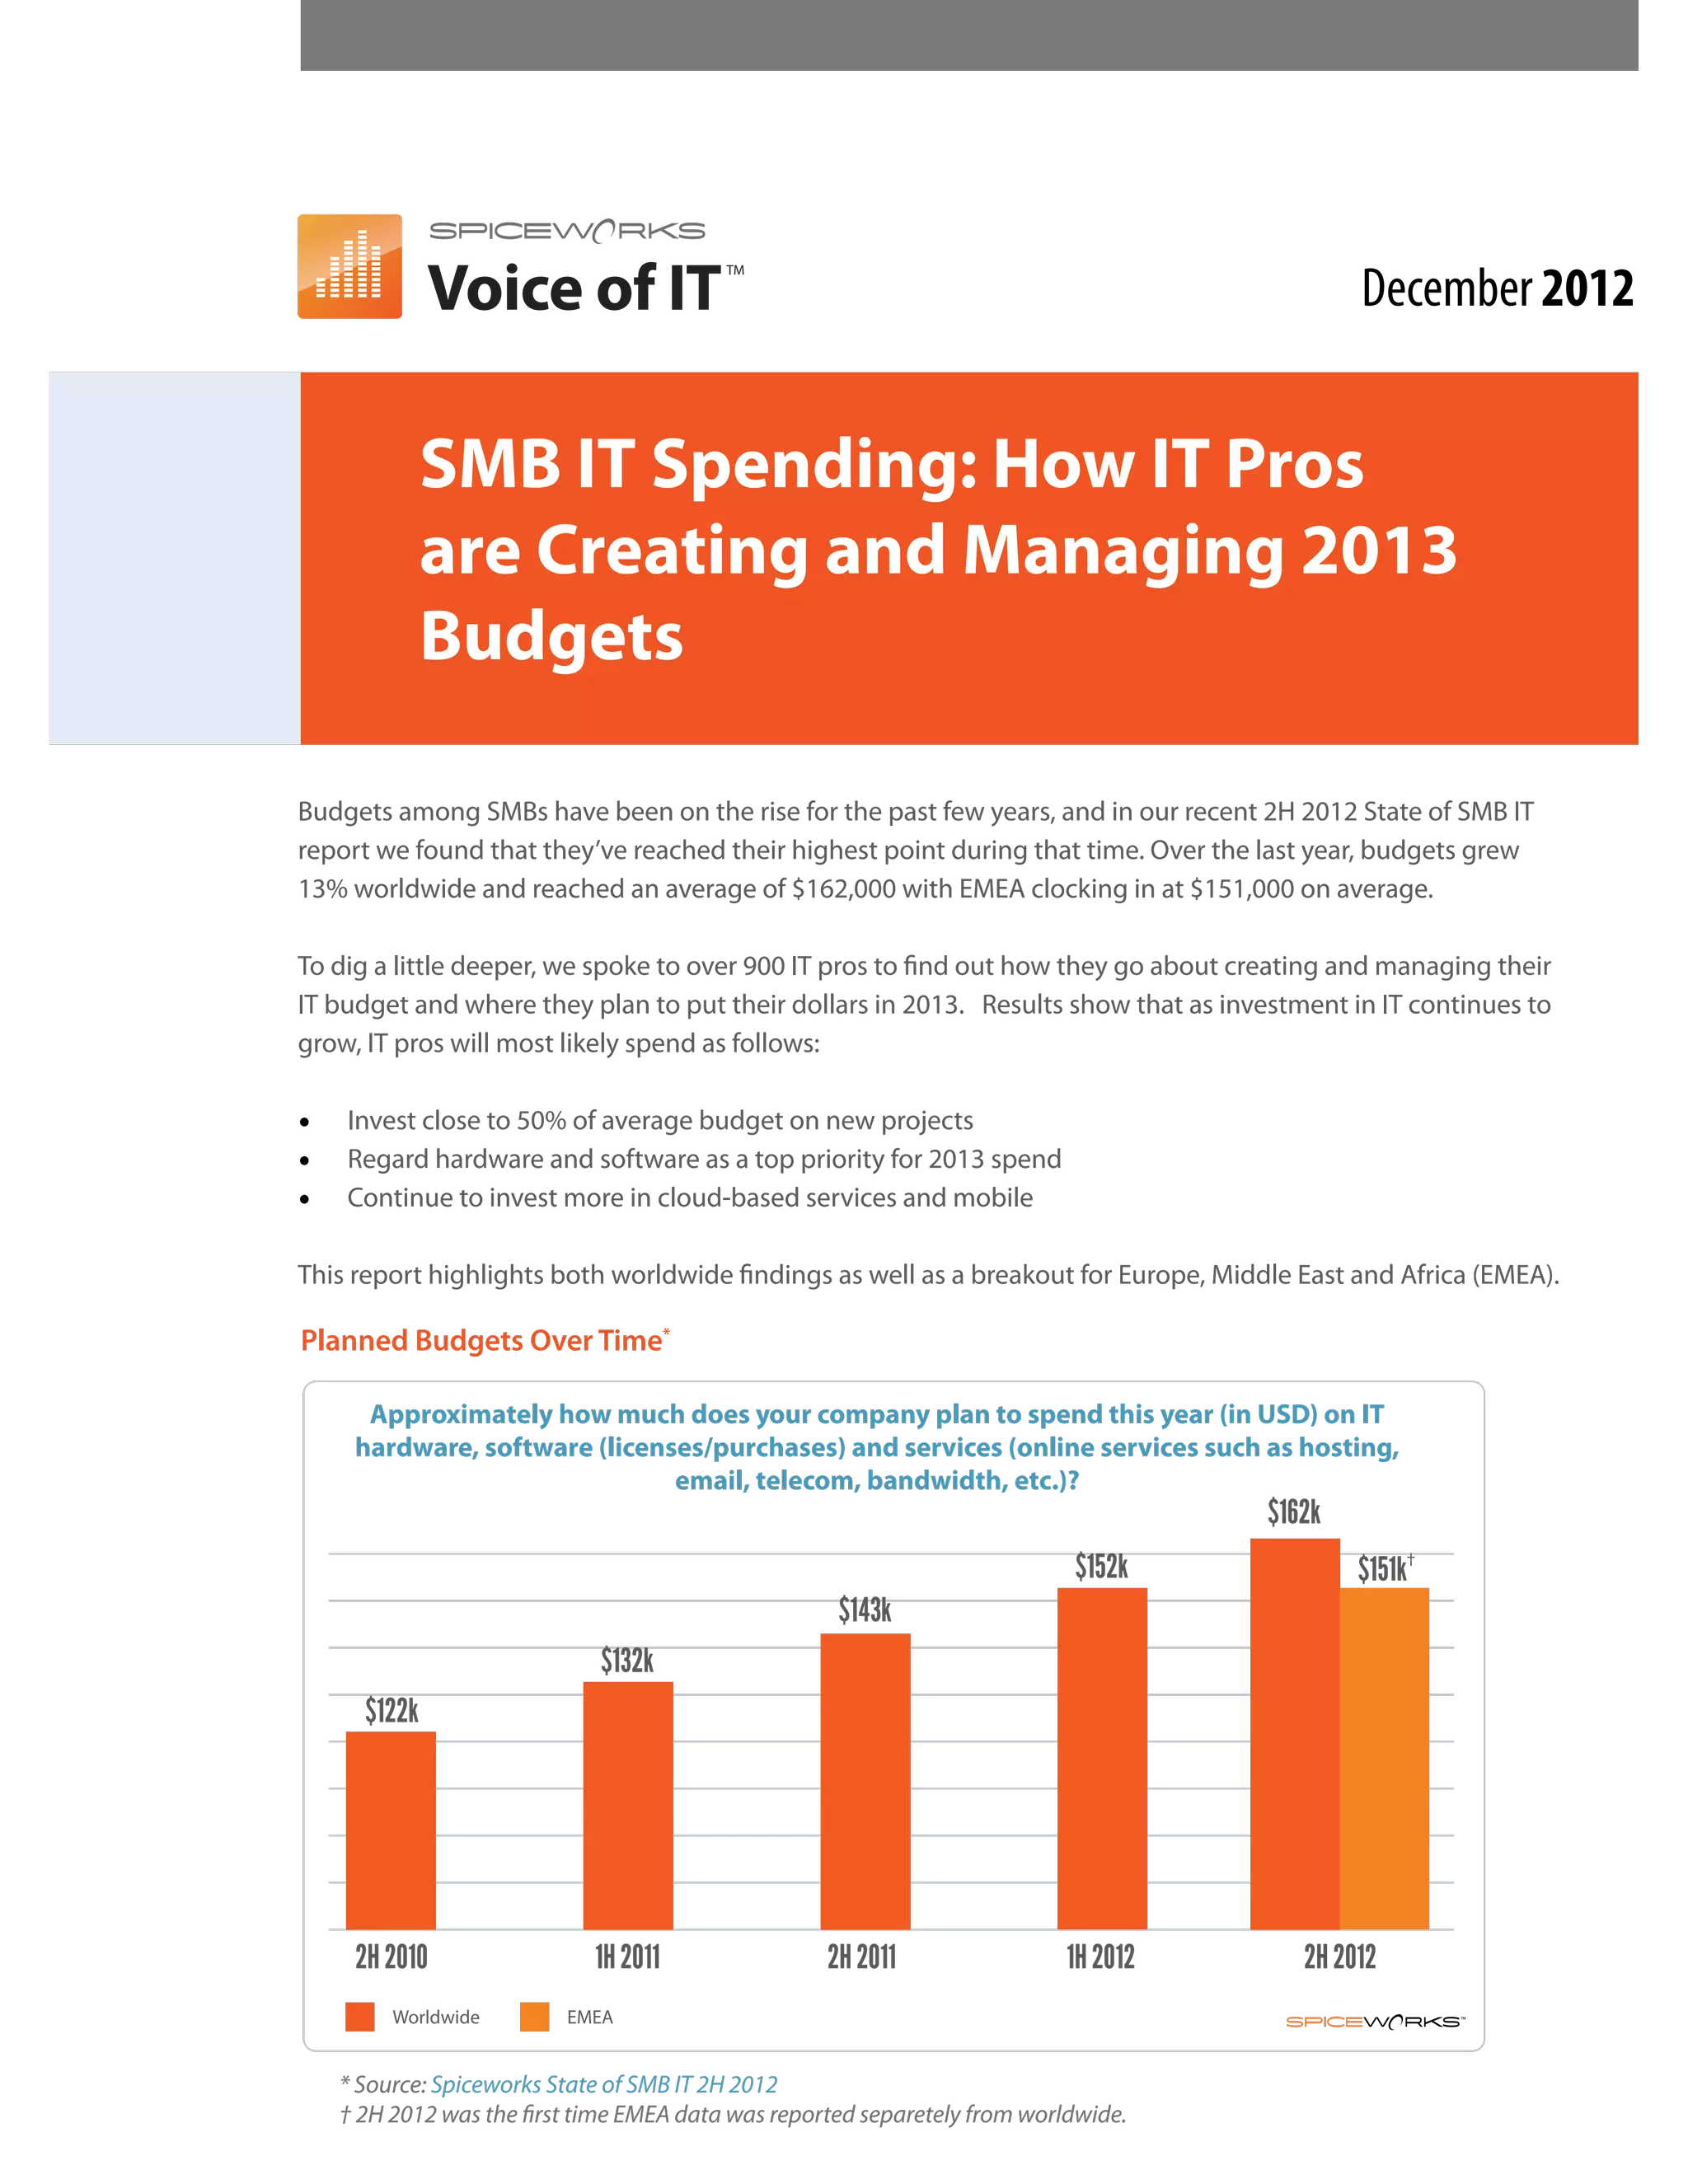
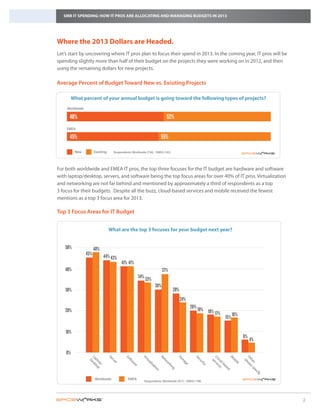
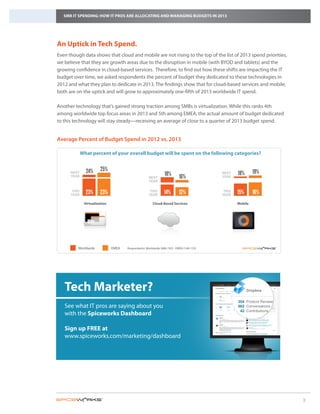
Voice of IT                                                                     December 2012
                                         TM


           SMB IT Spending: How IT Pros
      Approximately how much does your company plan to spend this year (in USD) on IT
     hardware, software (licenses/purchases) and services (online services such as hosting,
                               email, telecom, bandwidth, etc.)?

           are Creating and Managing 2013
                              $152k
                                    $162k
                                          $151k*

     $122k
           Budgets
                 $132k
                        $143k


Budgets among SMBs have been on the rise for the past few years, and in our recent 2H 2012 State of SMB IT
report we found that they’ve reached their highest point during that time. Over the last year, budgets grew
13% worldwide and reached an average of $162,000 with EMEA clocking in at $151,000 on average.

To dig a little deeper, we spoke to over 900 IT pros to find out how they go about creating and managing their
IT budget and where they plan to put their dollars in 2013. Results show that as investment in IT continues to
grow, IT pros will most likely spend as follows:

•	 Invest close to 50% of1H 2011 budget on new projects
    2H 2010               average           2H 2011              1H 2012                2H 2012
•	 Regard hardware and software as a top priority for 2013 spend
        Worldwide     EMEA
•	 Continue to invest more in cloud-based services and mobile

This report highlights both worldwide findings as well as a breakout for Europe, Middle East and Africa (EMEA).

Planned Budgets Over Time*

      Approximately how much does your company plan to spend this year (in USD) on IT
     hardware, software (licenses/purchases) and services (online services such as hosting,
                               email, telecom, bandwidth, etc.)?
                                                                                     $162k
                                                                           $152k             $151k†
                                                    $143k
                            $132k
     $122k


     2H 2010                1H 2011                2H 2011                 1H 2012      2H 2012
        Worldwide        EMEA


   * Source: Spiceworks State of SMB IT 2H 2012
   † 2H 2012 was the first time EMEA data was reported separetely from worldwide.
SMB IT SPENDING: HOW IT PROS ARE ALLOCATING AND MANAGING BUDGETS IN 2013


Where the 2013 Dollars are Headed.
Let’s start by uncovering where IT pros plan to focus their spend in 2013. In the coming year, IT pros will be
spending slightly more than half of their budget on the projects they were working on in 2012, and then
using the remaining dollars for new projects.

Average Percent of Budget Toward New vs. Exisiting Projects

         What percent of your annual budget is going toward the following types of projects?
    Worldwide

      48%                                                                  52%
    EMEA

      45%                                                              55%

          New         Exisiting     Respondents: Worldwide (756) - EMEA (165)


For both worldwide and EMEA IT pros, the top three focuses for the IT budget are hardware and software
with laptop/desktop, servers, and software being the top focus areas for over 40% of IT pros. Virtualization
and networking are not far behind and mentioned by approximately a third of respondents as a top
3 focus for their budgets. Despite all the buzz, cloud-based services and mobile received the fewest
mentions as a top 3 focus area for 2013.

Top 3 Focus Areas for IT Budget


                                  What are the top 3 focuses for your budget next year?


    50%               48%
                45%         44% 43%
                                         41% 41%
    40%                                                                  37%
                                                     34% 33%
                                                                   30%
    30%                                                                         28%
                                                                                      24%
                                                                                              20%
   20%                                                                                              19% 18%
                                                                                                            17%           16%
                                                                                                                    15%

    10%
                                                                                                                                    6%
                                                                                                                                         4%

    0%
                 La e s k


                                  Se


                                            So


                                                        Vi


                                                                      Ne


                                                                                    St


                                                                                                Se


                                                                                                           Cl rvi


                                                                                                                          M


                                                                                                                                    Ot leas
                                                           rtu


                                                                                                                          ob
                                                                                                             ou ce
                                                                                      or
                   pt to


                                  rv


                                                                                                    cu


                                                                                                                                      he e s
                                              ftw


                                                                        tw
                   D


                                                                                                              se


                                                                                                                                      p
                                                                                        ag
                                    er
                     op p


                                                                                                                d- s


                                                                                                                              ile
                                                                                                     rit
                                                               a


                                                                                                                                        r, pe
                                                                          or
                                                 ar


                                                             liz


                                                                                          e


                                                                                                                  ba
                                                                                                      y
                        /


                                                                            ki
                                                   e


                                                               at


                                                                               ng


                                                                                                                     se
                                                                 io


                                                                                                                    d
                                                                   n


                                                                                                                                              cif
                                                                                                                                                 y


                      Worldwide               EMEA
                                                          Respondents: Worldwide (927) - EMEA (198)


                                                                                                                                                     2
2012 2013            2012 2013                     2012 2013             2012 2013       2012 2013            2012 2013
               Virtualization                                 Cloud-Based Services                         Mobile

   SMB IT SPENDING: HOW IT PROS ARE ALLOCATING AND MANAGING BUDGETS IN 2013
          Worldwide     EMEA


              What percent of your overall budget will be spent on the following categories?

An Uptick in Tech Spend.
     THIS
     YEAR     23%                                           THIS
                                                            YEAR     12% 14%                     THIS
                                                                                                 YEAR      15% 16%
Even though
        NEXT
        YEAR
              data shows that cloud and
                   24% 25%                             mobile
                                                are not rising to the top of
                                                         NEXT
                                                     16% 18%
                                                         YEAR                          18% 19% the list
                                                                                   of 2013 spend priorities,
                                                                                                 NEXT
                                                                                                 YEAR
we believe that they are growth areas due to the disruption in mobile (with BYOD and tablets) and the
growing confidence in cloud-based services. Cloud-Based Services out how these shiftsMobile
            Virtualization
                                             Therefore, to find                       are impacting the IT
budget over time, we asked respondents the percent of budget they dedicated to these technologies in
         Worldwide         EMEA
2012 and what they plan to dedicate in 2013. The findings show that for cloud-based services and mobile,
both are on the uptick and will grow to approximately one-fifth of 2013 worldwide IT spend.
          What percent of your overall budget will be spent on the following categories?

Another technology that’s gained strong traction among SMBs is virtualization. While this ranks 4th
    THIS YEAR   23%                23%          12%           14%           15%              16%
among worldwide top focus areas in 2013 and 5th among EMEA, the actual amount of budget dedicated
    NEXT YEAR  24%                  25%       16%                 18%     18%                   19%
to this technology will stay steady—receiving an average of close to a quarter of 2013 budget spend.
                          Virtualization                           Cloud-Based Services                    Mobile


Average Worldwide of Budget Spend in 2012 vs. 2013
        Percent        EMEA


              What percent of your overall budget will be spent on the following categories?


                  24%    25%                                                                                        19%
      NEXT
                                                                     18%                        NEXT        18%
      YEAR                                                NEXT                 16%              YEAR
                                                          YEAR

       THIS
      YEAR        23%    23%                               THIS
                                                          YEAR       14%       12%               THIS
                                                                                                YEAR       15%      16%
               Virtualization                                Cloud-Based Services                          Mobile


          Worldwide             EMEA       Respondents: Worldwide (686-742) - EMEA (140-153)


   Tech Marketer?
   See what IT pros are saying about you
   with the Spiceworks Dashboard

   Sign up FREE at
   www.spiceworks.com/marketing/dashboard


                                                                                                                                3
SMB IT SPENDING: HOW IT PROS ARE ALLOCATING AND MANAGING BUDGETS IN 2013


 Calling the Budget Shots.
 Now that we know where the dollars are going, let’s take a look at how SMB IT pros create and manage
 their budgets. Over half of the respondents in this survey are the point person at their company for
 making recommendations on how the budget is spent (54%) and/or spending the budget (58%). Roughly
 a third are responsible for creating (31%) and managing (39%) the tech spend. In EMEA specifically, IT pros
 are more likely to be involved in managing the budget (45%) and spending the budget (62%) than IT pros
 worldwide.


 Level of Responsibility for IT Budgets


                                           What is your role when it comes to developing
                                          and managing the IT budget for your company?


                    I spend the budget
                                                                                                                                            58%
                                                                                                                                                      62%
       I make recommendations on                                                                                                         54%
          how we spend our budget                                                                                                         55%
                   I provide input in                                                                                            46%
               developing the budget
                                                                                                                                 46%
                 I manage the budget                                                                               39%
                                                                                                                             45%
                    I create the budget                                                              31%
                                                                                                      32%
      I am not involved with budget                              10%
     or spending for our department
                                                                 10%
                                           0%                10%               20%             30%              40%                50%          60%
                                                     Worldwide               EMEA    Respondents: Worldwide (942) - EMEA (200)


It is interesting to note that not all tech dollars are being spent in the IT departments. Forty-seven percent
of respondents state that other departments are using their own budgets to purchase IT technologies or
devices. This is similar for EMEA respondents with half stating that IT spending happens outside of their
department.

 IT Spending in Other Departments


                                                                                                                “
       Does any of the spending on IT technologies or devices                                                     FROM THE COMMUNITY
      for your company happen outside of the IT department?
                                                                                                                  We have departments going
                                                                                                                  out and spending thousands of
               7%                                       7%                                                                                  “
                                                                                        Yes                       dollars to develop mobile apps
                                                                                                                  without approval from IT and
     46%                    47%                43%                     50%              No                        keeping the devices away from
                                                                                                                  IT’s hands.
                                                                                        Don’t know
                                                                                                                  J Barnett
                                                                                                                  Sharepoint Designer
             Worldwide                                  EMEA                                                      community.spiceworks.com

   Respondents: Worldwide (926) - EMEA (198)


                                                                                                                                                            4
SMB IT SPENDING: HOW IT PROS ARE ALLOCATING AND MANAGING BUDGETS IN 2013

   4%                               10%                             27%                           26%
   5%                                6%                             31%                           28%
When to plan?
There is not a whole lot of lead time in developing the IT budget for SMBs. Over half (53%) of respondents
         At least 1 year       6-12 months           3-6 months            1-3 months          2013
start planning only 6 months in advance when it is time to start spending. in advance
         in advance            out from              in advance            And a quarter of respondents
worldwide do not have any formal budget planning.

               25%                                                                           9%               Don’t know
EMEA IT pros are only slightly more likely to plan do any at least 6 months in advance (59% vs. 53% of
                                         We do not budgets
                                         formal budget planning
             22%
worldwide IT pros).                                                  9%          Don’t know


             Worldwide            EMEA

IT Budget Planning

                     When does your company start planning for next year’s budget?


                                                                                          6-12 months
                                                                                          in advance

                                      3-6 months
                                                                                                    10%
                                          in advance                                              6%
                           27%
                     31%                                             2013
                                                                                    1-3 months
                                                                                    in advance
                                                                                                       26%
                                                                                                        28%
                         At least 1 year
                                 in advance
                                4%
                              5%

       Worldwide                                                  EMEA
       25%    We do not do any formal budget planning             22%     We do not do any formal budget planning
       9%     Don’t know                                          9%      Don’t know


             Worldwide            EMEA        Respondents: Worldwide (939) - EMEA (197)


                                                                                                                           5
Does your company have a “use it or lose it” policy for your department’s annual budget?

   SMB IT SPENDING: HOW IT PROS ARE ALLOCATING AND MANAGING BUDGETS IN 2013
                  14%       23%                      17%
                                                              27%                Yes


                                                                                 No
Outside Factors Impacting IT Spend.
                                                                                 Don’t know
            63%                      56%
While IT pros do their best to develop a budget to meet their company’s needs, a variety of corporate
policies or practices can impact how they go about managing and spending their budget throughout the
             Worldwide                 EMEA
year. Two specific areas we asked about were the likelihood of getting additional budget during the year
and whether or not their company supports a “use it or lose it” policy.

The results show a good amount of IT departments anticipate receiving extra funds headed their way with
nearly half your company have a “use itthey are it” policy for your department’s annual budget? year
     Does of respondents (45%) stating or lose likely to receive additional budget throughout the
worldwide and 42% in EMEA.
     Worldwide


      63%
Likelihood of Receiving Additional Budget During Year                                        23%                        14%

      EMEA
      How likely is it that your department will receive additional budget throughout the year?
        56%                                                                            27%                        17%

                                                                                                                        Very likely
             11%
            Yes
                        13%No           Don’t know
                                                                      10% 11%                                           Somewhat likely
       9%
                                          45%                                                 42%
                                                               12%
                                                                                                                        Neither
                                32%                                              31%
    19%                                   Likely to receive   21%                             Likely to receive         Not very likely
                                          additional budget                                   additional budget
      Does your company have a “use it or lose it” policy for your department’s annual budget?
              17%                                                         16%                                           Not at all likely

      Worldwide
                                                                                                                        Don’t know
             Worldwide                                                    EMEA
        23%                       63%                                                                                   14%
  Respondents: Worldwide (938) - EMEA (200)
      EMEA

      27%                  56%                                                          17%
Only 23% of respondents have a “use it or lose it” policy and need to make sure all dollars are unloaded by
year end. EMEA shows similar results with 27% having a “use it or lose it” policy.
            Yes           No            Don’t know
“Use it or Lose it” Budget Policy


                                                                                              “
   Does your company have a “use it or lose it” policy                                             FROM THE COMMUNITY
        for your department’s annual budget?
                                                                                                   I’ve found that the budget
      Worldwide
                                                                                                   process is an ongoing process
        23%

      EMEA
                     63%                                            14%                            not a once a year event.
                                                                                                   Birdra
                                                                                                   IT Manager
                                                                                                                              “
                                                                                                   community.spiceworks.com
        27%               56%                                   17%

            Yes           No            Don’t know

      Respondents: Worldwide (937) - EMEA (196)


                                                                                                                                            6
SMB IT SPENDING: HOW IT PROS ARE ALLOCATING AND MANAGING BUDGETS IN 2013


Survey Methodology
The results in this report are from a recent Voice of IT® survey conducted with 942 SMB IT pros worldwide
from companies with less than 1000 employees. Nearly two-thirds of respondents are from North America
and close to a quarter are from EMEA. By company size, over half (54%) are from companies with less than
100 employees.


    Company Size                                                                  Region
                                                                                                                 Latin
                                                                                                                 America
   250+                                                                            Asia
   employees                                                                       Pacific               4%
                      17%                            1-19 employees                                11%
                                                                                                                                 North
                                         19%                                  EMEA                                               America

                29%                                                                          23%               48% 63%
    100-249
    employees
                             35%
                                     20-99 employees


    About Spiceworks Voice of IT®

    The Spiceworks Voice of IT® market Insights program publishes stats, trends and opinions collected from small
    and medium business technology professionals that are among the more than 2M users of Spiceworks. Survey
    panelists opt-in to answer questions on technology trends important to them.

    About Spiceworks

    Spiceworks™ the world’s largest social business platform for IT, connects 2 million IT professionals with more
                ,
    than 1,200 technology brands. By combining a Facebook-like community with free IT management software,
    Spiceworks helps businesses to discover, buy and manage $350 billion worth of technology products and
    services each year.

    To learn more, visit:			                               Be first to hear about Spiceworks Voice of IT® insights, email:
    http://www.spiceworks.com/voice-of-it	                 marketresearch@spiceworks.com


The contents in this report are a result of primary research performed by Spiceworks. Unless otherwise noted, the entire contents
distributed as part of this report are copyrighted by Spiceworks. As such any information made available by any means in this report may
not be copied, reproduced, duplicated, published, displayed, transmitted, distributed, given, sold, traded, resold, marketed, offered for sale,
modified to create derivative works or otherwise exploited for valuable consideration without prior written consent by Spiceworks. For
more information visit www.spiceworks.com/voice-of-it/terms.

This report contains information of fact relating to parties other than Spiceworks. Although the information have been obtained from, and
are based on sources that Spiceworks believes to be reliable, Spiceworks does not guarantee the accuracy, and any such information might
be incomplete or condensed. Any estimates included in this report constitute Spiceworks’ judgment as of the date of compilation, and are
subject to change without notice. This report is for information purposes only. All responsibility for any interpretations or actions based on
the information or commentary contained within this report lie solely with the recipient.

All rights reserved. 2012.


                                                                                                                                                  7

IT SMB 2013 Budget Report

  • 1.
    Voice of IT December 2012 TM SMB IT Spending: How IT Pros Approximately how much does your company plan to spend this year (in USD) on IT hardware, software (licenses/purchases) and services (online services such as hosting, email, telecom, bandwidth, etc.)? are Creating and Managing 2013 $152k $162k $151k* $122k Budgets $132k $143k Budgets among SMBs have been on the rise for the past few years, and in our recent 2H 2012 State of SMB IT report we found that they’ve reached their highest point during that time. Over the last year, budgets grew 13% worldwide and reached an average of $162,000 with EMEA clocking in at $151,000 on average. To dig a little deeper, we spoke to over 900 IT pros to find out how they go about creating and managing their IT budget and where they plan to put their dollars in 2013. Results show that as investment in IT continues to grow, IT pros will most likely spend as follows: • Invest close to 50% of1H 2011 budget on new projects 2H 2010 average 2H 2011 1H 2012 2H 2012 • Regard hardware and software as a top priority for 2013 spend Worldwide EMEA • Continue to invest more in cloud-based services and mobile This report highlights both worldwide findings as well as a breakout for Europe, Middle East and Africa (EMEA). Planned Budgets Over Time* Approximately how much does your company plan to spend this year (in USD) on IT hardware, software (licenses/purchases) and services (online services such as hosting, email, telecom, bandwidth, etc.)? $162k $152k $151k† $143k $132k $122k 2H 2010 1H 2011 2H 2011 1H 2012 2H 2012 Worldwide EMEA * Source: Spiceworks State of SMB IT 2H 2012 † 2H 2012 was the first time EMEA data was reported separetely from worldwide.
  • 2.
    SMB IT SPENDING:HOW IT PROS ARE ALLOCATING AND MANAGING BUDGETS IN 2013 Where the 2013 Dollars are Headed. Let’s start by uncovering where IT pros plan to focus their spend in 2013. In the coming year, IT pros will be spending slightly more than half of their budget on the projects they were working on in 2012, and then using the remaining dollars for new projects. Average Percent of Budget Toward New vs. Exisiting Projects What percent of your annual budget is going toward the following types of projects? Worldwide 48% 52% EMEA 45% 55% New Exisiting Respondents: Worldwide (756) - EMEA (165) For both worldwide and EMEA IT pros, the top three focuses for the IT budget are hardware and software with laptop/desktop, servers, and software being the top focus areas for over 40% of IT pros. Virtualization and networking are not far behind and mentioned by approximately a third of respondents as a top 3 focus for their budgets. Despite all the buzz, cloud-based services and mobile received the fewest mentions as a top 3 focus area for 2013. Top 3 Focus Areas for IT Budget What are the top 3 focuses for your budget next year? 50% 48% 45% 44% 43% 41% 41% 40% 37% 34% 33% 30% 30% 28% 24% 20% 20% 19% 18% 17% 16% 15% 10% 6% 4% 0% La e s k Se So Vi Ne St Se Cl rvi M Ot leas rtu ob ou ce or pt to rv cu he e s ftw tw D se p ag er op p d- s ile rit a r, pe or ar liz e ba y / ki e at ng se io d n cif y Worldwide EMEA Respondents: Worldwide (927) - EMEA (198) 2
  • 3.
    2012 2013 2012 2013 2012 2013 2012 2013 2012 2013 2012 2013 Virtualization Cloud-Based Services Mobile SMB IT SPENDING: HOW IT PROS ARE ALLOCATING AND MANAGING BUDGETS IN 2013 Worldwide EMEA What percent of your overall budget will be spent on the following categories? An Uptick in Tech Spend. THIS YEAR 23% THIS YEAR 12% 14% THIS YEAR 15% 16% Even though NEXT YEAR data shows that cloud and 24% 25% mobile are not rising to the top of NEXT 16% 18% YEAR 18% 19% the list of 2013 spend priorities, NEXT YEAR we believe that they are growth areas due to the disruption in mobile (with BYOD and tablets) and the growing confidence in cloud-based services. Cloud-Based Services out how these shiftsMobile Virtualization Therefore, to find are impacting the IT budget over time, we asked respondents the percent of budget they dedicated to these technologies in Worldwide EMEA 2012 and what they plan to dedicate in 2013. The findings show that for cloud-based services and mobile, both are on the uptick and will grow to approximately one-fifth of 2013 worldwide IT spend. What percent of your overall budget will be spent on the following categories? Another technology that’s gained strong traction among SMBs is virtualization. While this ranks 4th THIS YEAR 23% 23% 12% 14% 15% 16% among worldwide top focus areas in 2013 and 5th among EMEA, the actual amount of budget dedicated NEXT YEAR 24% 25% 16% 18% 18% 19% to this technology will stay steady—receiving an average of close to a quarter of 2013 budget spend. Virtualization Cloud-Based Services Mobile Average Worldwide of Budget Spend in 2012 vs. 2013 Percent EMEA What percent of your overall budget will be spent on the following categories? 24% 25% 19% NEXT 18% NEXT 18% YEAR NEXT 16% YEAR YEAR THIS YEAR 23% 23% THIS YEAR 14% 12% THIS YEAR 15% 16% Virtualization Cloud-Based Services Mobile Worldwide EMEA Respondents: Worldwide (686-742) - EMEA (140-153) Tech Marketer? See what IT pros are saying about you with the Spiceworks Dashboard Sign up FREE at www.spiceworks.com/marketing/dashboard 3
  • 4.
    SMB IT SPENDING:HOW IT PROS ARE ALLOCATING AND MANAGING BUDGETS IN 2013 Calling the Budget Shots. Now that we know where the dollars are going, let’s take a look at how SMB IT pros create and manage their budgets. Over half of the respondents in this survey are the point person at their company for making recommendations on how the budget is spent (54%) and/or spending the budget (58%). Roughly a third are responsible for creating (31%) and managing (39%) the tech spend. In EMEA specifically, IT pros are more likely to be involved in managing the budget (45%) and spending the budget (62%) than IT pros worldwide. Level of Responsibility for IT Budgets What is your role when it comes to developing and managing the IT budget for your company? I spend the budget 58% 62% I make recommendations on 54% how we spend our budget 55% I provide input in 46% developing the budget 46% I manage the budget 39% 45% I create the budget 31% 32% I am not involved with budget 10% or spending for our department 10% 0% 10% 20% 30% 40% 50% 60% Worldwide EMEA Respondents: Worldwide (942) - EMEA (200) It is interesting to note that not all tech dollars are being spent in the IT departments. Forty-seven percent of respondents state that other departments are using their own budgets to purchase IT technologies or devices. This is similar for EMEA respondents with half stating that IT spending happens outside of their department. IT Spending in Other Departments “ Does any of the spending on IT technologies or devices FROM THE COMMUNITY for your company happen outside of the IT department? We have departments going out and spending thousands of 7% 7% “ Yes dollars to develop mobile apps without approval from IT and 46% 47% 43% 50% No keeping the devices away from IT’s hands. Don’t know J Barnett Sharepoint Designer Worldwide EMEA community.spiceworks.com Respondents: Worldwide (926) - EMEA (198) 4
  • 5.
    SMB IT SPENDING:HOW IT PROS ARE ALLOCATING AND MANAGING BUDGETS IN 2013 4% 10% 27% 26% 5% 6% 31% 28% When to plan? There is not a whole lot of lead time in developing the IT budget for SMBs. Over half (53%) of respondents At least 1 year 6-12 months 3-6 months 1-3 months 2013 start planning only 6 months in advance when it is time to start spending. in advance in advance out from in advance And a quarter of respondents worldwide do not have any formal budget planning. 25% 9% Don’t know EMEA IT pros are only slightly more likely to plan do any at least 6 months in advance (59% vs. 53% of We do not budgets formal budget planning 22% worldwide IT pros). 9% Don’t know Worldwide EMEA IT Budget Planning When does your company start planning for next year’s budget? 6-12 months in advance 3-6 months 10% in advance 6% 27% 31% 2013 1-3 months in advance 26% 28% At least 1 year in advance 4% 5% Worldwide EMEA 25% We do not do any formal budget planning 22% We do not do any formal budget planning 9% Don’t know 9% Don’t know Worldwide EMEA Respondents: Worldwide (939) - EMEA (197) 5
  • 6.
    Does your companyhave a “use it or lose it” policy for your department’s annual budget? SMB IT SPENDING: HOW IT PROS ARE ALLOCATING AND MANAGING BUDGETS IN 2013 14% 23% 17% 27% Yes No Outside Factors Impacting IT Spend. Don’t know 63% 56% While IT pros do their best to develop a budget to meet their company’s needs, a variety of corporate policies or practices can impact how they go about managing and spending their budget throughout the Worldwide EMEA year. Two specific areas we asked about were the likelihood of getting additional budget during the year and whether or not their company supports a “use it or lose it” policy. The results show a good amount of IT departments anticipate receiving extra funds headed their way with nearly half your company have a “use itthey are it” policy for your department’s annual budget? year Does of respondents (45%) stating or lose likely to receive additional budget throughout the worldwide and 42% in EMEA. Worldwide 63% Likelihood of Receiving Additional Budget During Year 23% 14% EMEA How likely is it that your department will receive additional budget throughout the year? 56% 27% 17% Very likely 11% Yes 13%No Don’t know 10% 11% Somewhat likely 9% 45% 42% 12% Neither 32% 31% 19% Likely to receive 21% Likely to receive Not very likely additional budget additional budget Does your company have a “use it or lose it” policy for your department’s annual budget? 17% 16% Not at all likely Worldwide Don’t know Worldwide EMEA 23% 63% 14% Respondents: Worldwide (938) - EMEA (200) EMEA 27% 56% 17% Only 23% of respondents have a “use it or lose it” policy and need to make sure all dollars are unloaded by year end. EMEA shows similar results with 27% having a “use it or lose it” policy. Yes No Don’t know “Use it or Lose it” Budget Policy “ Does your company have a “use it or lose it” policy FROM THE COMMUNITY for your department’s annual budget? I’ve found that the budget Worldwide process is an ongoing process 23% EMEA 63% 14% not a once a year event. Birdra IT Manager “ community.spiceworks.com 27% 56% 17% Yes No Don’t know Respondents: Worldwide (937) - EMEA (196) 6
  • 7.
    SMB IT SPENDING:HOW IT PROS ARE ALLOCATING AND MANAGING BUDGETS IN 2013 Survey Methodology The results in this report are from a recent Voice of IT® survey conducted with 942 SMB IT pros worldwide from companies with less than 1000 employees. Nearly two-thirds of respondents are from North America and close to a quarter are from EMEA. By company size, over half (54%) are from companies with less than 100 employees. Company Size Region Latin America 250+ Asia employees Pacific 4% 17% 1-19 employees 11% North 19% EMEA America 29% 23% 48% 63% 100-249 employees 35% 20-99 employees About Spiceworks Voice of IT® The Spiceworks Voice of IT® market Insights program publishes stats, trends and opinions collected from small and medium business technology professionals that are among the more than 2M users of Spiceworks. Survey panelists opt-in to answer questions on technology trends important to them. About Spiceworks Spiceworks™ the world’s largest social business platform for IT, connects 2 million IT professionals with more , than 1,200 technology brands. By combining a Facebook-like community with free IT management software, Spiceworks helps businesses to discover, buy and manage $350 billion worth of technology products and services each year. To learn more, visit: Be first to hear about Spiceworks Voice of IT® insights, email: http://www.spiceworks.com/voice-of-it marketresearch@spiceworks.com The contents in this report are a result of primary research performed by Spiceworks. Unless otherwise noted, the entire contents distributed as part of this report are copyrighted by Spiceworks. As such any information made available by any means in this report may not be copied, reproduced, duplicated, published, displayed, transmitted, distributed, given, sold, traded, resold, marketed, offered for sale, modified to create derivative works or otherwise exploited for valuable consideration without prior written consent by Spiceworks. For more information visit www.spiceworks.com/voice-of-it/terms. This report contains information of fact relating to parties other than Spiceworks. Although the information have been obtained from, and are based on sources that Spiceworks believes to be reliable, Spiceworks does not guarantee the accuracy, and any such information might be incomplete or condensed. Any estimates included in this report constitute Spiceworks’ judgment as of the date of compilation, and are subject to change without notice. This report is for information purposes only. All responsibility for any interpretations or actions based on the information or commentary contained within this report lie solely with the recipient. All rights reserved. 2012. 7