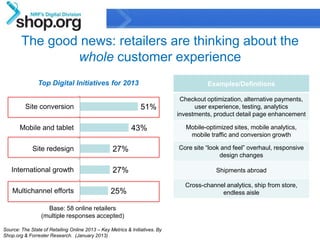
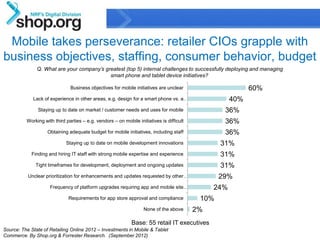
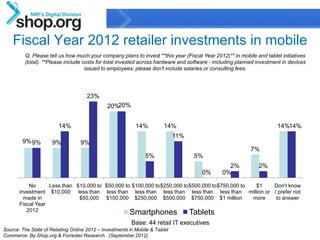
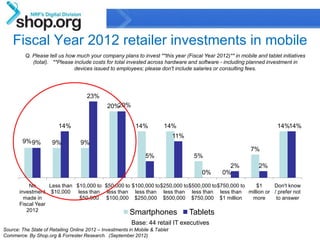
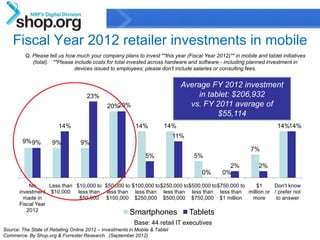
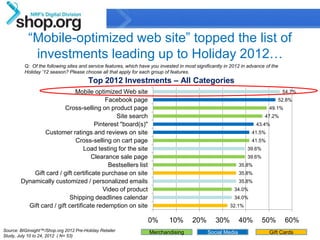
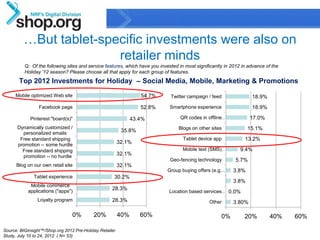
This document discusses retailers' tablet investments and challenges in 2012. It finds that the average planned investment in tablets for fiscal year 2012 was $206,932, up from $55,114 in 2011. The top internal challenges for mobile initiatives were unclear business objectives and lack of mobile experience. A mobile-optimized website was the most common investment made by retailers in 2012 in preparation for the holiday season.

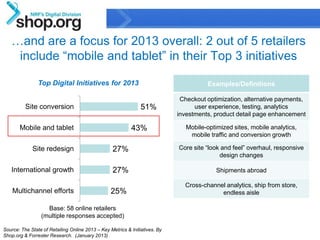
![Millennials led in tapping tablets for coupons, using /
buying gift cards, watching product videos
Q: How did you use your Tablet Device for any part of your 2012 holiday shopping? (Tablet device owners) (cont.) [For additional
answers, please see Appendix Slide 70.]
80%
60%
40%
20% 17.6%
14.9%
10.5% 8.3% 8.6%
6.7% 6.3% 5.6% 5.2% 7.2%
4.5% 3.7% 5.0% 3.5%
0%
Searched for Redeemed Redeemed a gift Looked up a gift Bought a gift card Used apps to Watched a
coupons or coupons card registry or wish list research or product video
discounts purchase products
specifically when I
was in the store
Adults 18+ Men Women 18-34 35-54 55+
Source: BIGinsight™/Shop.org Post-Holiday Consumer
16
Study, Dec. 27, 2012 to Jan. 9, 2013 (N= 1,919) Confidential & Proprietary](https://image.slidesharecdn.com/businsiderfeb2013-fswerdlowtablets-130206082555-phpapp01/85/Business-Insider-Social-Commerce-Summit-Fiona-Swerdlow-16-320.jpg)