Download to read offline
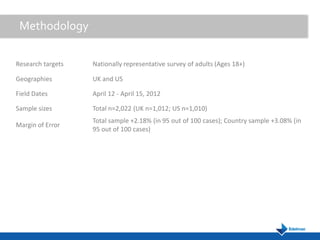

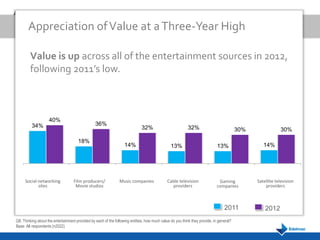

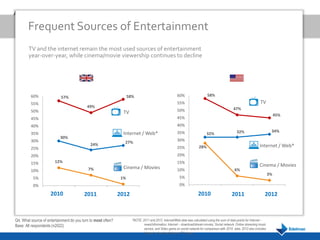

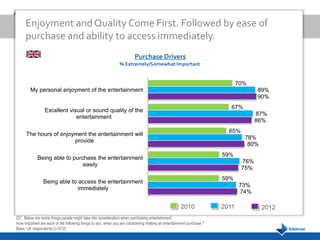
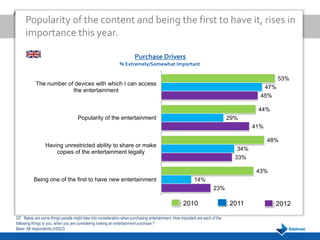
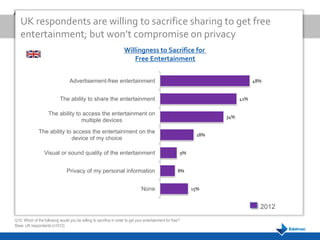

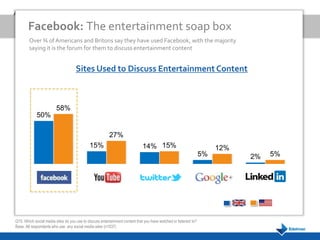
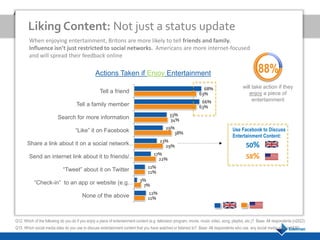
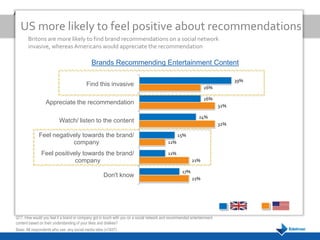
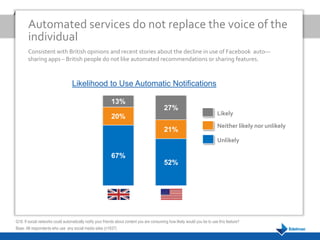

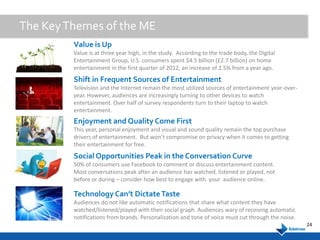


A survey conducted in April 2012 with over 2,000 adults in the UK and US shows a three-year high in the perceived value of entertainment across various sources, particularly television and the internet. The study highlights that enjoyment and quality are the primary factors influencing entertainment purchases, with a notable shift towards utilizing multiple devices for viewing. Additionally, while social media platforms like Facebook are popular for discussing entertainment, audiences express a preference against automated notifications about their consumption.


![[Cimigo VN] Net citizens Việt Nam -2012](https://cdn.slidesharecdn.com/ss_thumbnails/cimigo-netcitizens-2012-120617013354-phpapp02-thumbnail.jpg?width=640&height=640&fit=bounds)


