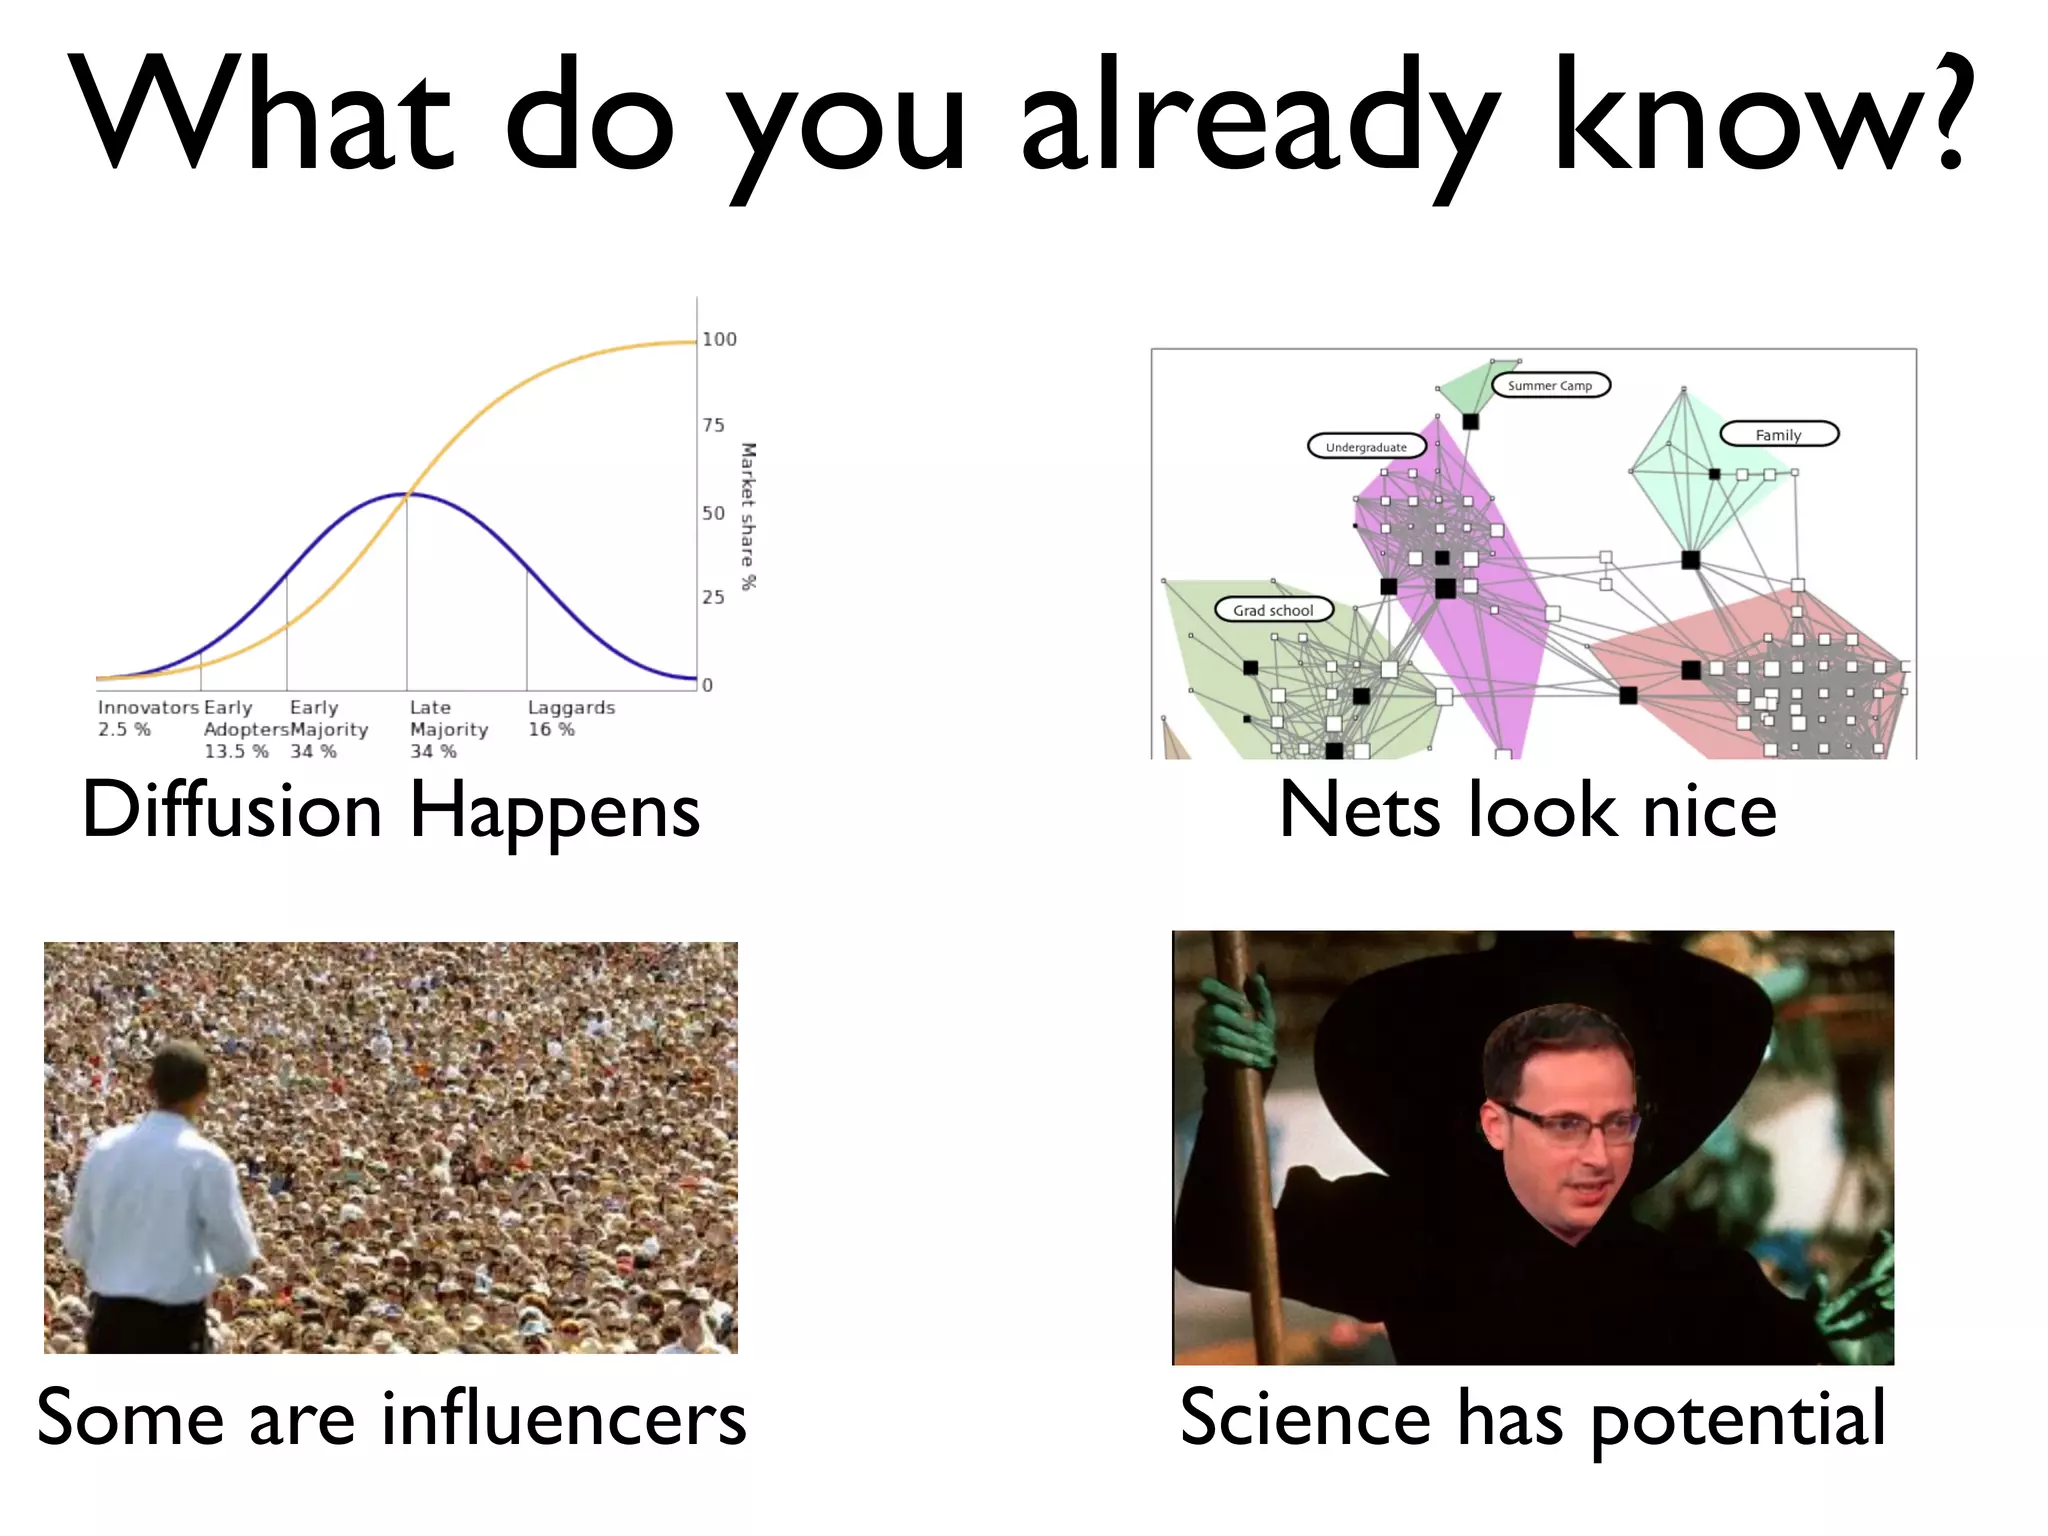
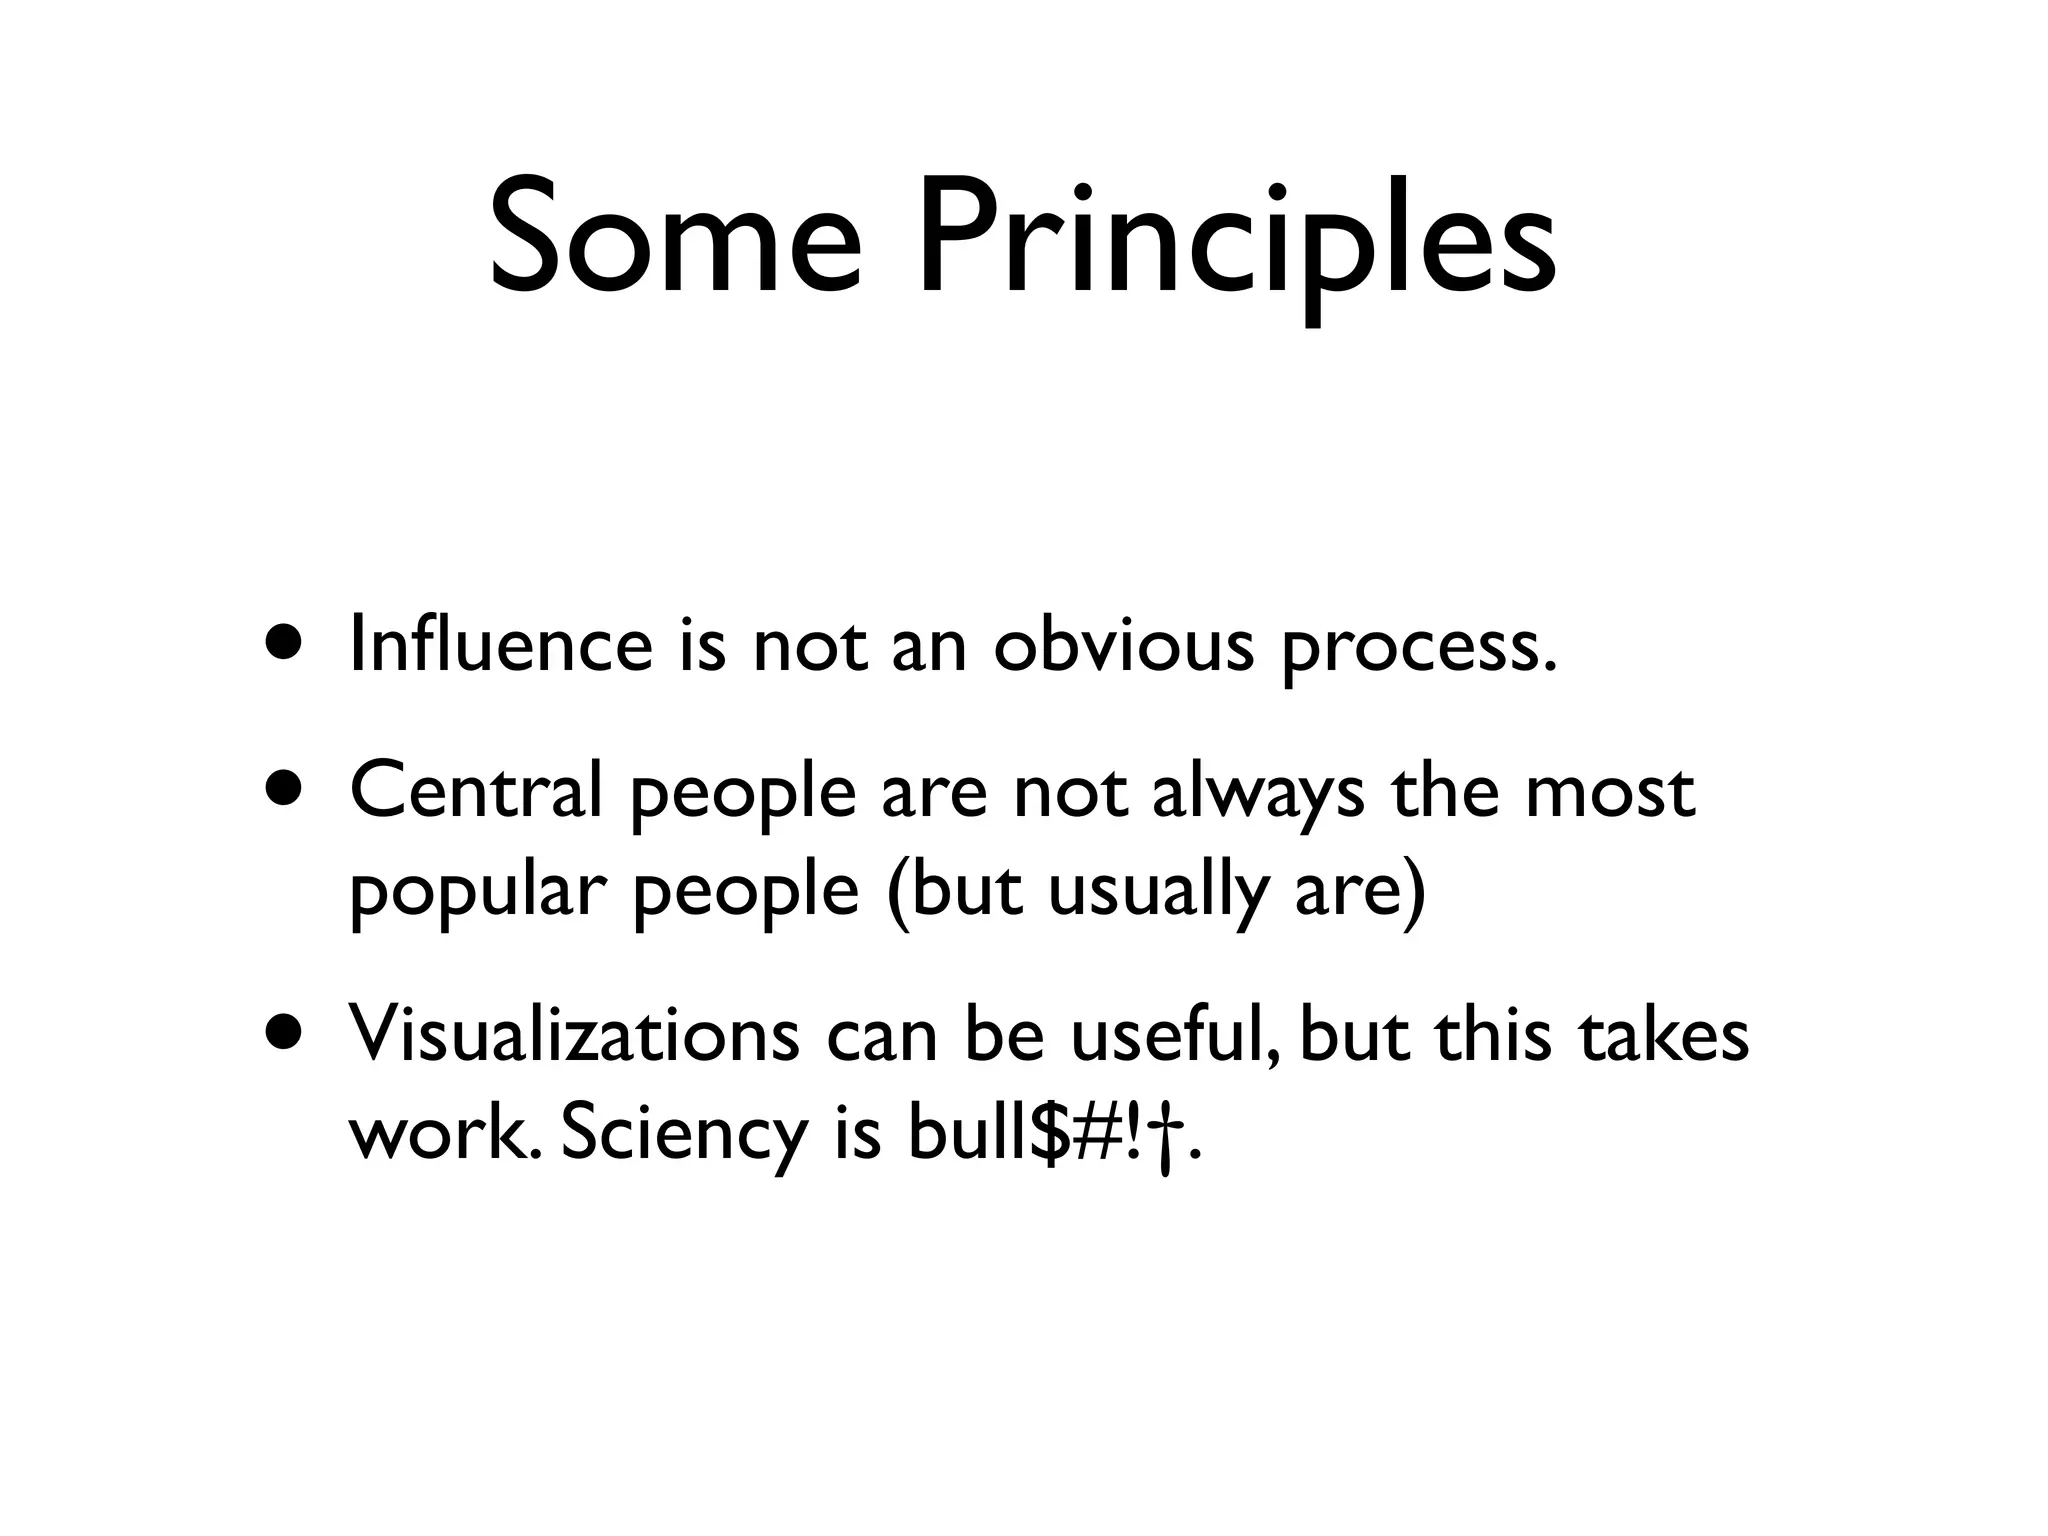
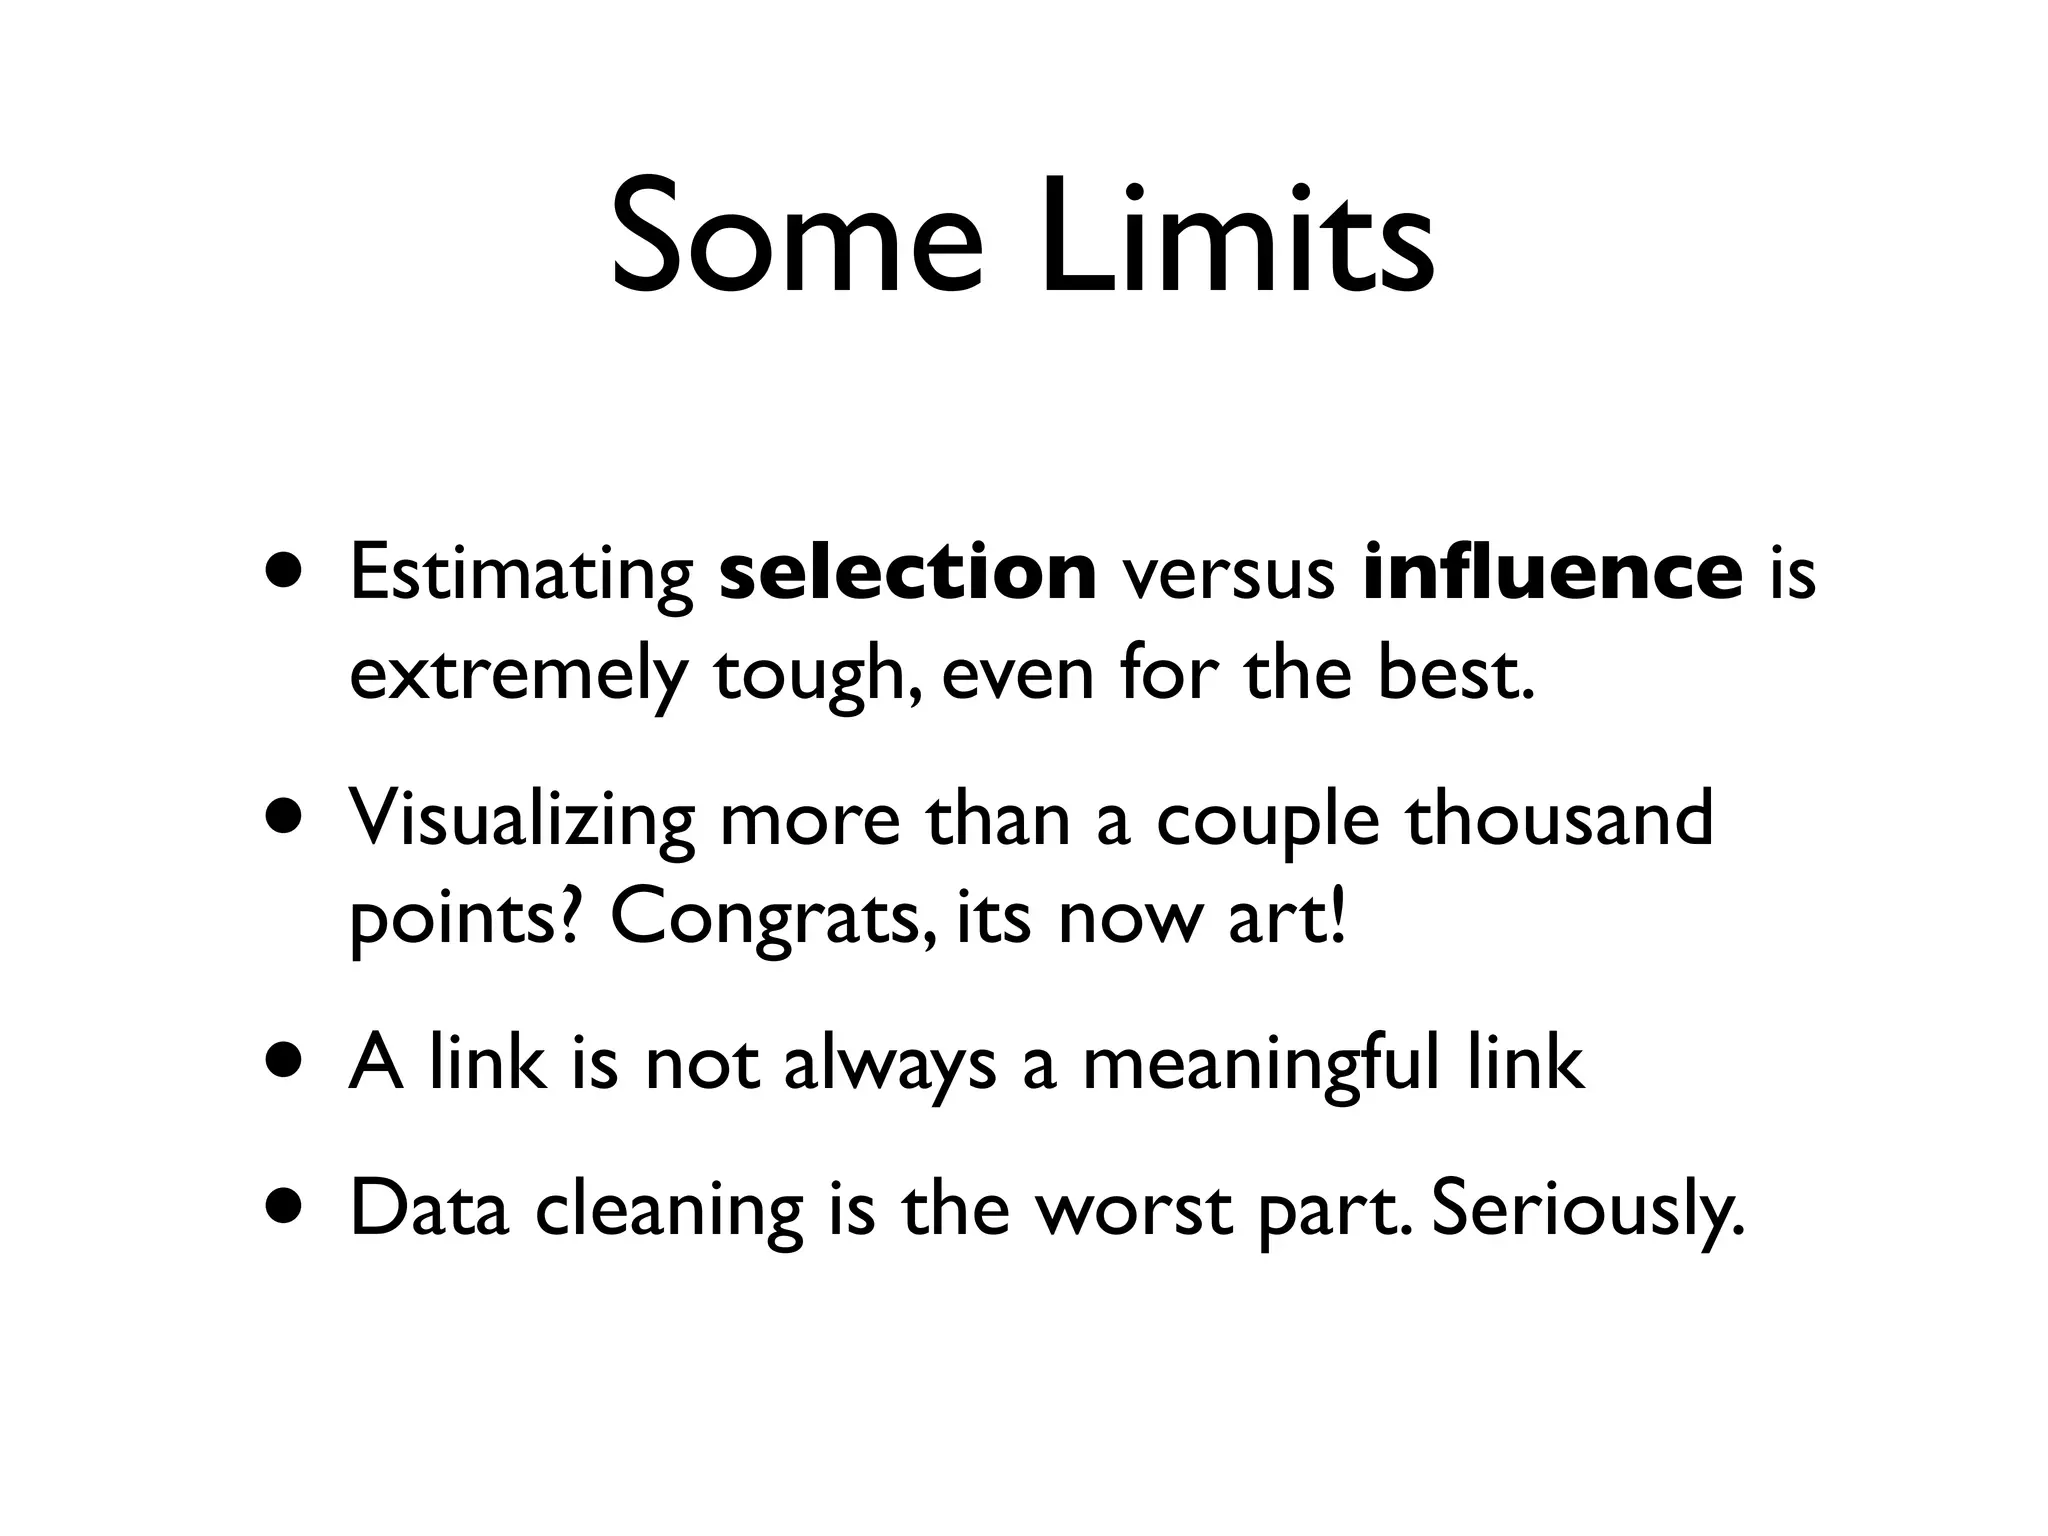
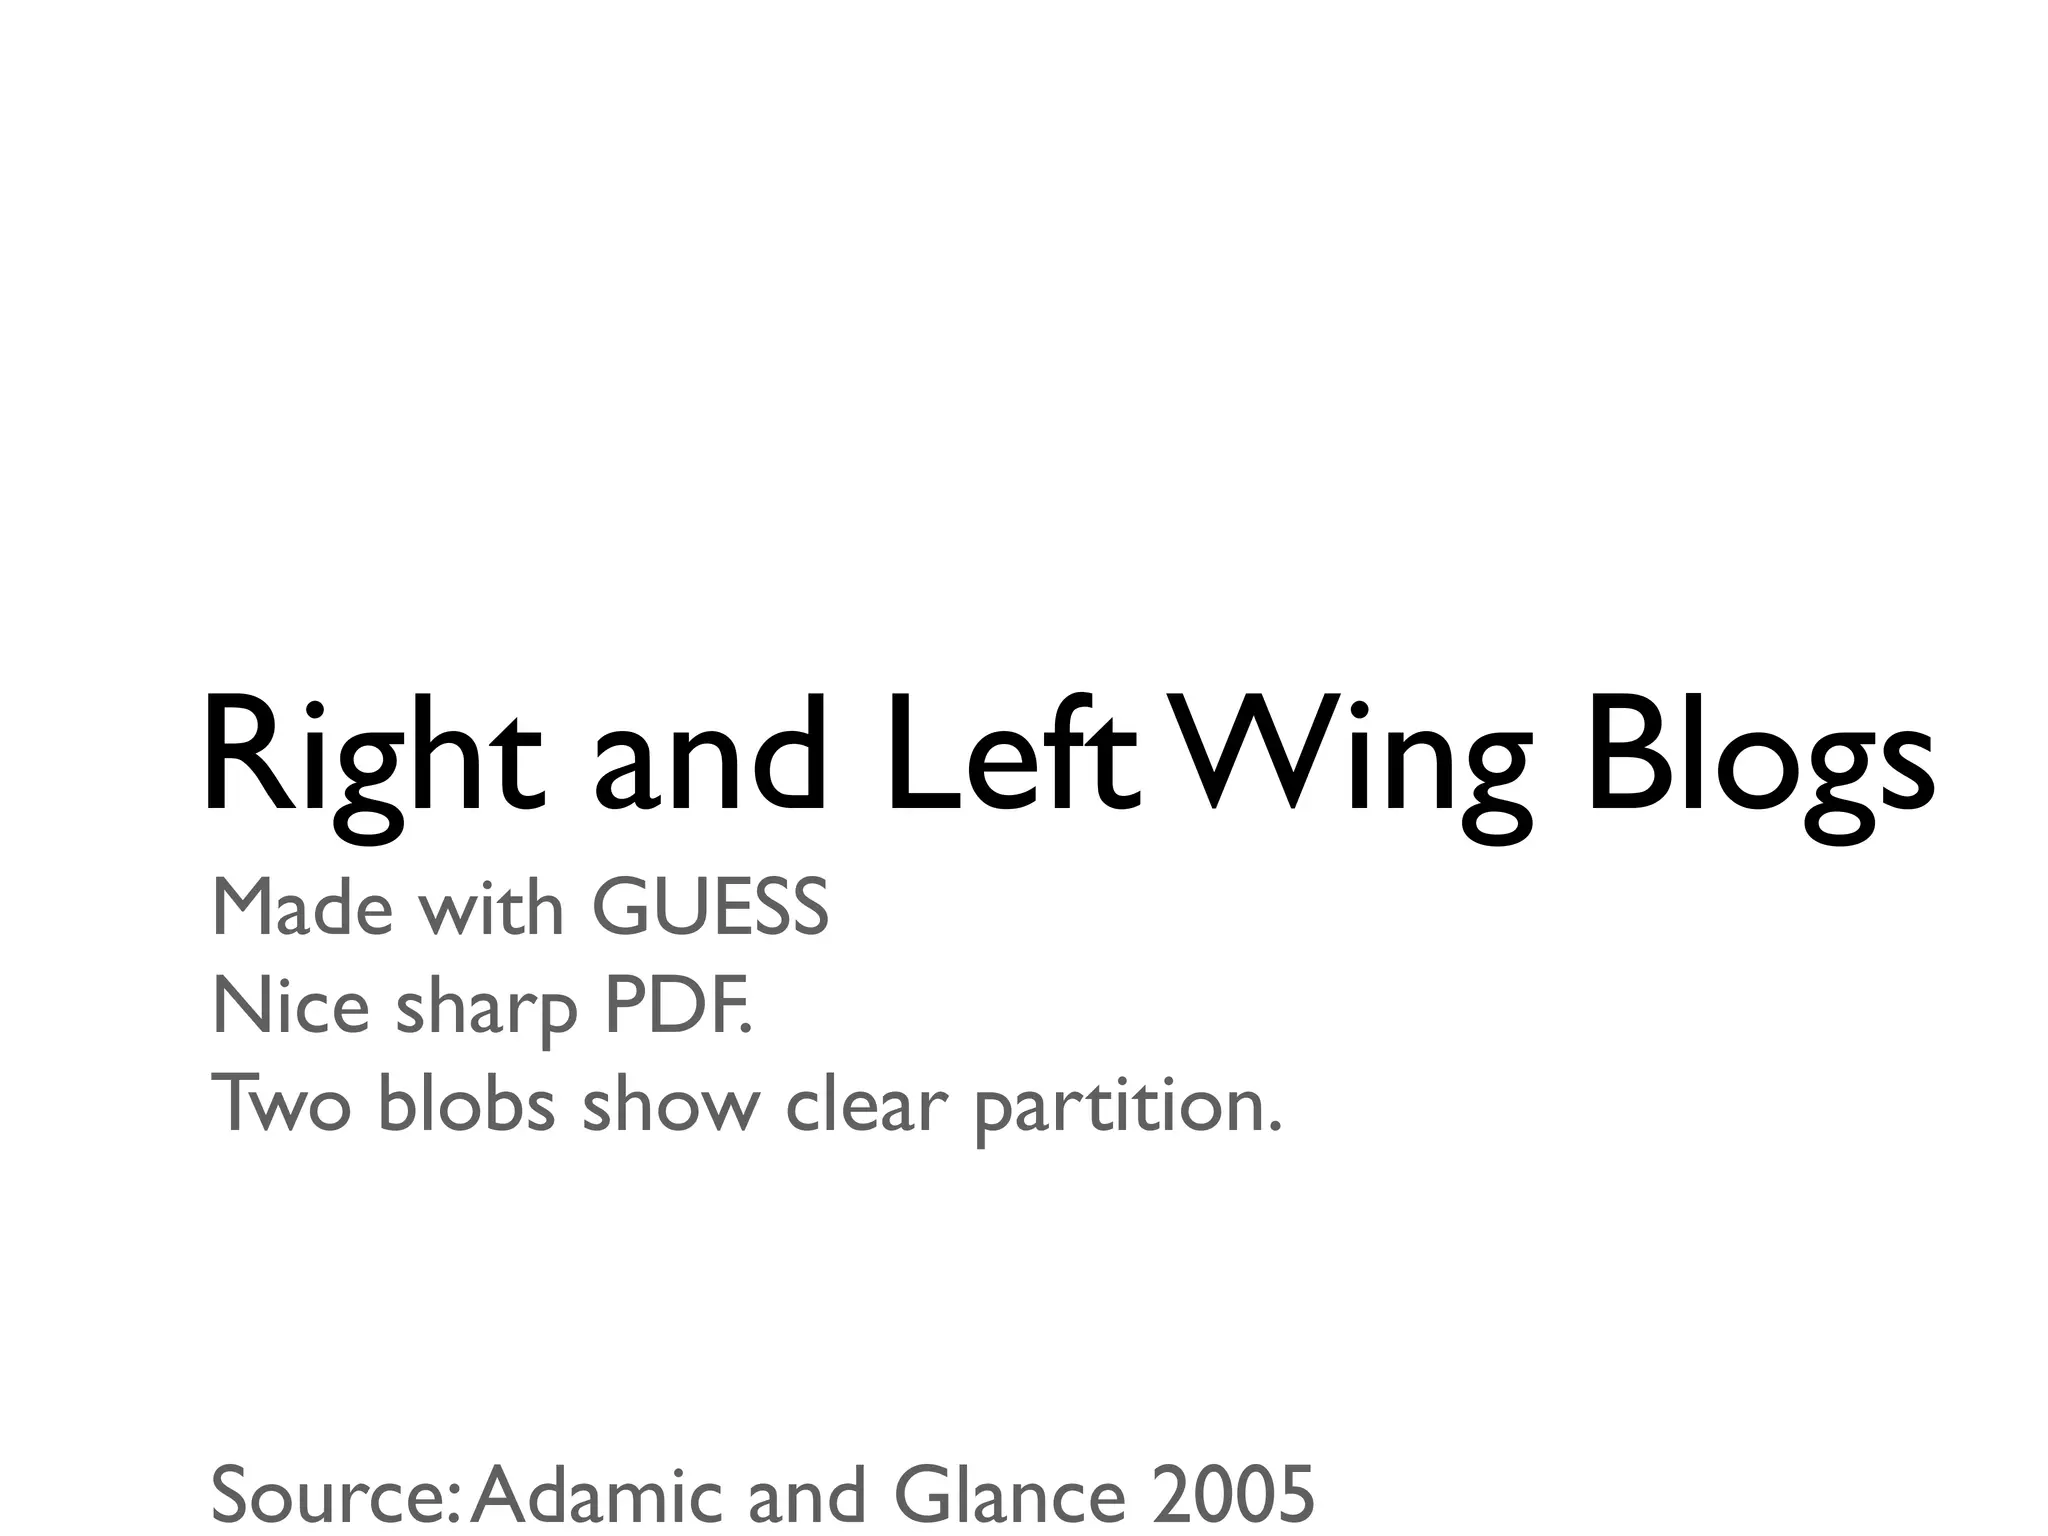
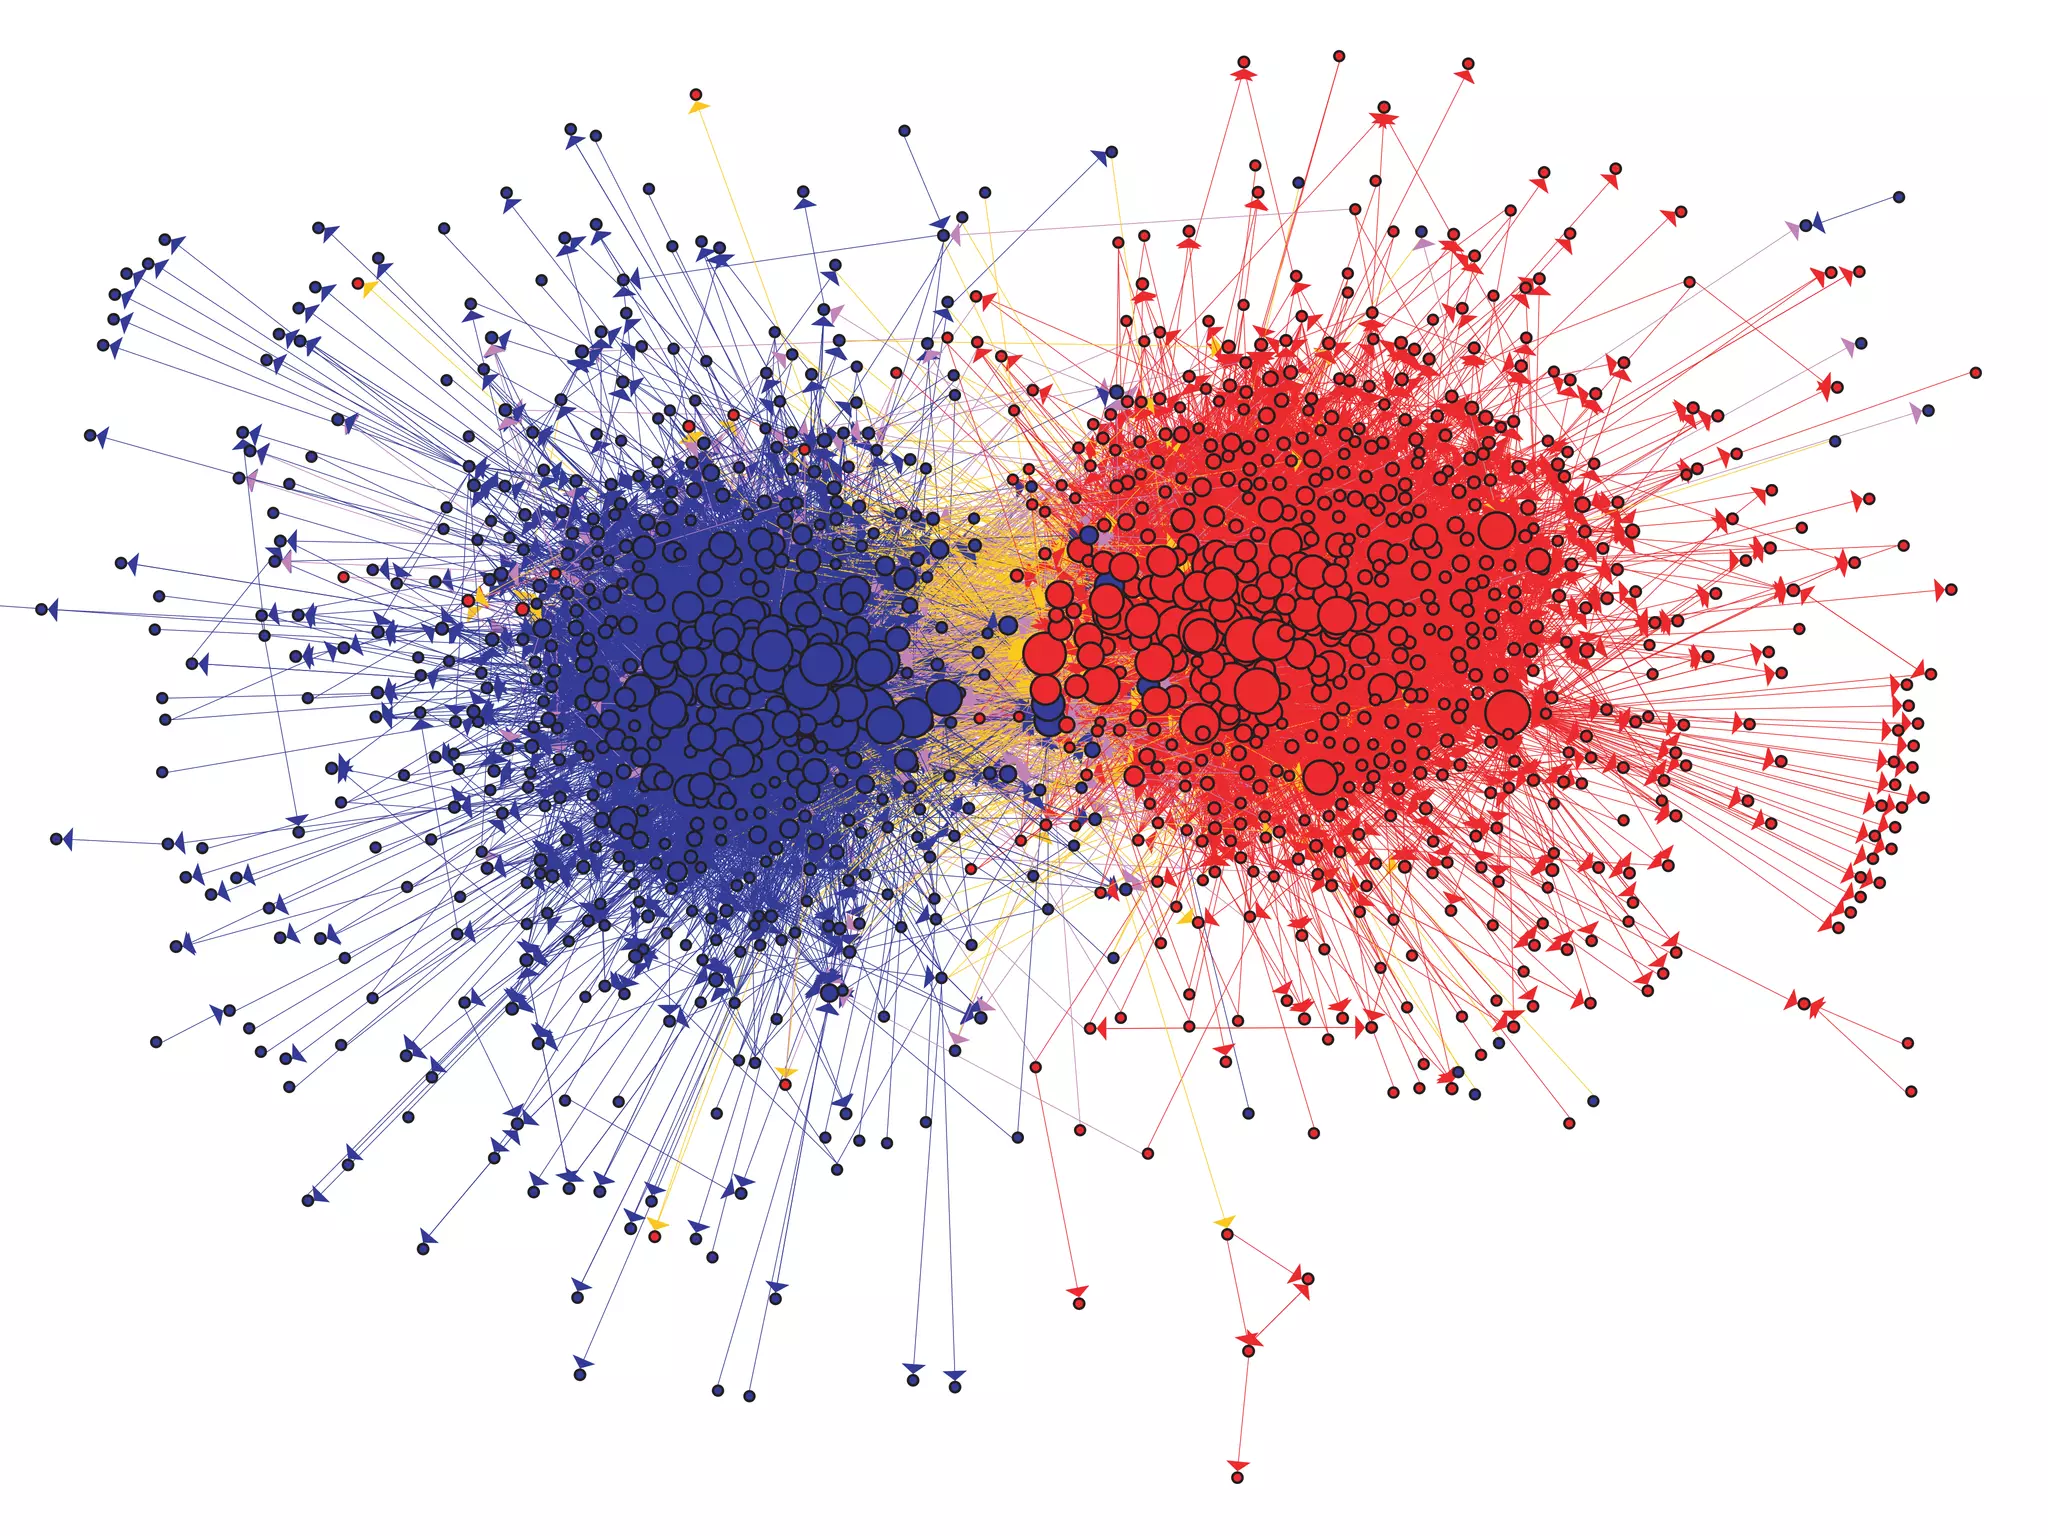
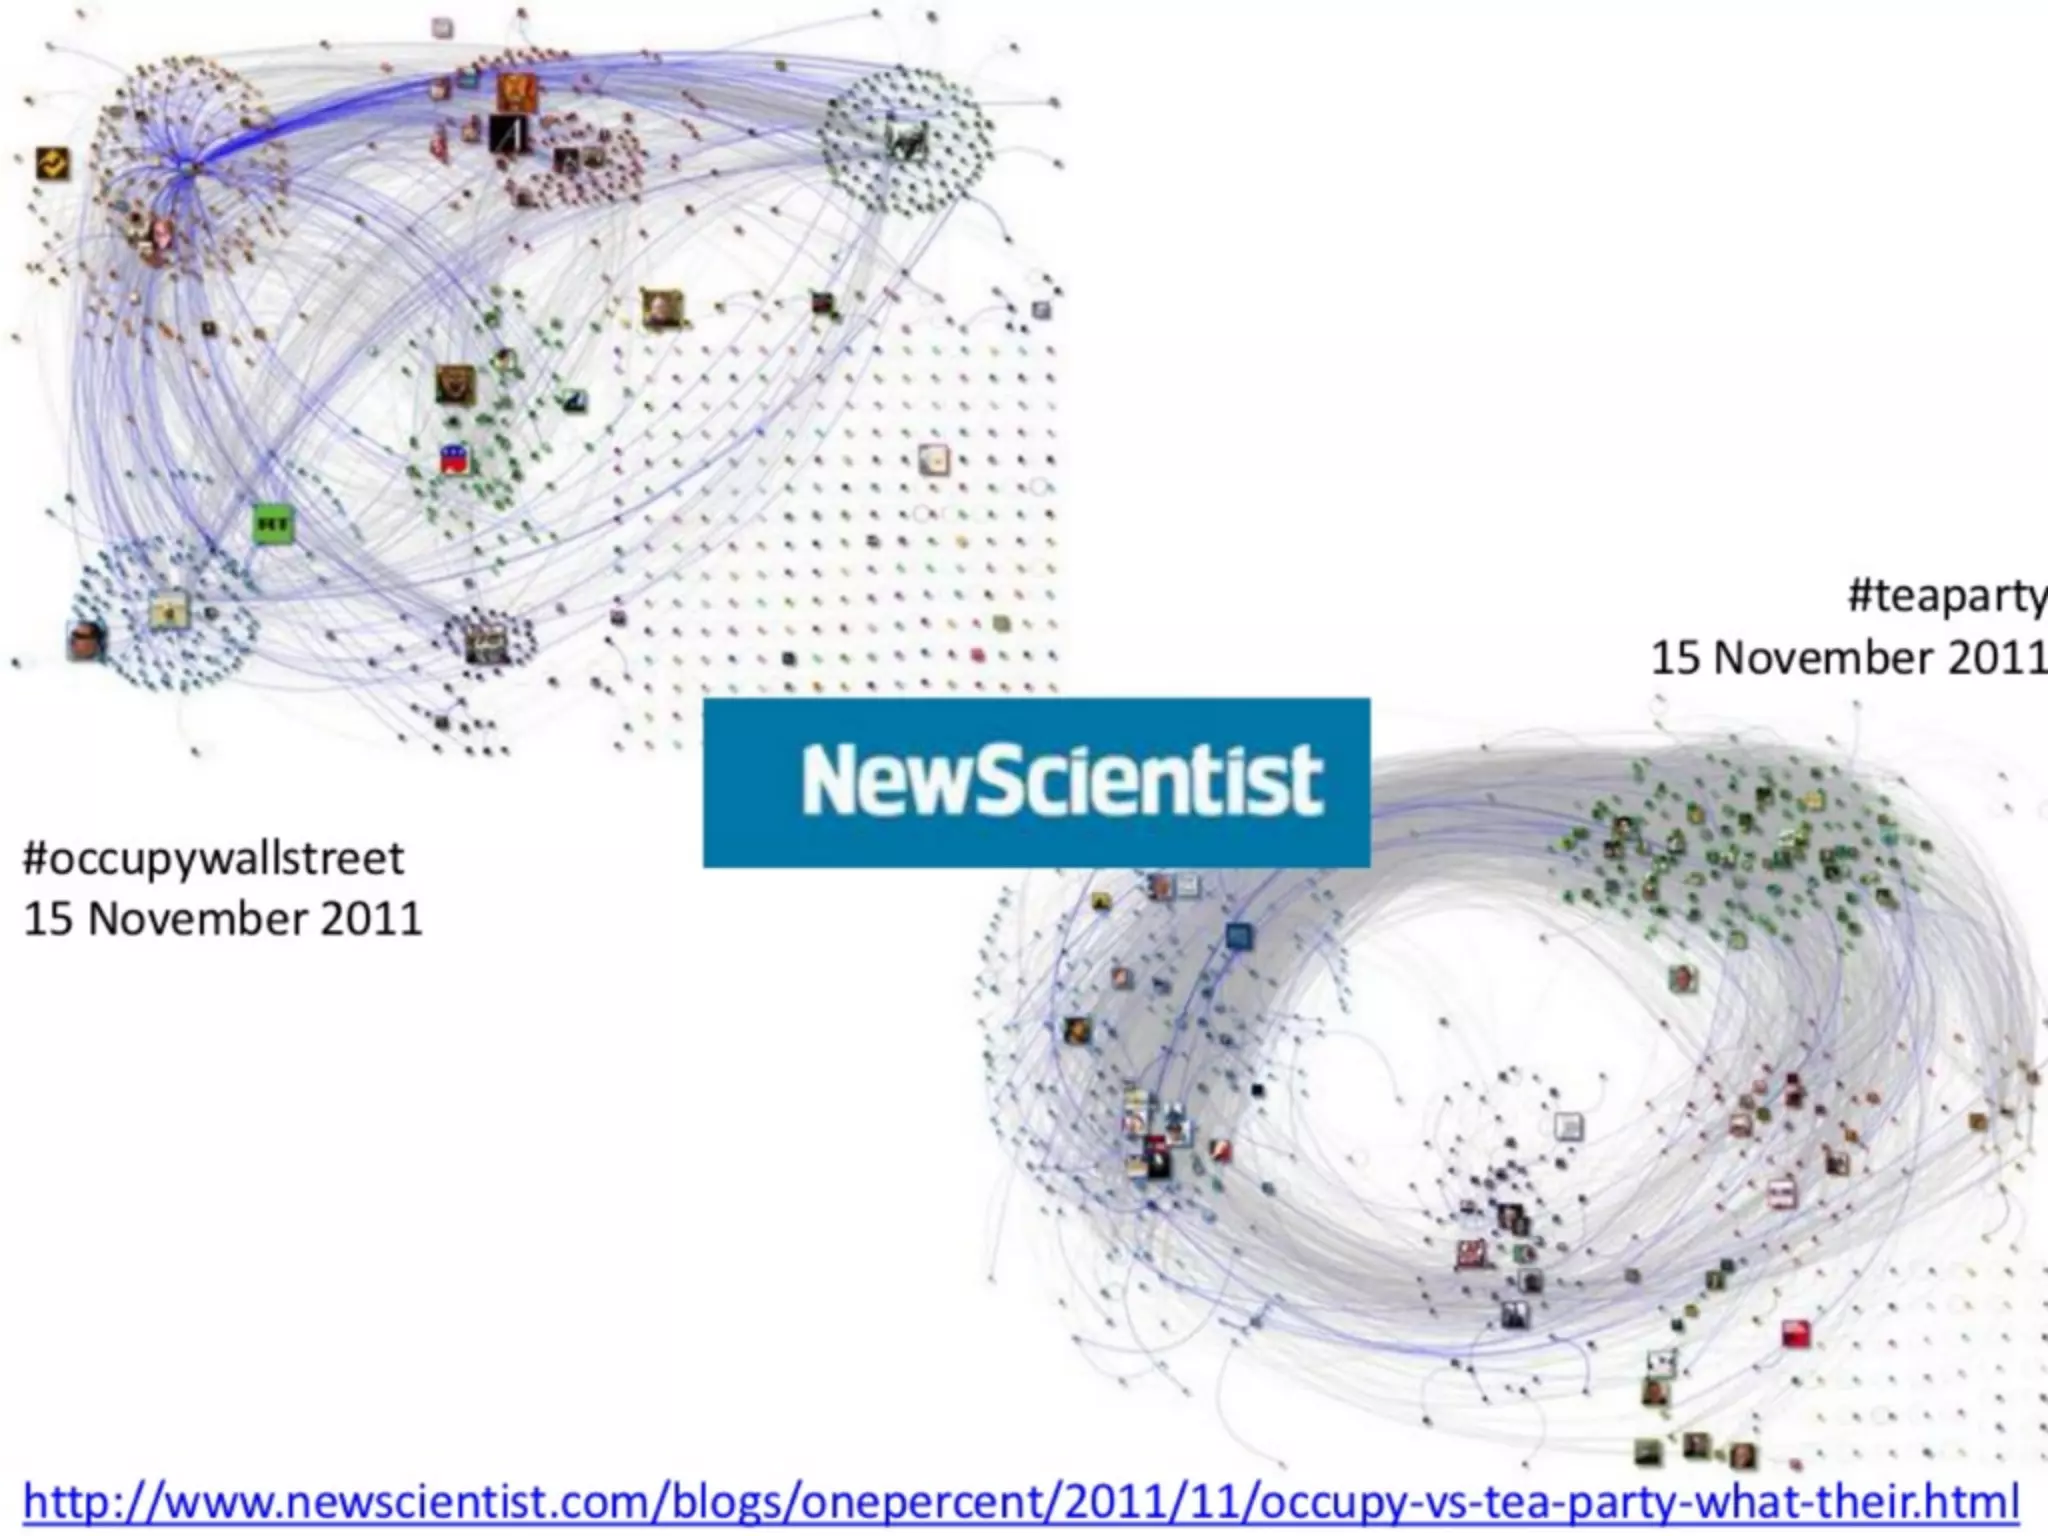
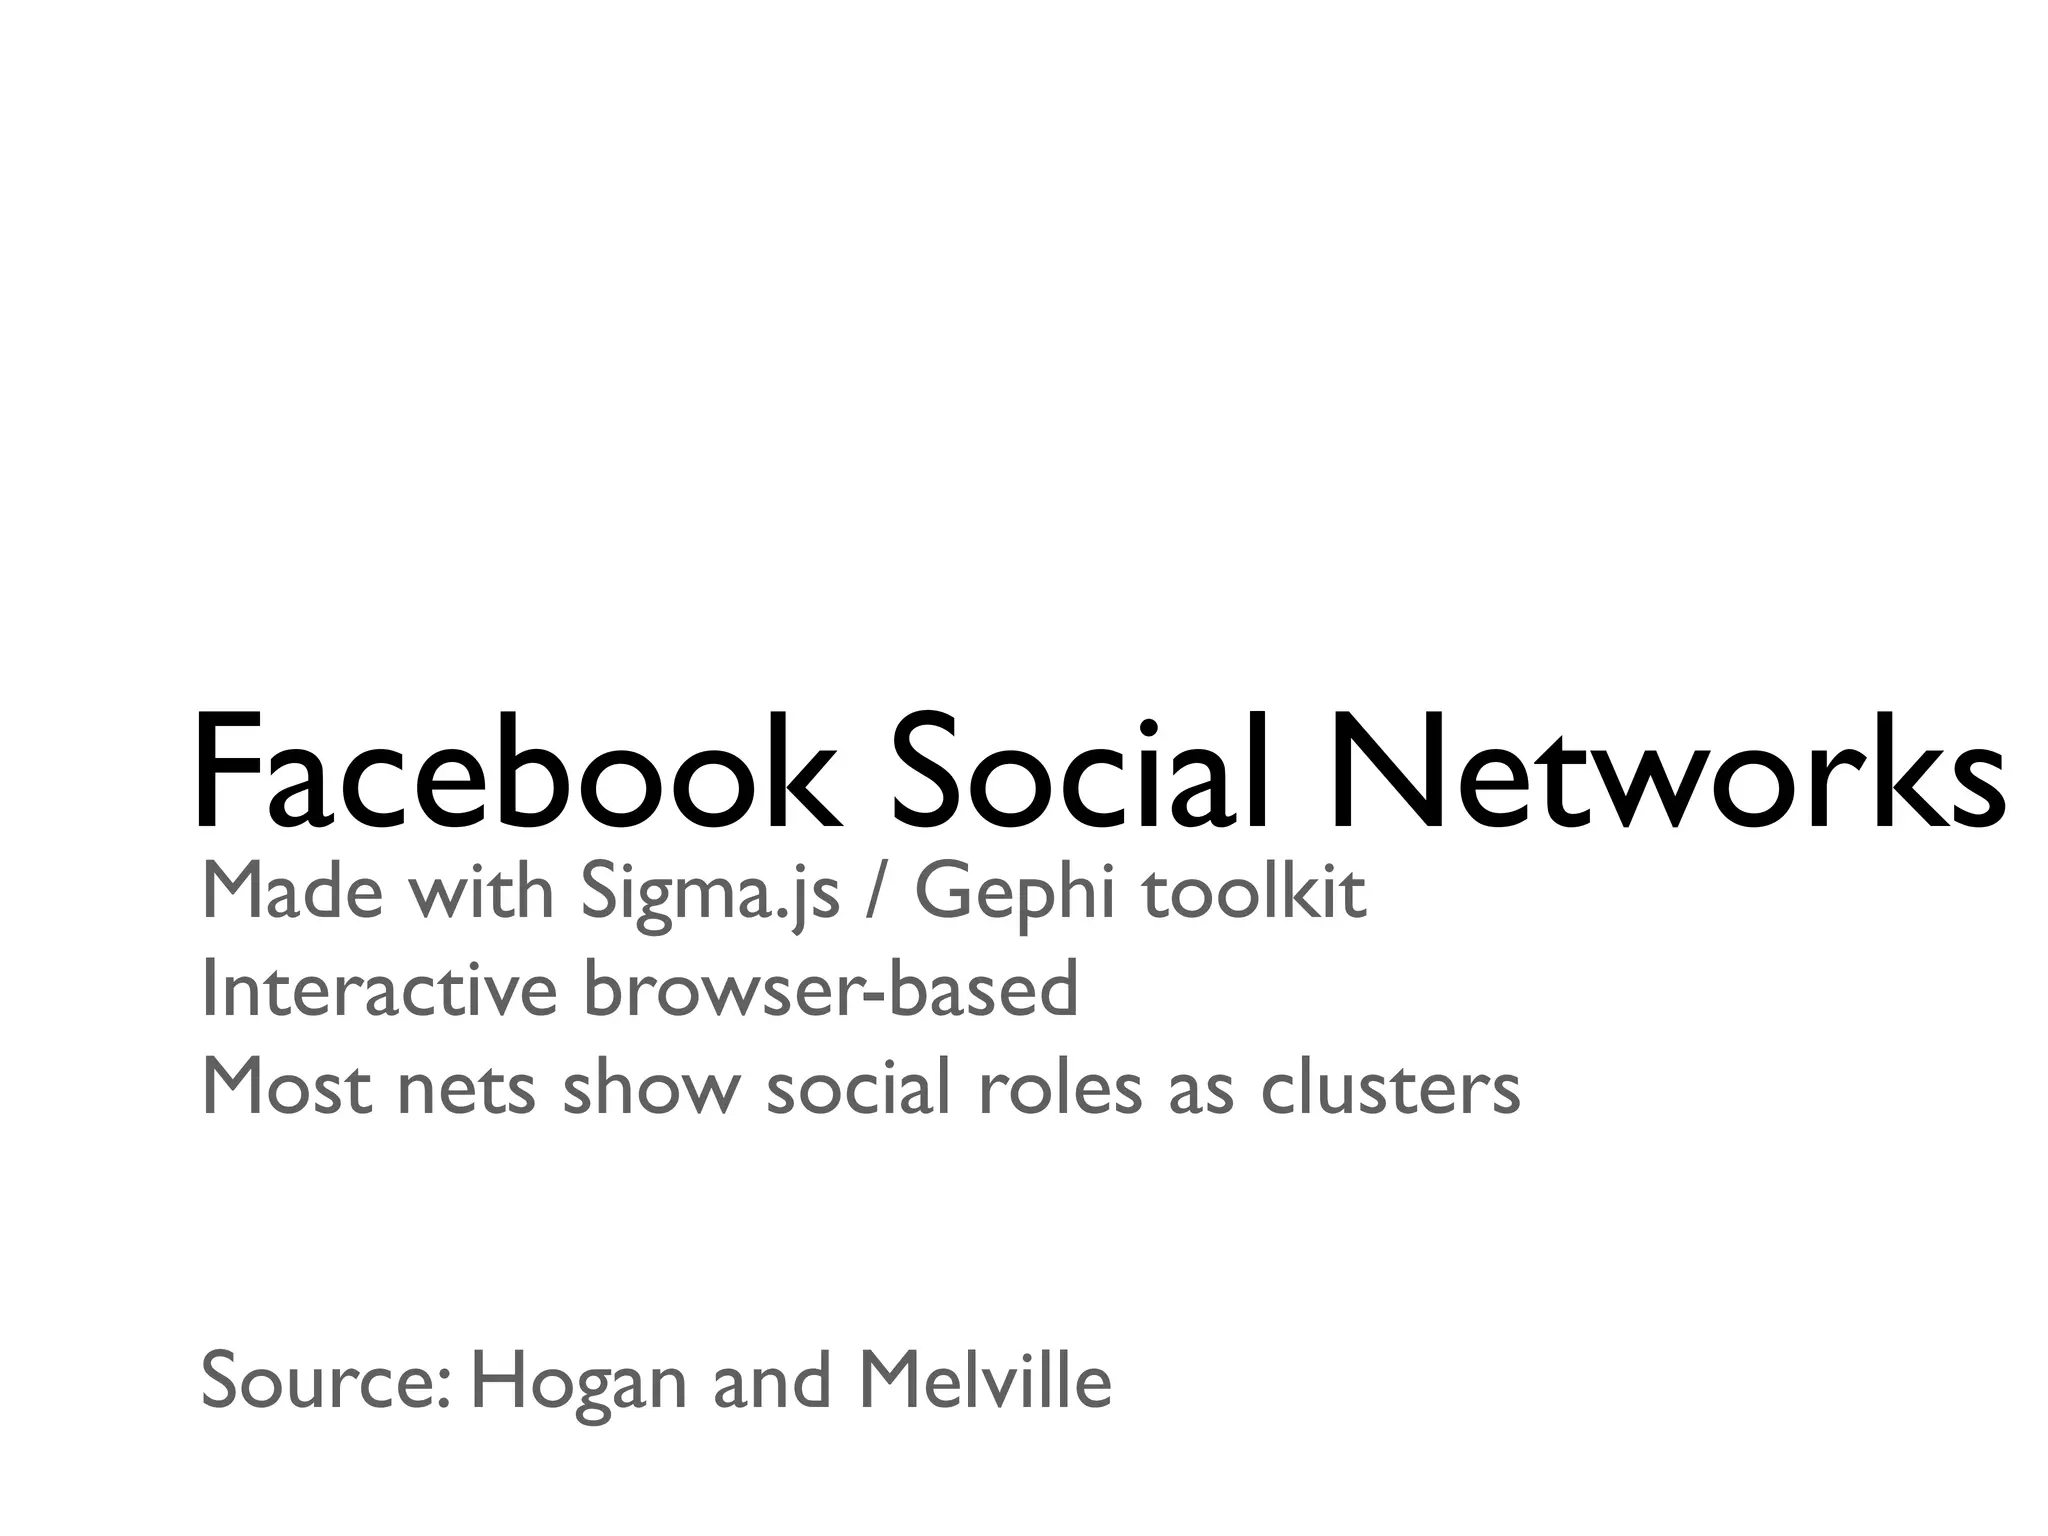
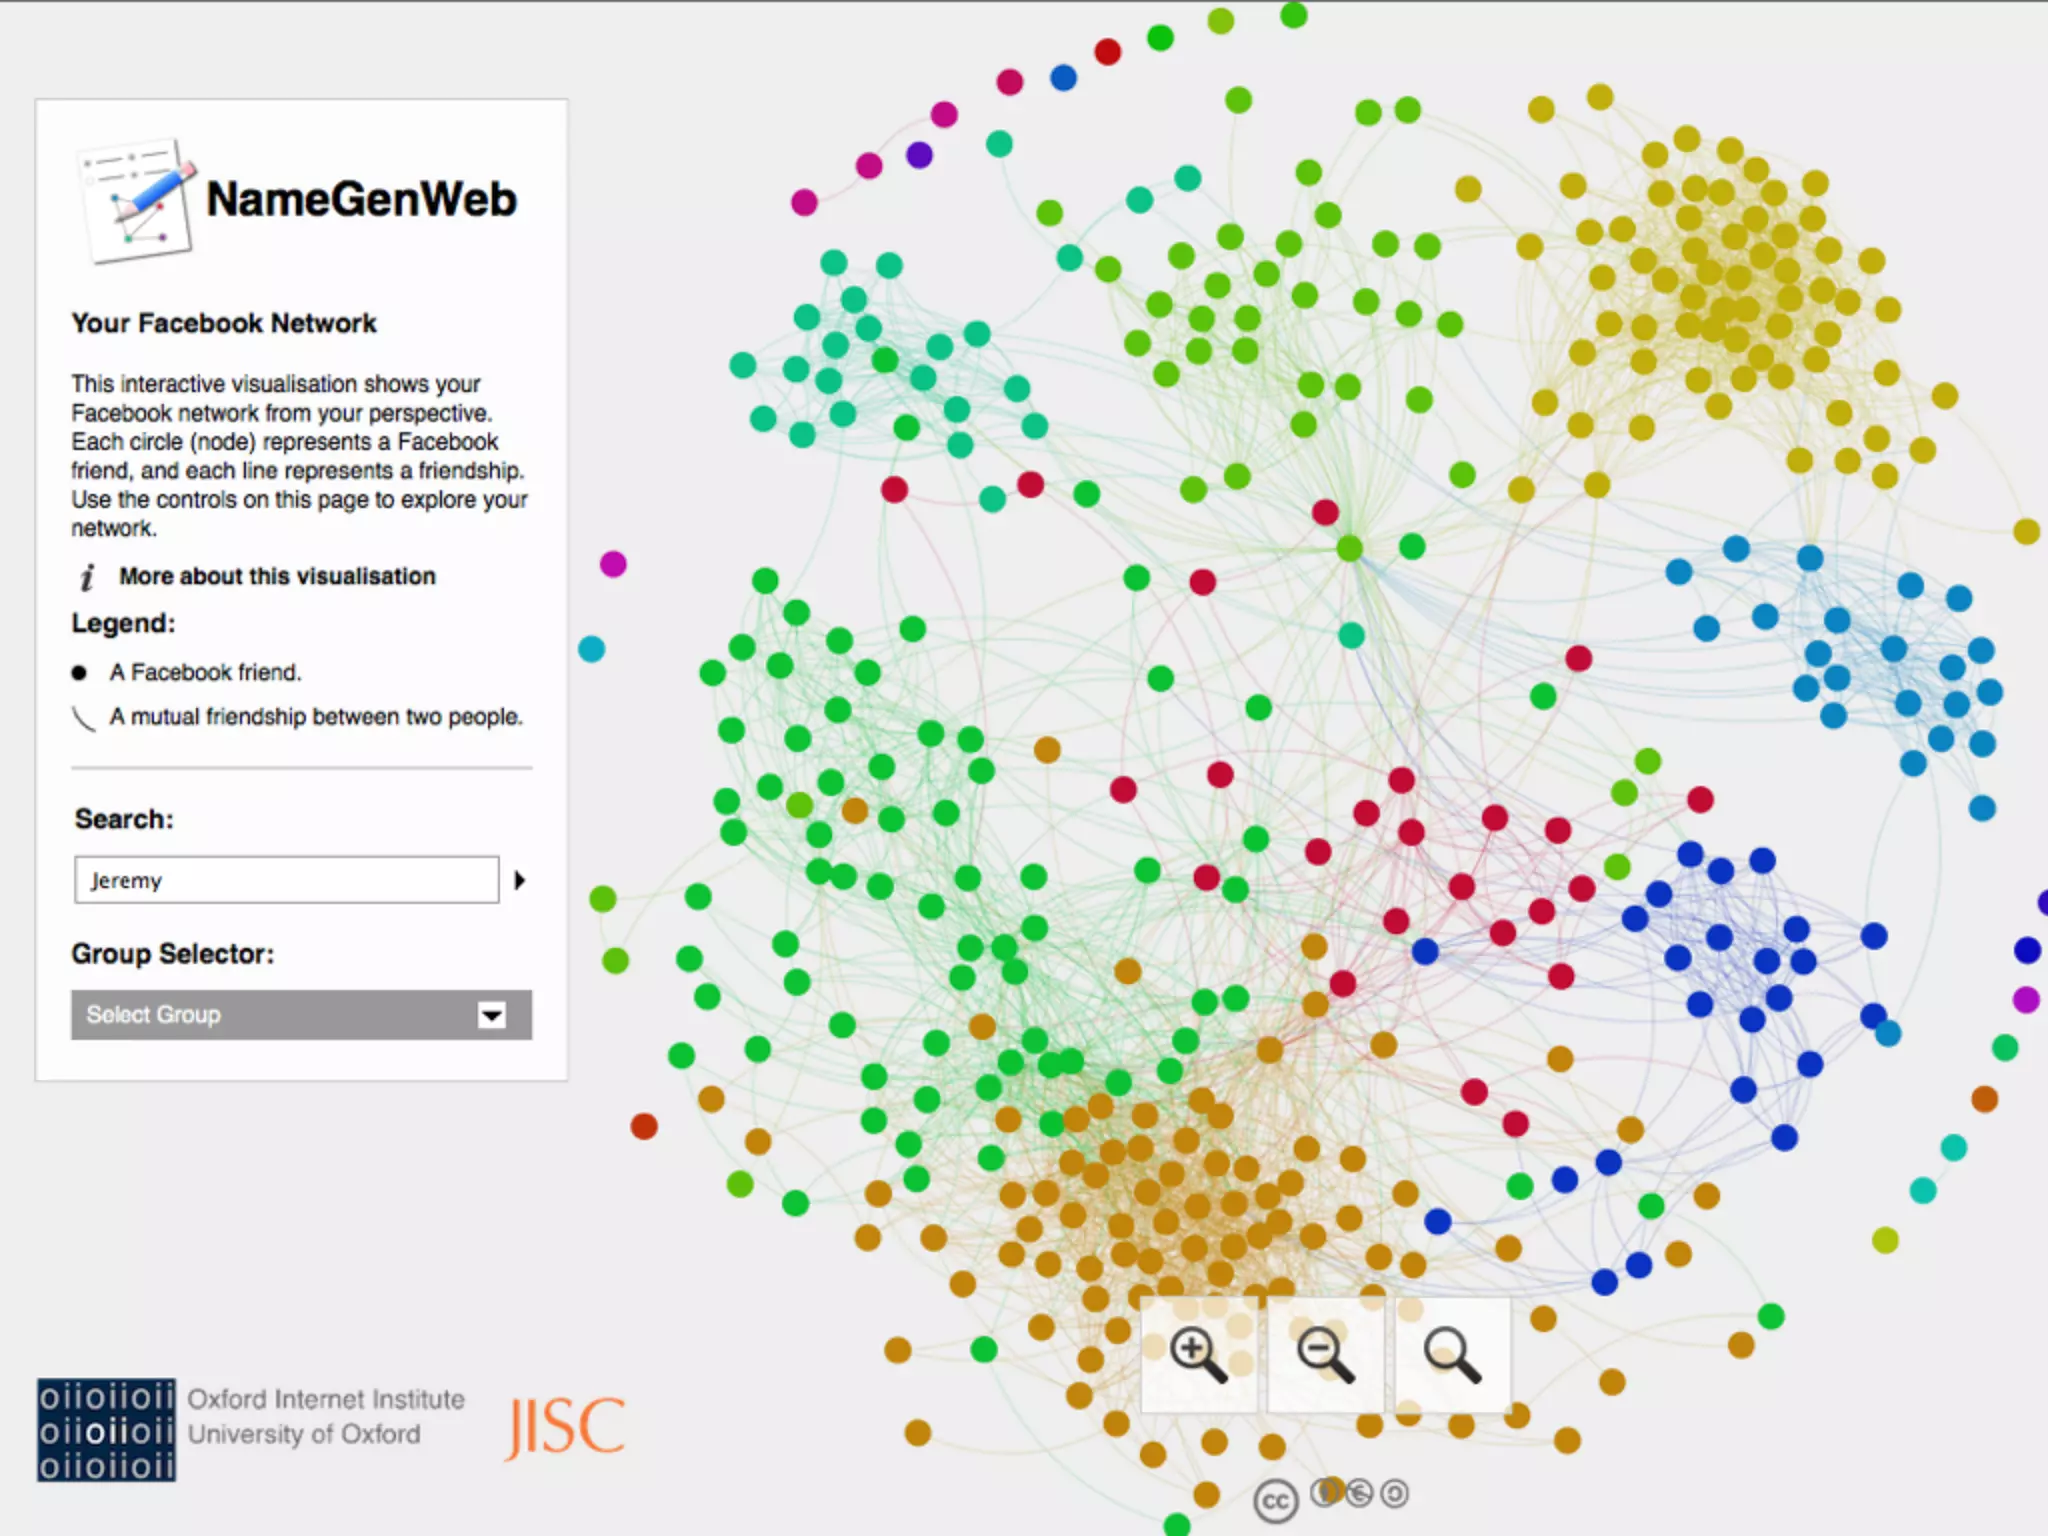
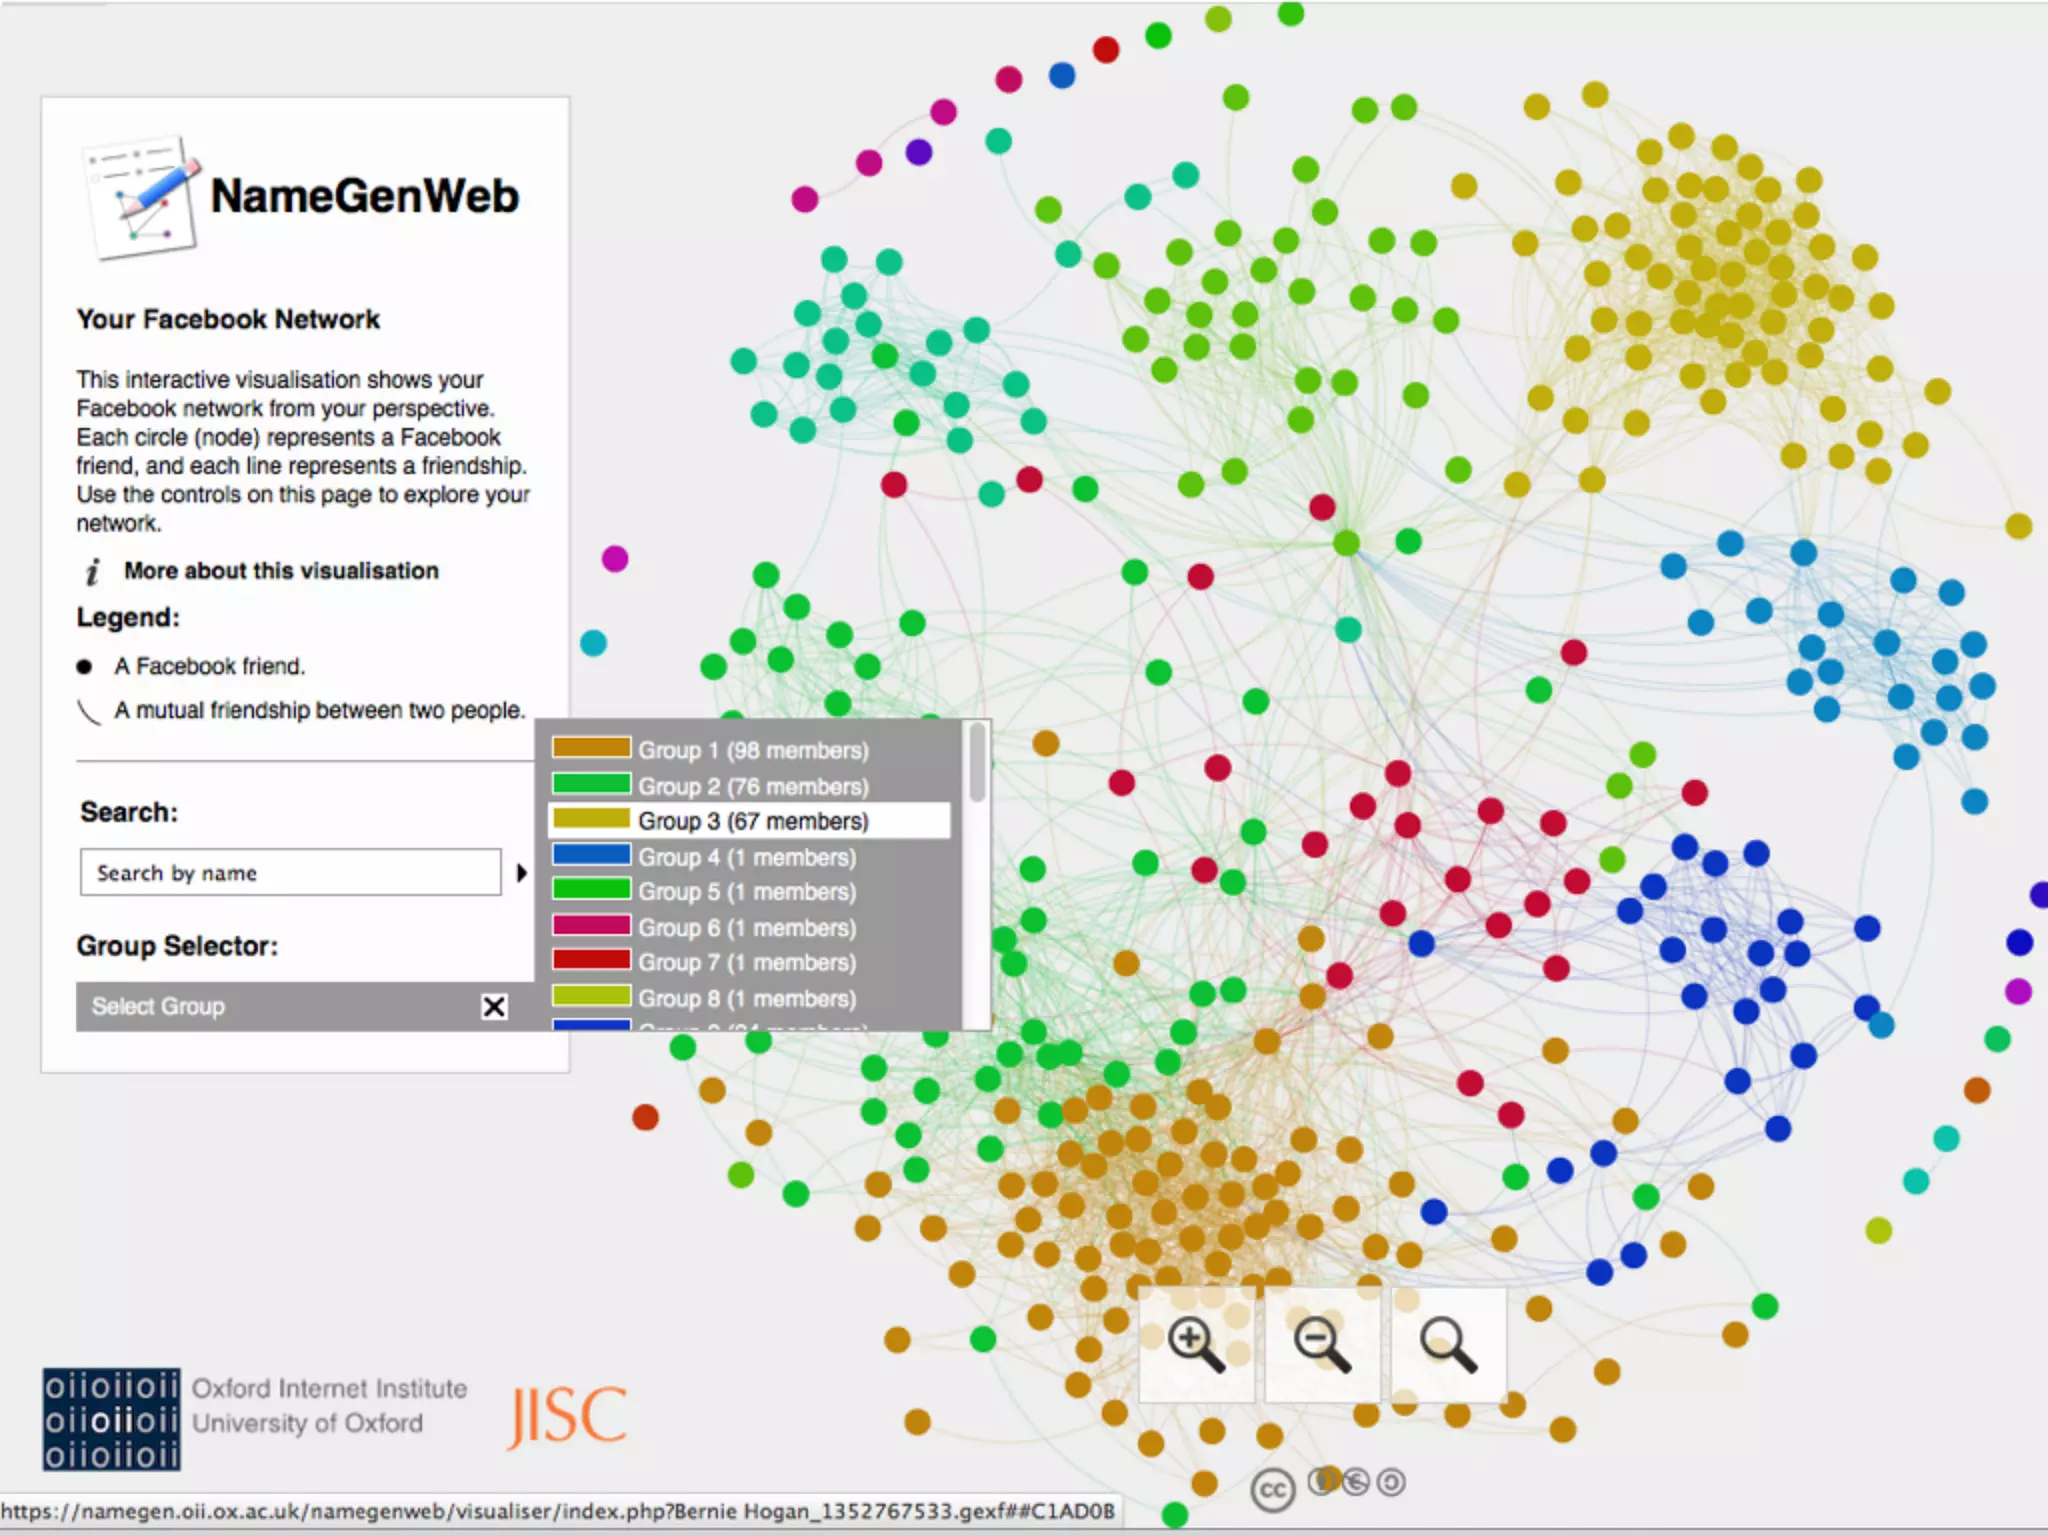
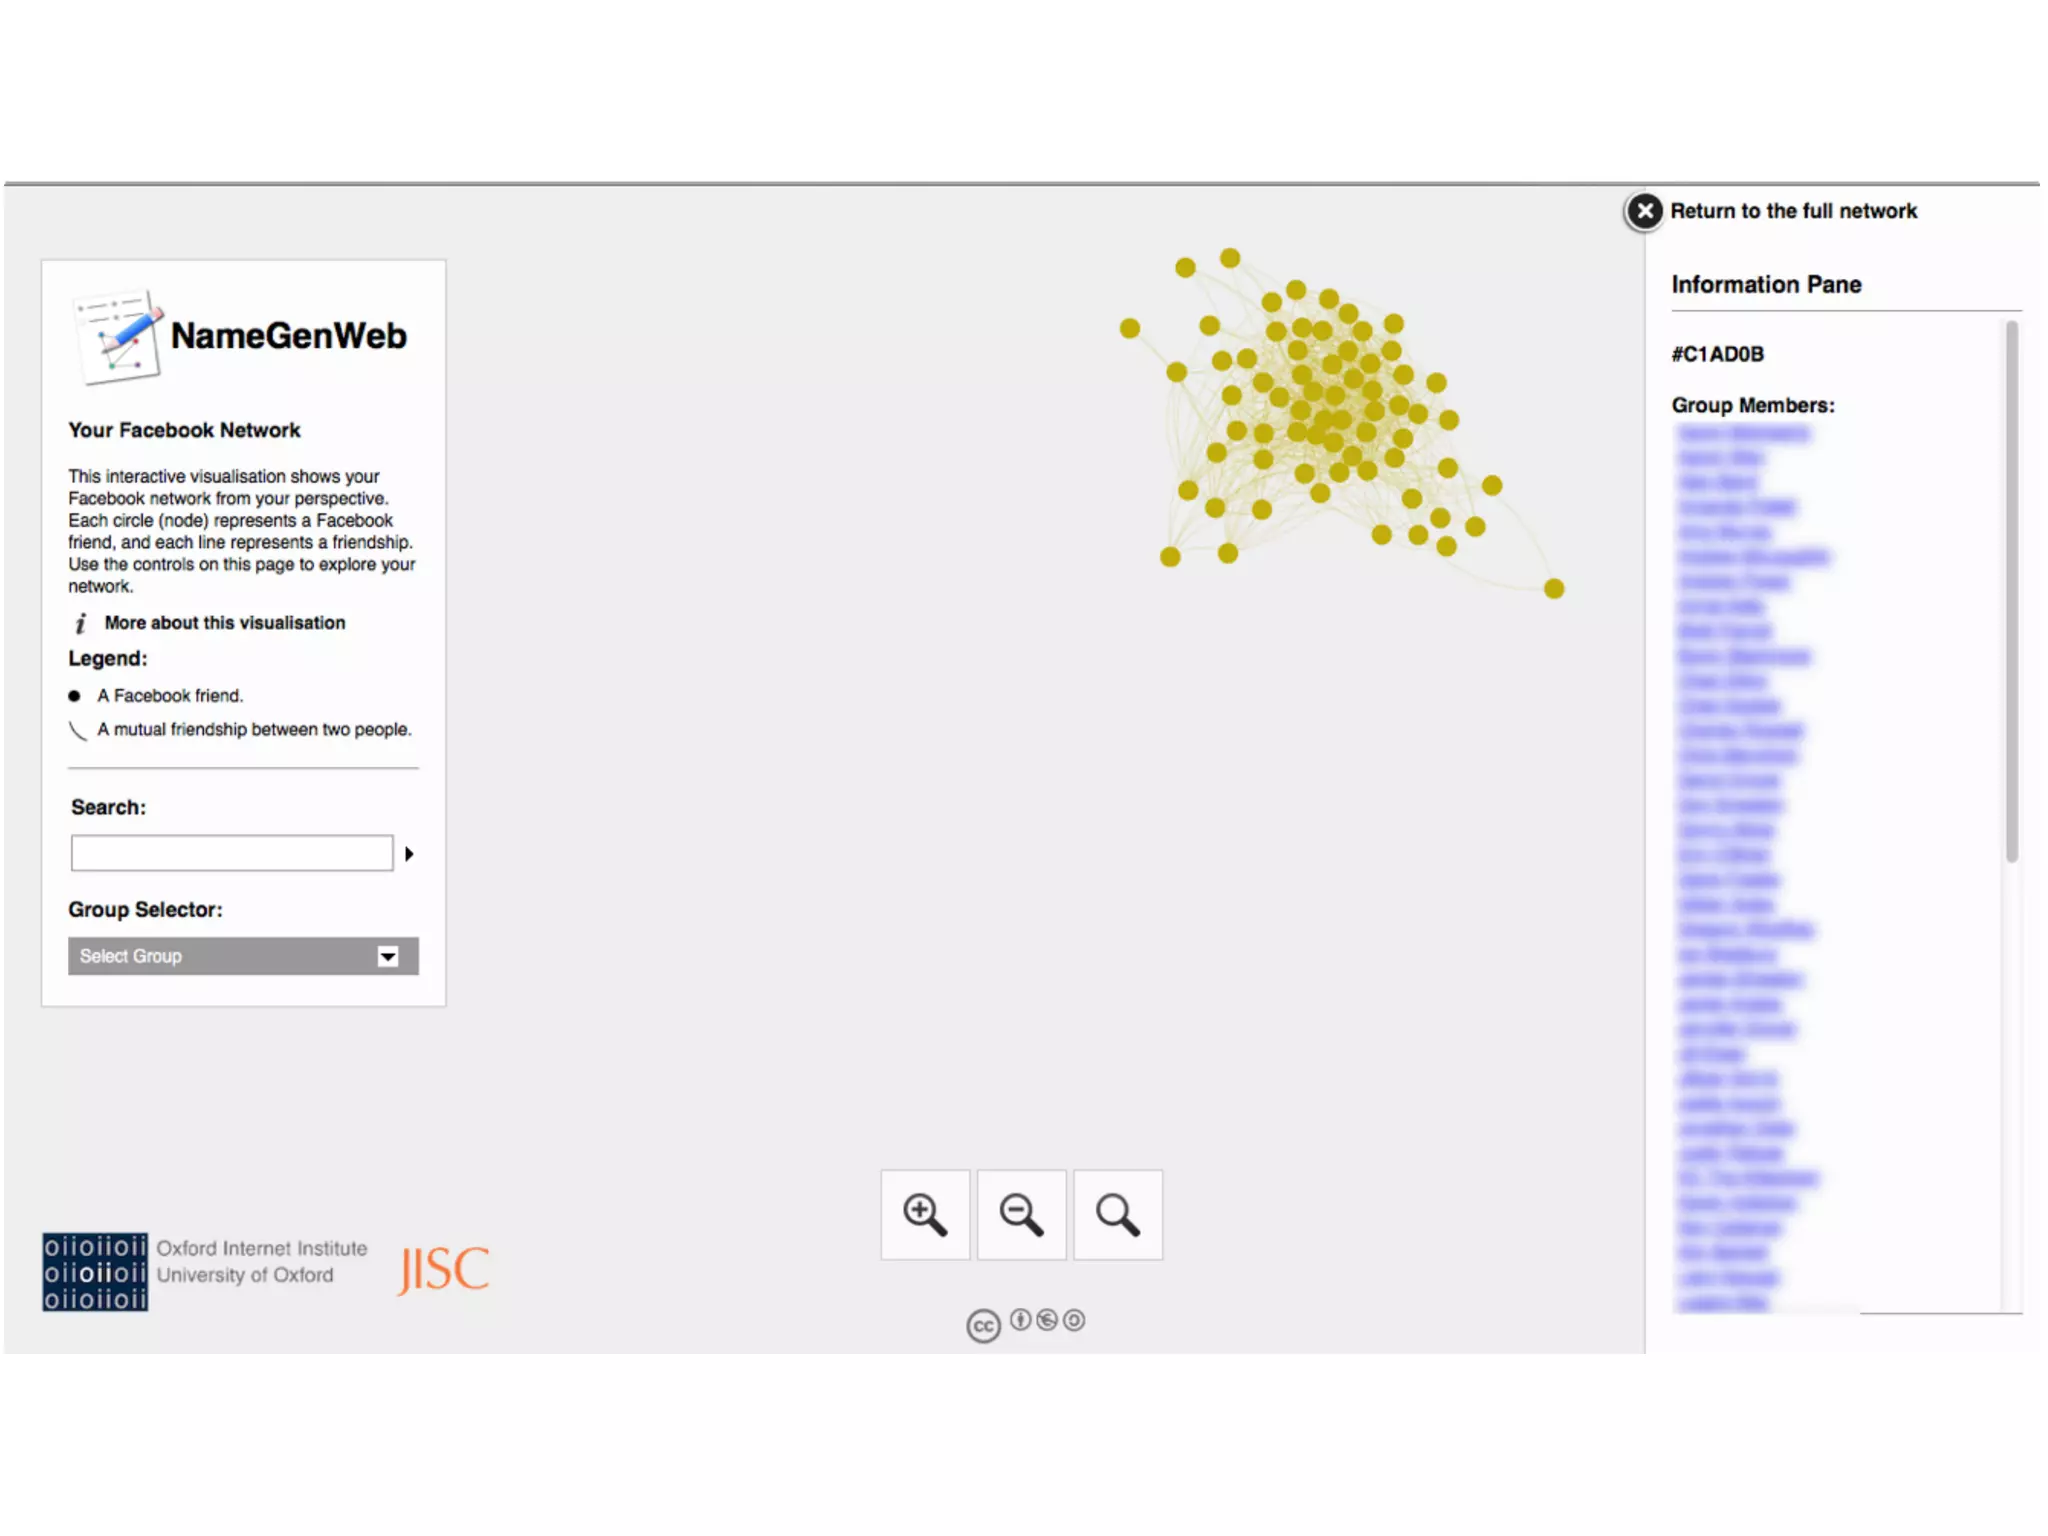
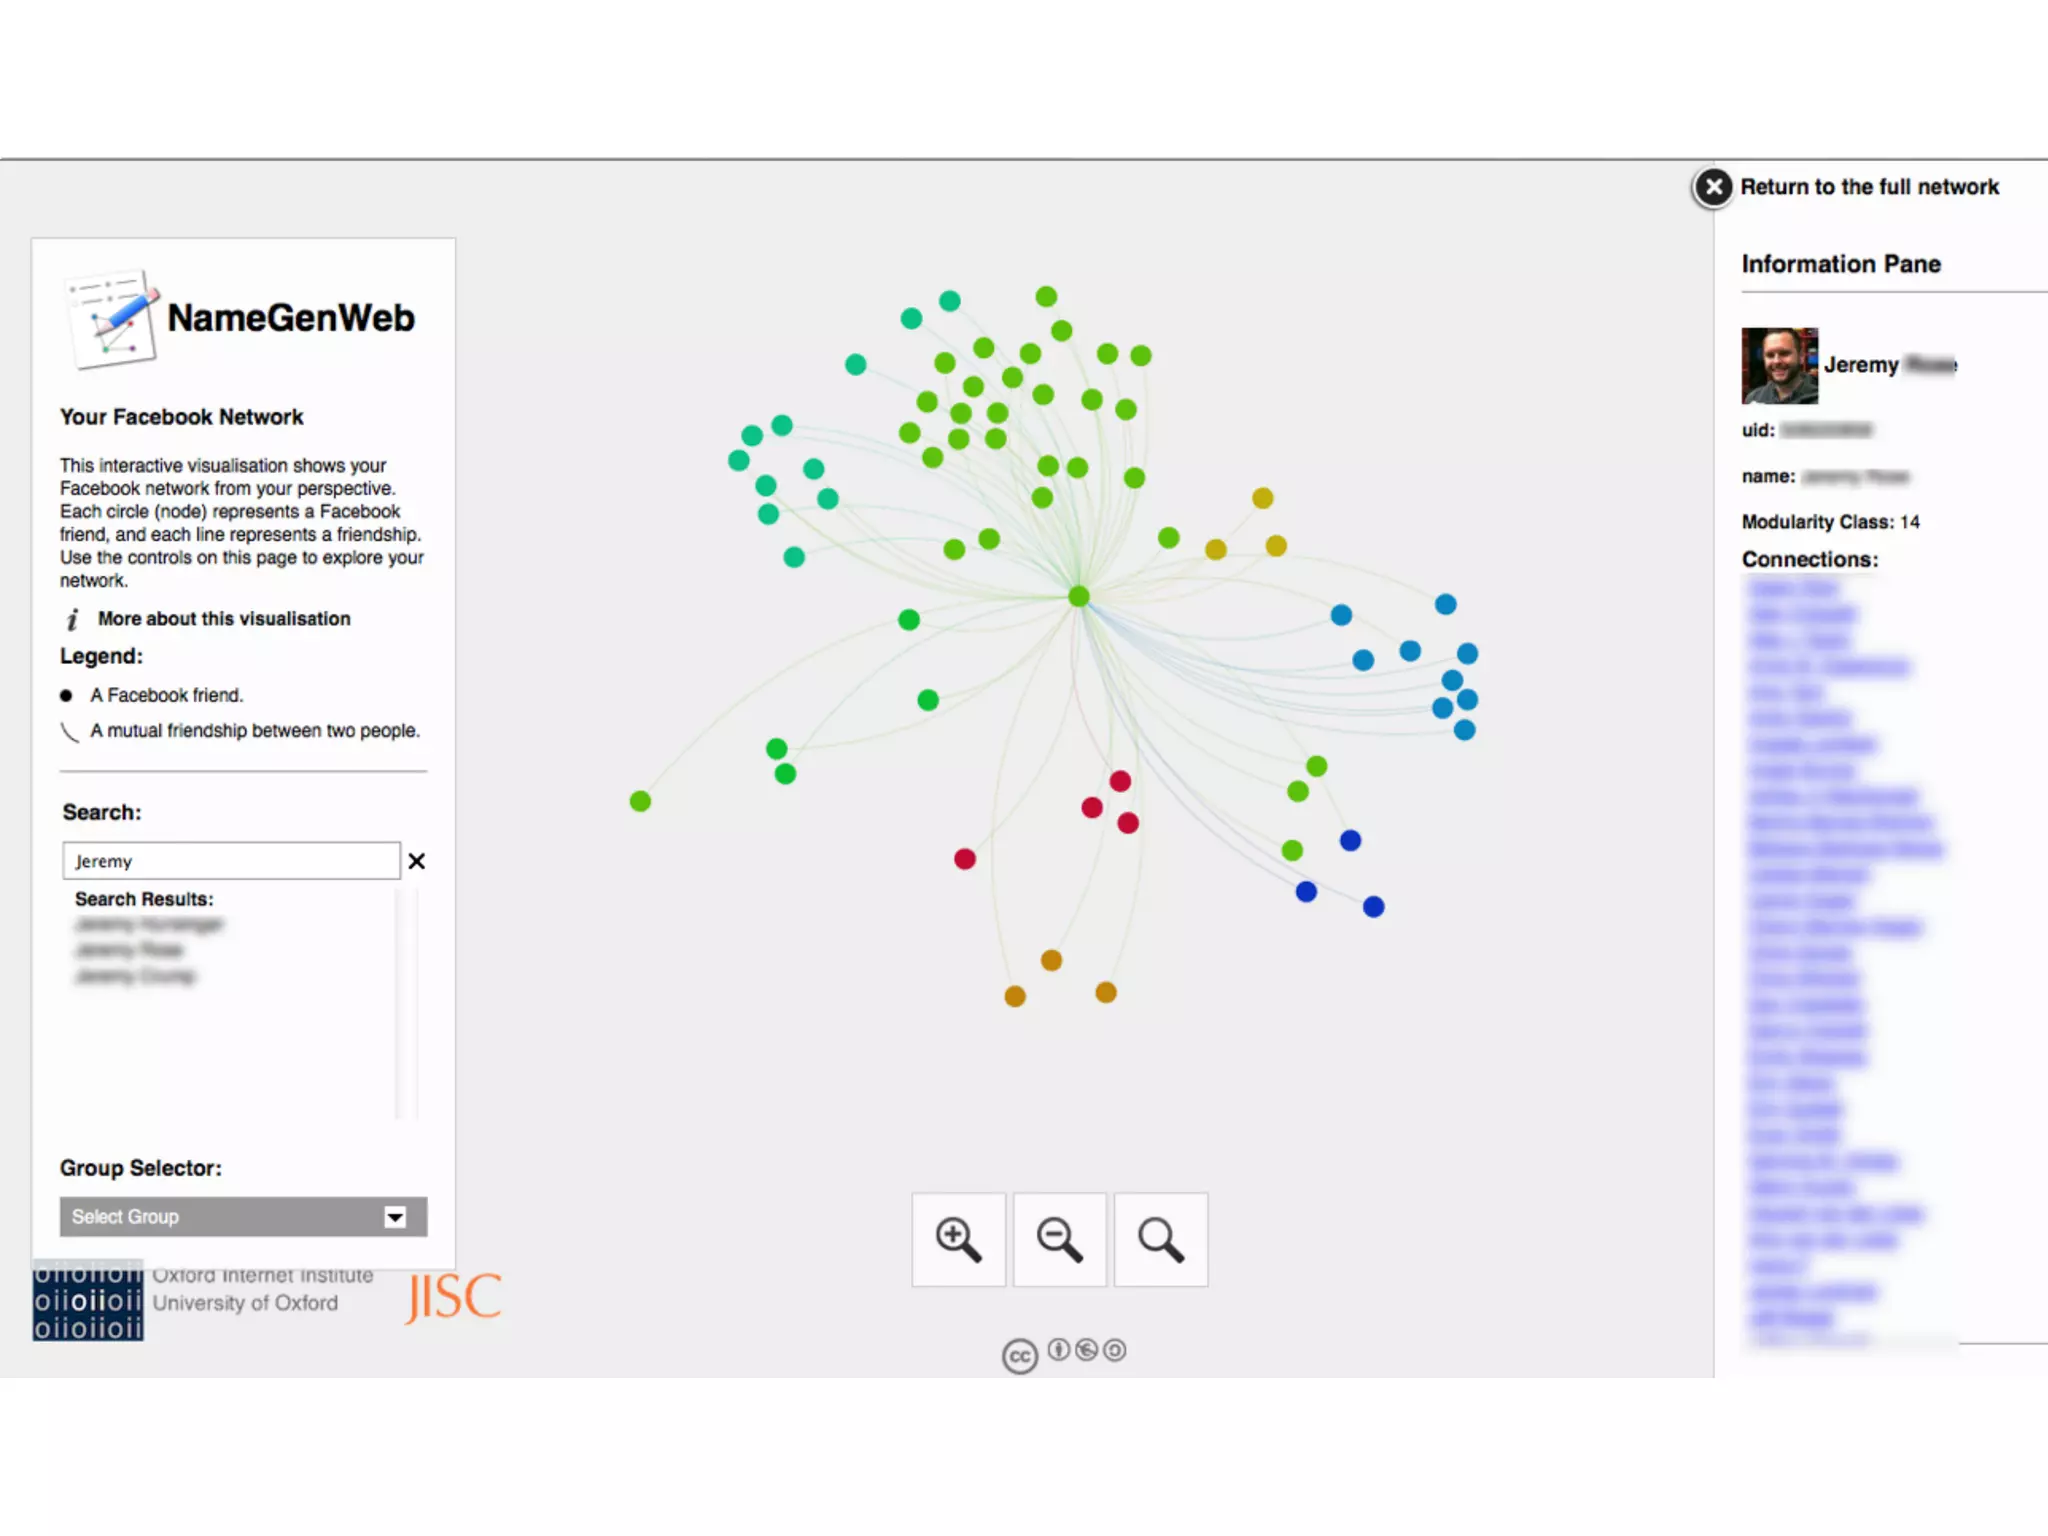
SNA 101:
Not just reading tea leaves
          Dr Bernie Hogan [@blurky]
    Research Fellow, Oxford Internet Institute
              University of Oxford

     LocalSocialSummit, November 13, 2012
What do you already know?


 Diffusion Happens      Nets look nice


Some are influencers   Science has potential
Some Principles

• Influence is not an obvious process.
• Central people are not always the most
  popular people (but usually are)
• Visualizations can be useful, but this takes
  work. Sciency is bull$#!†.
Some Limits
• Estimating selection versus influence is
  extremely tough, even for the best.
• Visualizing more than a couple thousand
  points? Congrats, its now art!
• A link is not always a meaningful link
• Data cleaning is the worst part. Seriously.
Tools!
• Interactive is hot! D3 and Sigma.js (or just
  javascript/html5) are the future of interactive
  network visualization
• Gephi [Cross-Platform] creates very spiffy
  diagrams and has great layouts for dustballs:
  ForceAtlas, ForceAtlas2,YuFan Hu, FR, Nooverlap
• NodeXL [Windows] has great data management
  features and a couple neat visualization features.
  See: nodexlgraphgallery.com for inspiration.
Some networks
And why you should care
Right and Left Wing Blogs
Made with GUESS
Nice sharp PDF.
Two blobs show clear partition.


Source: Adamic and Glance 2005
New Scientist Twitter Page
Made with NodeXL
Shows Twitter icons
Indicates tweet diffusion and polarization


Source: ConnectedAction.net
Facebook Social Networks
Made with Sigma.js / Gephi toolkit
Interactive browser-based
Most nets show social roles as clusters


Source: Hogan and Melville
Facebook Global Network
Made with R
Beautiful and signifying
Note the absence of Russia, China and Africa


Source: Facebook.com
Internet Undersea Cables
Package unknown
Relevance of geography
Artistic rendering shows much more


Sources: Caida, Telegeography
Obesity over time
Made with SONIA
Overly cluttered
Bad visual variables
Networks shouldn’t look Sciency
           Source: Christakis & Fowler. N Engl J Med 2007;357:370-9.
Two Network Demos

• Network Visualization App
 • http://blogs.oii.ox.ac.uk/vis
 • http://apps.facebook.com/namegencollege
• NodeXL
 • http://nodexl.codeplex.com/
Network 1 Goals

• Overview
• What do clusters mean?
• Who is considered more central?
Network 2 Goals
• Is there cohesion among the group?
 • Many blobs or few? Core-periphery or
    multi-core.
• Are certain people broadcasters?
• How can we accentuate the story?
• List people by number of tweets?
Thank You
         Bernie Hogan
      Research Fellow, OII
http://people.oii.ox.ac.uk/hogan
        Twitter: @blurky
  bernie.hogan@oii.ox.ac.uk

Networks: A Crash Course at Local Social Summit

  • 1.
    SNA 101: Not justreading tea leaves Dr Bernie Hogan [@blurky] Research Fellow, Oxford Internet Institute University of Oxford LocalSocialSummit, November 13, 2012
  • 2.
    What do youalready know? Diffusion Happens Nets look nice Some are influencers Science has potential
  • 3.
    Some Principles • Influenceis not an obvious process. • Central people are not always the most popular people (but usually are) • Visualizations can be useful, but this takes work. Sciency is bull$#!†.
  • 4.
    Some Limits • Estimatingselection versus influence is extremely tough, even for the best. • Visualizing more than a couple thousand points? Congrats, its now art! • A link is not always a meaningful link • Data cleaning is the worst part. Seriously.
  • 5.
    Tools! • Interactive ishot! D3 and Sigma.js (or just javascript/html5) are the future of interactive network visualization • Gephi [Cross-Platform] creates very spiffy diagrams and has great layouts for dustballs: ForceAtlas, ForceAtlas2,YuFan Hu, FR, Nooverlap • NodeXL [Windows] has great data management features and a couple neat visualization features. See: nodexlgraphgallery.com for inspiration.
  • 6.
    Some networks And whyyou should care
  • 7.
    Right and LeftWing Blogs Made with GUESS Nice sharp PDF. Two blobs show clear partition. Source: Adamic and Glance 2005
  • 9.
    New Scientist TwitterPage Made with NodeXL Shows Twitter icons Indicates tweet diffusion and polarization Source: ConnectedAction.net
  • 11.
    Facebook Social Networks Madewith Sigma.js / Gephi toolkit Interactive browser-based Most nets show social roles as clusters Source: Hogan and Melville
  • 16.
    Facebook Global Network Madewith R Beautiful and signifying Note the absence of Russia, China and Africa Source: Facebook.com
  • 18.
    Internet Undersea Cables Packageunknown Relevance of geography Artistic rendering shows much more Sources: Caida, Telegeography
  • 21.
    Obesity over time Madewith SONIA Overly cluttered Bad visual variables
  • 22.
    Networks shouldn’t lookSciency Source: Christakis & Fowler. N Engl J Med 2007;357:370-9.
  • 23.
    Two Network Demos •Network Visualization App • http://blogs.oii.ox.ac.uk/vis • http://apps.facebook.com/namegencollege • NodeXL • http://nodexl.codeplex.com/
  • 24.
    Network 1 Goals •Overview • What do clusters mean? • Who is considered more central?
  • 25.
    Network 2 Goals •Is there cohesion among the group? • Many blobs or few? Core-periphery or multi-core. • Are certain people broadcasters? • How can we accentuate the story? • List people by number of tweets?
  • 26.
    Thank You Bernie Hogan Research Fellow, OII http://people.oii.ox.ac.uk/hogan Twitter: @blurky bernie.hogan@oii.ox.ac.uk