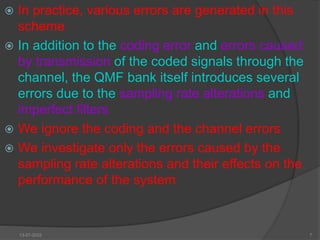
Download to read offline


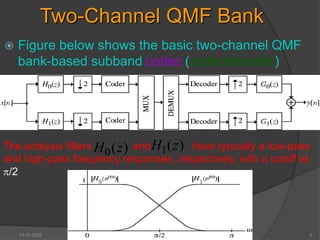
![Quadrature-Mirror Filter
Bank
In many applications, a discrete-time signal x[n] is
split into a number of sub-band signals by
means of an analysis filter bank
The sub-band signals are then processed
Finally, the processed sub-band signals are combined
by a synthesis filter bank resulting in an output signal
y[n]
If the sub-band signals are band limited to
frequency ranges much smaller than that of the
original input signal x[n], they can be down-sampled
before processing
Because of the lower sampling rate, the processing of
the down-sampled signals can be carried out more
efficiently
]}
[
{ n
vk
]}
[
{ n
vk
13-07-2022 3](https://image.slidesharecdn.com/hunnyadsp21304014-220713094845-e35345d3/85/SIMULATION-OF-QMF-FILTER-Bank-3-320.jpg)
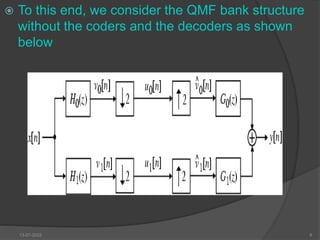
![ After processing, these signals are then up-sampled
before being combined by the synthesis filter bank
into a higher-rate signal
The combined structure is called a quadrature-mirror
filter (QMF) bank
If the down-sampling and up-sampling factors are
equal to or greater than the number of bands of the
filter bank, then the output y[n] can be made to retain
some or all of the characteristics of the input signal
x[n] by choosing appropriately the filters in the
structure
If the up-sampling and down-sampling factors are
equal to the number of bands, then the structure is
called a critically sampled filter bank
The most common application of this scheme is in the
efficient coding of a signal x[n]
13-07-2022 4](https://image.slidesharecdn.com/hunnyadsp21304014-220713094845-e35345d3/85/SIMULATION-OF-QMF-FILTER-Bank-4-320.jpg)
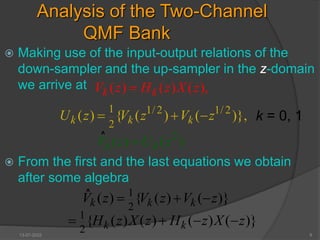
![ Each down-sampled subband signal is encoded
by exploiting the special spectral properties of the
signal, such as energy levels and perceptual
importance
It follows from the figure that the sampling rates of
the output y[n] and the input x[n] are the same
The analysis and the synthesis filters are chosen
so as to ensure that the reconstructed output y[n]
is a reasonably close replica of the input x[n]
Moreover, they are also designed to provide good
frequency selectivity in order to ensure that the
sum of the power of the subband signals is
reasonably close to the input signal power
13-07-2022 6](https://image.slidesharecdn.com/hunnyadsp21304014-220713094845-e35345d3/85/SIMULATION-OF-QMF-FILTER-Bank-6-320.jpg)
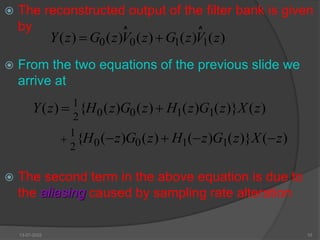
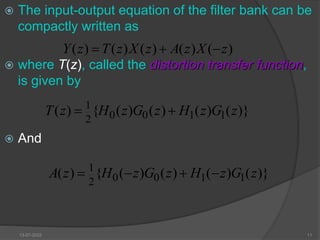
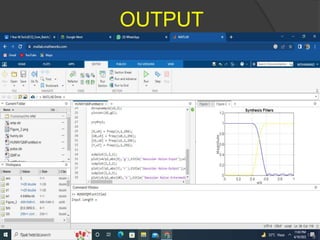
![MATLAB CODE
[N,fpts,mag,wt]=firpmord([0.395 0.605],[1 0],[0.0005
0.0005]);[q,err]=firpm(N,fpts,mag,wt);q(18)=q(18)+err;h0=firminphase(q)
;g0=fliplr(h0);k=0:17;h1=((-1).^k).*g0;g1=-((-1).^k).*h0;[H0,w0] =
freqz(h0,1,256);[H1,w1] = freqz(h1,1,256);[G0,w2] =
freqz(g0,1,256);[G1,w3] =
freqz(g1,1,256);plot(w0/pi,abs(H0),'g',w1/pi,abs(H1),'r'),title('Analysis
Filters');xlabel('omega/pi');
ylabel('Magnitude');grid;figure;plot(w2/pi,abs(G0),'b',w3/pi,abs(G1),'y'),titl
e('Synthesis Filters');grid;xlabel('omega/pi'); ylabel('Magnitude');m =
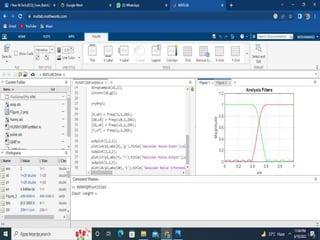
input('Input Length =
');x=randn(1,m);v0=conv(h0,x);u0=downsample(v0,2);d0=upsample(u0,
2);y0=conv(d0,g0);v1=conv(h1,x);u1=downsample(v1,2);d1=upsample(u
1,2);y1=conv(d1,g1);y=y0+y1;[X,w4] = freqz(x,1,256);[U0,w5] =
freqz(u0,1,256);[U1,w6] = freqz(u1,1,256);[Y,w7] =
freqz(y,1,256);subplot(2,2,1);plot(w4/pi,abs(X),'g'),title('Gaussian Noise-
Input');xlabel('omega/pi');
ylabel('Magnitude');grid;subplot(2,2,2);plot(w7/pi,abs(Y),'r'),title('Gaussia
n Noise-Output');xlabel('omega/pi');
ylabel('Magnitude');grid;subplot(2,2,3);plot(w5/pi,abs(U0),'b'),title('Gaussi
an Noise-Intermediate Signal U0');xlabel('omega/pi');
ylabel('Magnitude');grid;
13-07-2022 12](https://image.slidesharecdn.com/hunnyadsp21304014-220713094845-e35345d3/85/SIMULATION-OF-QMF-FILTER-Bank-12-320.jpg)


This document describes the simulation of a quadrature mirror filter (QMF) bank using MATLAB software. It provides background on QMF banks, describing their use in signal processing applications like subband coding. The document then gives details on implementing a two-channel QMF bank in MATLAB, including generating the analysis and synthesis filters and processing a sample input signal through the filter bank. It concludes by showing the output of the MATLAB simulation and citing references.