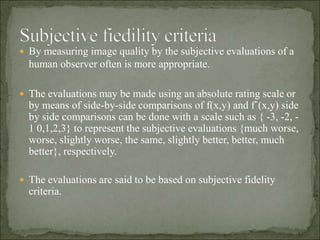
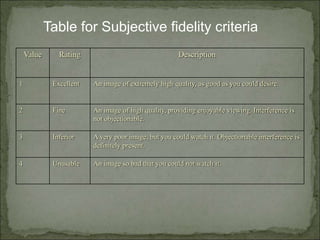
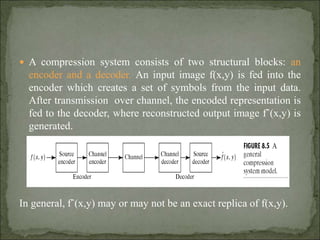
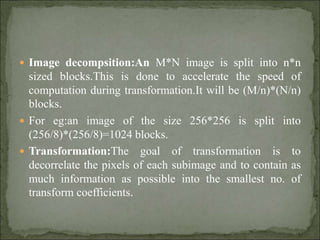
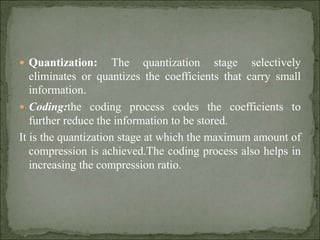
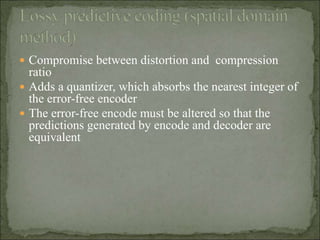
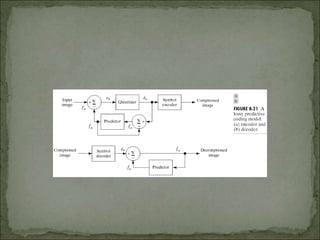
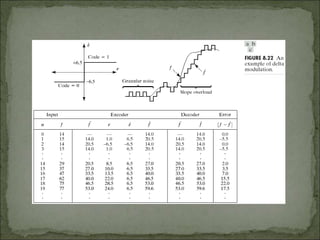
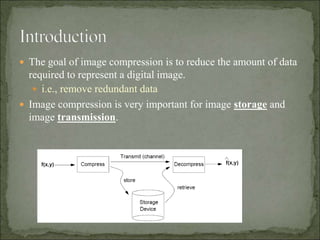
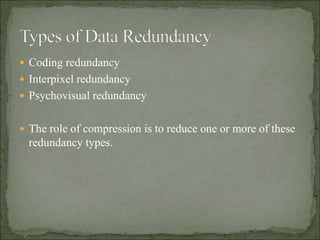
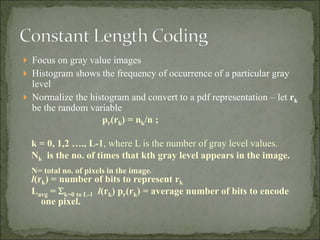
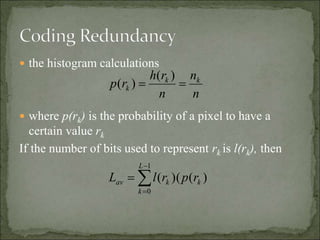
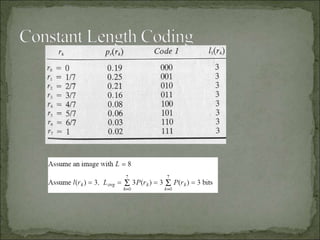
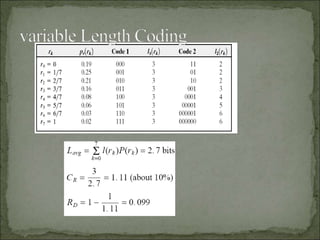
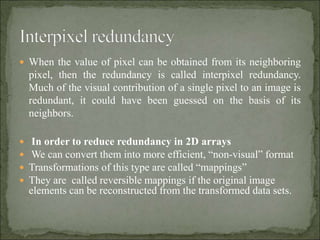
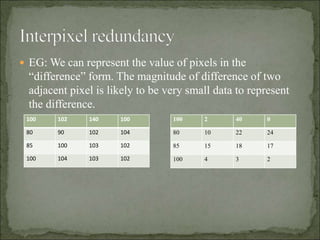
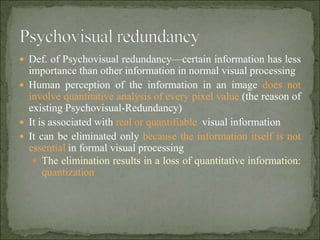
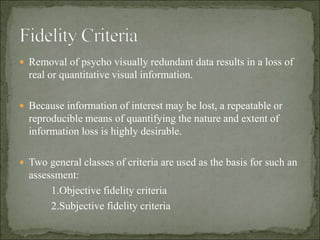
The document discusses various techniques for image compression. It describes how image compression aims to reduce redundant data in images to decrease file size for storage and transmission. It discusses different types of redundancy like coding, inter-pixel, and psychovisual redundancy that compression algorithms target. Common compression techniques described include transform coding, predictive coding, Huffman coding, and Lempel-Ziv-Welch (LZW) coding. Key aspects like compression ratio, mean bit rate, objective and subjective quality metrics are also covered.

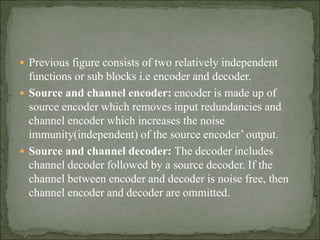
![so that the total error between the two images is:
∑∑[ fˆ(x,y) – f(x,y)]
x= 0 to M-1
y= 0 to N-1
Where the images are of size M*N.
Root mean square error (rms)](https://image.slidesharecdn.com/redundacyunit5-191105054710/85/Data-Redundacy-17-320.jpg)