More Related Content Similar to 11720171Chapter 9 Testing the Difference Betwee.docx (20) More from robert345678 (20) 1. 11/7/2017
1
Chapter 9: Testing
the Difference
Between Two
Means
• In Chapter 7, we compared to μ,
where one sample was drawn from one
population
• In this chapter, we’ll test the difference
between two samples drawn from two
populations
Testing the Difference
Between Two Means
Howard T. Tokunaga, Fundamental Statistics for the Social and
Behavioral Sciences © SAGE Publications, 2016
11/7/2017
2
An Example…
2. • Will people take longer to leave a
parking space when another driver is
waiting (“Intruder”) compared to when
no other driver is waiting (“No
intruder”)?
• Observational study with 15 drivers in
each condition (Ruback & Juieng, 1997)
Howard T. Tokunaga, Fundamental Statistics for the Social and
Behavioral Sciences © SAGE Publications, 2016
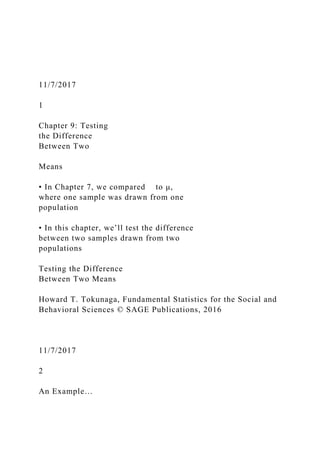
An Example…
Intruder No Intruder
Howard T. Tokunaga, Fundamental Statistics for the Social and
Behavioral Sciences © SAGE Publications, 2016
11/7/2017
3
• Bar chart
− One nominal variable as IV
− Bar height represents mean on DV
− Error bars represent 1 standard error of the mean
above and below the mean (± 1 s )
An Example…
Howard T. Tokunaga, Fundamental Statistics for the Social and
Behavioral Sciences © SAGE Publications, 2016
3. An Example…
• Are the two groups different from each
other?
– Chapter 7: evaluated a sample mean using
a distribution of sample means (the
sampling distribution of the mean)
– Now: Evaluate the difference between two
sample means using a distribution of
differences between sample means (the
sampling distribution of the difference).
Howard T. Tokunaga, Fundamental Statistics for the Social and
Behavioral Sciences © SAGE Publications, 2016
11/7/2017
4
Sampling Distribution
of the Difference
• Sampling distribution of the difference:
distribution of all possible differences
between two sample means when an
infinite number of pairs of samples of
size N are randomly drawn from two
populations
– Used to determine the probability of
obtaining any particular difference between
4. two sample means
Howard T. Tokunaga, Fundamental Statistics for the Social and
Behavioral Sciences © SAGE Publications, 2016
Sampling Distribution
of the Difference
Howard T. Tokunaga, Fundamental Statistics for the Social and
Behavioral Sciences © SAGE Publications, 2016
• Lets assume that two populations are not
different
• We randomly draw samples from each
population and calculate differences
between the two sample means
• Although we expect there to be no (zero)
differences between the sample means,
because of sampling error, we will get a
distribution of differences
11/7/2017
5
The Sampling Distribution of
the Difference: Characteristics
Howard T. Tokunaga, Fundamental Statistics for the Social and
Behavioral Sciences © SAGE Publications, 2016
• Modality
5. − Mean = 0
• Symmetry
− Approximately normal
− Shape determined by sample size
• Variability
− Standard error of the difference
Inferential Statistics: Testing the
Difference between Two Sample Means
State the null and alternative hypotheses (H0 and H1)
Make a decision about the null hypothesis
Draw a conclusion from the analysis
Relate the result of the analysis to the research
hypothesis
Howard T. Tokunaga, Fundamental Statistics for the Social and
Behavioral Sciences © SAGE Publications, 2016
11/7/2017
6
Inferential Statistics: Testing the
Difference between Two Sample Means
• State the null and alternative hypotheses
H0: µIntruder = µNo intruder
6. H1: intruder
Howard T. Tokunaga, Fundamental Statistics for the Social and
Behavioral Sciences © SAGE Publications, 2016
Inferential Statistics: Testing the
Difference between Two Sample Means
State the null and alternative hypotheses (H0 and H1)
Make a decision about the null hypothesis
Draw a conclusion from the analysis
Relate the result of the analysis to the research
hypothesis
Howard T. Tokunaga, Fundamental Statistics for the Social and
Behavioral Sciences © SAGE Publications, 2016
11/7/2017
7
Inferential Statistics: Testing the
Difference between Two Sample Means
• Make a decision about the null
hypothesis
– Calculate the degrees of freedom (df)
– Set alpha (α), identify the critical values,
and state a decision rule
7. – Calculate a statistic: t‐test for independent
means
– Make a decision whether to reject the null
hypothesis
– Determine the level of significance
Howard T. Tokunaga, Fundamental Statistics for the Social and
Behavioral Sciences © SAGE Publications, 2016
Inferential Statistics: Testing the
Difference between Two Sample Means
• Make a decision about the null
hypothesis
– Calculate the degrees of freedom (df)
– Because we have two samples from two
populations,
df = (N1 – 1) + (N2 – 1)
= (15 – 1) + (15 – 1)
= 28
Howard T. Tokunaga, Fundamental Statistics for the Social and
Behavioral Sciences © SAGE Publications, 2016
11/7/2017
8. 8
Inferential Statistics: Testing the
Difference between Two Sample Means
• Make a decision about the null
hypothesis
– Set alpha (α), identify the critical values,
and state a decision rule
• For α = .05 (two‐tailed) and df = 28, critical
value =
• If t < ‐2.048 or > 2.048, reject H0; otherwise,
do not reject H0
Howard T. Tokunaga, Fundamental Statistics for the Social and
Behavioral Sciences © SAGE Publications, 2016
• Make a decision about the null
hypothesis.
− Calculate a statistic: t‐test for independent
means
Inferential Statistics: Testing the
Difference between Two Sample Means
Howard T. Tokunaga, Fundamental Statistics for the Social and
Behavioral Sciences © SAGE Publications, 2016
11/7/2017
9. 9
Inferential Statistics: Testing the
Difference between Two Sample Means
Howard T. Tokunaga, Fundamental Statistics for the Social and
Behavioral Sciences © SAGE Publications, 2016
• Make a decision about the null
hypothesis
− Calculate the standard error of the
difference
Inferential Statistics: Testing the
Difference between Two Sample Means
Howard T. Tokunaga, Fundamental Statistics for the Social and
Behavioral Sciences © SAGE Publications, 2016
• Make a decision about the null
hypothesis.
− Calculate the t‐statistic for independent
means:
t = 2.42
11/7/2017
10
Inferential Statistics: Testing the
Difference between Two Sample Means
10. • Make a decision about the null
hypothesis
– Make a decision whether to reject the null
hypothesis
t = 2.42 > 2.048 H0 (p < .05)
– Determine the level of significance
• For .01, critical value = 2.763
• t = 2.42 < 2.763 < .05 (but not < .01)
Howard T. Tokunaga, Fundamental Statistics for the Social and
Behavioral Sciences © SAGE Publications, 2016
Inferential Statistics: Testing the
Difference between Two Sample Means
• Make a decision about the null hypothesis
Howard T. Tokunaga, Fundamental Statistics for the Social and
Behavioral Sciences © SAGE Publications, 2016
11/7/2017
11
Inferential Statistics: Testing the
Difference between Two Sample Means
State the null and alternative hypotheses (H0 and H1)
11. Make a decision about the null hypothesis
Draw a conclusion from the analysis
Relate the result of the analysis to the research
hypothesis
Howard T. Tokunaga, Fundamental Statistics for the Social and
Behavioral Sciences © SAGE Publications, 2016
Inferential Statistics: Testing the
Difference between Two Sample Means
• Draw a conclusion from the analysis
– The mean departure time for the 15
drivers in the Intruder group (M = 40.73s)
is significantly greater than the mean
departure time for the 15 drivers in the No
intruder group (M = 31.67s), t(28) = 2.42, p
< .05.
Howard T. Tokunaga, Fundamental Statistics for the Social and
Behavioral Sciences © SAGE Publications, 2016
11/7/2017
12
Inferential Statistics: Testing the
Difference between Two Sample Means
State the null and alternative hypotheses (H0 and H1)
12. Make a decision about the null hypothesis
Draw a conclusion from the analysis
Relate the result of the analysis to the research
hypothesis
Howard T. Tokunaga, Fundamental Statistics for the Social and
Behavioral Sciences © SAGE Publications, 2016
Inferential Statistics: Testing the
Difference between Two Sample Means
• Relate the result to the research
hypothesis
– “The present series of studies is consistent
with prior findings that people display
territorial defense in public
territories...What is new about the present
research is that it suggests people
sometimes display territorial behavior
merely to keep others from possessing the
space even when it no longer has any value
to them” (Ruback & Juieng, 1997, p. 831).
Howard T. Tokunaga, Fundamental Statistics for the Social and
Behavioral Sciences © SAGE Publications, 2016
11/7/2017
13
13. Inferential Statistics: Testing the
Difference between Two Sample Means
• Assumptions of the t‐test for
independent means
– Assumption of normality: the distribution
of scores in the two populations from
which the samples are drawn are normal
– Homogeneity of variance: variance of
scores in the two populations is the same
Howard T. Tokunaga, Fundamental Statistics for the Social and
Behavioral Sciences © SAGE Publications, 2016
Inferential Statistics: Testing the
Difference between Two Sample Means
• If the assumptions are violated,
researchers may make the wrong
decision regarding the null hypothesis
• However, the t‐statistic is robust
– Able to withstand moderate violations of
the assumptions
Howard T. Tokunaga, Fundamental Statistics for the Social and
Behavioral Sciences © SAGE Publications, 2016
11/7/2017
14
14. Inferential Statistics: Testing the
Difference between Two Sample
Means (unequal sample sizes)
• Example:
− Researchers tested the effects of a healthy
living and exercise intervention on
kindergarten and first grade students’ (N1 =
16) ability to jump rope for 30 seconds.
They compared these scores to a control
group (N2 = 11) who did not receive the
intervention.
− Data from Matvienko and Ahrabi‐Fard
(2010)
Howard T. Tokunaga, Fundamental Statistics for the Social and
Behavioral Sciences © SAGE Publications, 2016
Intervention (N1 = 16) Control (N2 = 11)
Inferential Statistics: Testing the
Difference between Two Sample
Means (unequal N)
Howard T. Tokunaga, Fundamental Statistics for the Social and
Behavioral Sciences © SAGE Publications, 2016
11/7/2017
15
15. • State the null and alternative
hypotheses
H0: µIntervention= µControl
H1: µIntervention
Howard T. Tokunaga, Fundamental Statistics for the Social and
Behavioral Sciences © SAGE Publications, 2016
Inferential Statistics: Testing the
Difference between Two Sample
Means (unequal N)
• Make a decision about the null
hypothesis
– Calculate the degrees of freedom (df)
df = (N1 – 1) + (N2 – 1)
= (16 – 1) + (11 – 1)
=25
Howard T. Tokunaga, Fundamental Statistics for the Social and
Behavioral Sciences © SAGE Publications, 2016
Inferential Statistics: Testing the
Difference between Two Sample
Means (unequal N)
11/7/2017
16. 16
• Make a decision about the null hypothesis
– Set alpha (α), identify the critical values, and state
a decision rule
• For α = .05 (two‐tailed) and df = 25, critical
value =
• If t < ‐2.060 or > 2.060, reject H0; otherwise, do
not reject H0
Howard T. Tokunaga, Fundamental Statistics for the Social and
Behavioral Sciences © SAGE Publications, 2016
Inferential Statistics: Testing the
Difference between Two Sample
Means (unequal N)
Howard T. Tokunaga, Fundamental Statistics for the Social and
Behavioral Sciences © SAGE Publications, 2016
Inferential Statistics: Testing the
Difference between Two Sample
Means (unequal N)
• Make a decision about the null
hypothesis
− Calculate a statistic: t‐test for independent
means:
17. 11/7/2017
17
Howard T. Tokunaga, Fundamental Statistics for the Social and
Behavioral Sciences © SAGE Publications, 2016
Inferential Statistics: Testing the
Difference between Two Sample
Means (unequal N)
• Make a decision about the null hypothesis
− Calculate the standard error of the difference
Howard T. Tokunaga, Fundamental Statistics for the Social and
Behavioral Sciences © SAGE Publications, 2016
Inferential Statistics: Testing the
Difference between Two Sample
Means (unequal N)
11/7/2017
18
Howard T. Tokunaga, Fundamental Statistics for the Social and
Behavioral Sciences © SAGE Publications, 2016
Inferential Statistics: Testing the
Difference between Two Sample
18. Means (unequal N)
• Make a decision about the null
hypothesis
− Calculate a statistic: t‐test for independent
means:
t = 3.97
• Make a decision about the null
hypothesis
– Make a decision whether to reject the null
hypothesis
t = 3.97 > 2.060 H0 (p < .05)
– Determine the level of significance
• For .01, critical value = 2.787
• t = 3.97 > 2.787 < .01
Howard T. Tokunaga, Fundamental Statistics for the Social and
Behavioral Sciences © SAGE Publications, 2016
Inferential Statistics: Testing the
Difference between Two Sample
Means (unequal N)
11/7/2017
19. 19
• Make a decision about the null hypothesis
Howard T. Tokunaga, Fundamental Statistics for the Social and
Behavioral Sciences © SAGE Publications, 2016
Inferential Statistics: Testing the
Difference between Two Sample
Means (unequal N)
• Draw a conclusion from the analysis
– The average number of rope jumps in 30
seconds is significantly greater for the 16
students who received the intervention (M
= 27.31) than for the 11 students in the
Control group who did not receive the
intervention (M = 11.91), t(25) = 3.97, p <
.01.
Howard T. Tokunaga, Fundamental Statistics for the Social and
Behavioral Sciences © SAGE Publications, 2016
Inferential Statistics: Testing the
Difference between Two Sample
Means (unequal N)
11/7/2017
20
20. • Relate the result to the research
hypothesis
– “This finding suggests that programs
emphasizing the enhancement of basic
motor skills that children apply in a variety
of games and sports may be an effective
approach to increasing overall activity and
fitness levels of young children” (Matvienko
& Ahrabi‐Fard, 2010, p. 303).
Howard T. Tokunaga, Fundamental Statistics for the Social and
Behavioral Sciences © SAGE Publications, 2016
Inferential Statistics: Testing the
Difference between Two Sample
Means (unequal N)
Testing the Difference
Between Two Sample Means
• In the examples we’ve discussed so far,
we’ve compared samples from two
different populations
• These would be considered between‐
subjects research designs
– Each participant appears in only one group
Howard T. Tokunaga, Fundamental Statistics for the Social and
Behavioral Sciences © SAGE Publications, 2016
21. 11/7/2017
21
Inferential Statistics: Testing the
Difference between Paired Means
• Within‐subjects research designs test
differences (or change) within the same
participant
– Differences within a person regarding
different situations
– Repeated administrations (longitudinal
designs)
– Pre‐test – post‐test design
Howard T. Tokunaga, Fundamental Statistics for the Social and
Behavioral Sciences © SAGE Publications, 2016
Inferential Statistics: Testing the
Difference between Paired Means
• Example:
− A sample of 20 parents were tested on
their knowledge of childhood depression
and anxiety. Three weeks later, following a
web‐based program, the same parents
were re‐tested on their knowledge
− Data from Deitz et al. (2009)
22. Howard T. Tokunaga, Fundamental Statistics for the Social and
Behavioral Sciences © SAGE Publications, 2016
11/7/2017
22
Inferential Statistics: Testing the
Difference between Paired Means
Pre‐test Post‐test
Howard T. Tokunaga, Fundamental Statistics for the Social and
Behavioral Sciences © SAGE Publications, 2016
Inferential Statistics: Testing the
Difference between Paired Means
• Consequences of the same people
appearing in both conditions
– We explicitly identify the paired data by
calculating a difference between the two
scores
Howard T. Tokunaga, Fundamental Statistics for the Social and
Behavioral Sciences © SAGE Publications, 2016
11/7/2017
23
23. Inferential Statistics: Testing the
Difference between Paired Means
Howard T. Tokunaga, Fundamental Statistics for the Social and
Behavioral Sciences © SAGE Publications, 2016
Inferential Statistics: Testing the
Difference between Paired Means
• State the null and the alternative
hypotheses
H0: µD = 0
H1: µD
µD: Mean difference between the two scores
µD = 0 is the same as µPre‐test = µPost‐test
Howard T. Tokunaga, Fundamental Statistics for the Social and
Behavioral Sciences © SAGE Publications, 2016
11/7/2017
24
Inferential Statistics: Testing the
Difference between Paired Means
• Make a decision about the null
hypothesis
– Calculate the degrees of freedom (df)
24. df = (ND – 1)
= (20 – 1)
= 19
Howard T. Tokunaga, Fundamental Statistics for the Social and
Behavioral Sciences © SAGE Publications, 2016
Inferential Statistics: Testing the
Difference between Paired Means
• Make a decision about the null
hypothesis
– Set alpha (α), identify the critical values,
and state a decision rule
• For α = .05 (two‐tailed) and df = 19, critical value
=
• If t < ‐2.093 or > 2.093, reject H0; otherwise, do
not reject H0
Howard T. Tokunaga, Fundamental Statistics for the Social and
Behavioral Sciences © SAGE Publications, 2016
11/7/2017
25
Inferential Statistics: Testing the
Difference between Paired Means
25. Howard T. Tokunaga, Fundamental Statistics for the Social and
Behavioral Sciences © SAGE Publications, 2016
• Make a decision about the null
hypothesis
− Calculate a statistic: t‐test for dependent
means:
Inferential Statistics: Testing the
Difference between Paired Means
Howard T. Tokunaga, Fundamental Statistics for the Social and
Behavioral Sciences © SAGE Publications, 2016
• Make a decision about the null
hypothesis
− Calculate standard error of the difference
scores:
11/7/2017
26
Inferential Statistics: Testing the
Difference between Paired Means
Howard T. Tokunaga, Fundamental Statistics for the Social and
Behavioral Sciences © SAGE Publications, 2016
• Make a decision about the null
hypothesis
26. − Calculate t‐statistic for dependent means
Inferential Statistics: Testing the
Difference between Paired Means
• Make a decision about the null
hypothesis
– Make a decision whether to reject the null
hypothesis
t = ‐5.77 < H0 (p < .05)
– Determine the level of significance
• For .01, critical value for t = ‐2.861
• t = ‐5.77 < < .01
Howard T. Tokunaga, Fundamental Statistics for the Social and
Behavioral Sciences © SAGE Publications, 2016
11/7/2017
27
Inferential Statistics: Testing the
Difference between Paired Means
• Make a decision about the null hypothesis
Howard T. Tokunaga, Fundamental Statistics for the Social and
Behavioral Sciences © SAGE Publications, 2016
27. Inferential Statistics: Testing the
Difference between Paired Means
• Draw a conclusion from the analysis:
– The average knowledge scores for the 20
parents were significantly higher after
completing the web‐based intervention
program (M = 21.15) than before
beginning the program (M = 15.55), t(19) =
‐5.77, p < .01.
Howard T. Tokunaga, Fundamental Statistics for the Social and
Behavioral Sciences © SAGE Publications, 2016
11/7/2017
28
Inferential Statistics: Testing the
Difference between Paired Means
• Relate the result to the research
hypothesis
– “These findings indicate that the program
can be an effective intervention for
improving parents’ knowledge of children’s
mental health problems and boost their
confidence in handling such issues …The
study findings lend support to the growing
literature on the utility of offering web‐
based programs to improve the health of
the general population” (Dietz et al, 2009,
p. 492).
28. Howard T. Tokunaga, Fundamental Statistics for the Social and
Behavioral Sciences © SAGE Publications, 2016
Inferential Statistics: Testing the
Difference between Paired Means
• Assumptions of the t‐test for
dependent means
– Assumption of normality
• Larger sample sizes make meeting this
assumption more likely
Howard T. Tokunaga, Fundamental Statistics for the Social and
Behavioral Sciences © SAGE Publications, 2016
11/7/2017
29
Looking Ahead
• In this chapter, we explored the process of
hypothesis testing using a situation slightly
more complicated than those presented in
earlier chapters. However, we still use the
same basic steps in hypothesis testing.
• Because we must rely on probability, there
exists the possibility that the decision made
about the null hypothesis may be in error. The
next chapter discusses these errors in greater
detail, as well as what researchers can do to
minimize the possibility and impact of making
29. these errors.
Howard T. Tokunaga, Fundamental Statistics for the Social and
Behavioral Sciences © SAGE Publications, 2016
Title: Subtitle
Your Name
30. POLI 205
Dr. Frederick Wood
Month Day, 20Year
Write an introduction that tells the reader what your
research question is about and why it is important. This should
be no longer than the first page of your paper.
Literature Review
Describe what we already know about this question. This
section is not your evidence. This section is your opportunity
to prove that you know how other people have researched the
same topic and why you should be trusted by the reader. You
should use scholarly sources from JSTOR or Academic Search
Complete, which are available through the library’s web site.
You should not use blog posts or information from advocacy
groups or ideologues. This is also not an annotated
bibliography. You don’t write about how the article helps your
research. Instead you should state the findings of the previous
research. How it relates to your research should be obvious to
the reader.
Analysis & Assessment
This is the section where you are going to demonstrate
what you have learned in the class. I expect you to outline your
hypotheses, data collection, method of examination, and
describe your results in this section. You should use the data
from the SDA website. This is the most important section of
the paper. If your paper does not include a clear hypothesis test
31. with clearly identified independent and dependent variables and
the calculation of a test statistic with a conclusion, then you
will receive a 0 out of 100. Those who attempt an analysis, but
does it incorrectly, will receive a score of 50 out of 100. You
may not reference statistics generated by others. Only papers
that clearly demonstrate competence with the methods taught in
class will receive a passing grade.
Conclusion
Describe what your research allows you to conclude.
Answer the question posed in your introduction. Summarize the
entire paper in a paragraph but also talk about potential for
further investigation. Imagine what you would do if you could
build a statistical model where you can include multiple
independent variables.
Works Cited
Last, First M. 2012. “Title.”
Journal Title. Vol.(Issue): First –
Last page number.
Last, First M. 2012.
Book Title. Publisher: City, State.
Smith, Tom W, Peter Marsden, Michael Hout, and Jibum Kim.
General Social Surveys, 1972-2016 [machine-readable data file]
/Principal Investigator, Tom W. Smith; Co-Principal
Investigator, Peter V. Marsden; Co-Principal Investigator,
Michael Hout; Sponsored by National Science Foundation. -
NORC ed.- Chicago: NORC at the University of Chicago
[producer and distributor]. Data accessed from the Survey
Documentation and Analysis website at sda.berkeley.edu.