This document provides a summary of a 3-day workshop with about 90 industry experts that developed recommendations for designing, building, and operating more energy efficient data centers. Over 50 integrated recommendations were synthesized that could reduce data center energy use by about 10 times while improving reliability, lowering costs, and enhancing business value. Some recommendations could also be applied to existing data centers. The summary is presented in 3 sentences that outline the purpose and key outcomes of the workshop.


![To achieve the greatest possible energy savings
in a data center, it is best to begin with native
loads. This report is organized so that the reader
can follow the compounding savings from these
native loads back “up-stream” toward the electric
power source. As Natural Capitalism states about
reducing flow or friction in the pipes of a standard
industrial pumping system:
Saving one unit of energy furthest down-
stream…avoids enough compounding losses...
to save about ten units of fuel, cost, and pollution
back at the power plant. Those compounding
savings represent significant economic and
environmental leverage…[enabling] each
successive component, as you go back upstream,
to become smaller, simpler, and cheaper.
This…means that downstream savings merit
the greatest emphasis.2
The first step in increasing efficiency is to recog-
nize and account for the full cost of each watt of
power delivered to the server. For data centers, pay-
ing average U.S. commercial electricity rates of
$0.07/kWh, this value is at least $4/W—or twice
that at least $8/W, in places like Silicon Valley,
New York city, etc., where electricity typically
costs $0.14/kWh. In particularly inefficient data
centers, the value of each watt delivered to the
servers can be as high as $20/W. Note that power
always saved (continuously) is generally worth
several times as much as power saved intermit-
tently, unless the intermittent savings come when
power is especially expensive to deliver and this
is reflected in its price.
16 Design Recommendations for High-Performance Data Centers: Summary
Native Loads
Whole-systems thinking actively considers the interconnections between systems and solutions
that address multiple problems at the same time. Some refer to this process as the search
for “solution multipliers.” It requires a “vision across boundaries” and “solving for pattern.”
Comprehensively integrating topical recommendations is critical to achieving the best results.
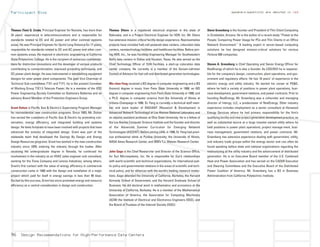
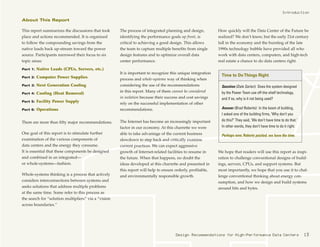
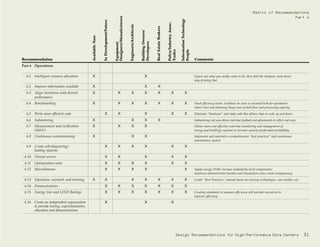
Design teams frequently use a value-engineering approach, instead of a whole-systems
approach, for system or product selection. Value engineering is piecemeal; it prices design
elements one by one to find the cheapest available product. But it fails to capture
the benefits that can be achieved by recognizing that even though certain parts of the design
may be more expensive, offsetting savings can make the whole project cost less and create
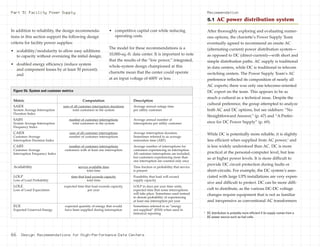
greater value. Rocky Mountain Institute calls this phenomenon “tunneling through the
cost barrier” (see Figure S.5). It is explained in detail in Natural Capitalism, especially in
Chapter Six.
Reliability is the main critical element in data center facilities.
Therefore, efficiency cannot compromise reliability, and success will be facilitated if efficiency
is shown to increase reliability.
The following paragraphs summarize the
major findings of each working group at the
charrette. This summary and the pages that
follow describe how practicing energy
efficiency can be achieved through combina-
tions of advanced CPU and server technolo-
gies, smarter facilities, better HVAC system
and power supply design, and more sensible
metrics of what things really cost.
diminishi
ngreturns
cumulative
resource savings
(+)
(–)
DETOUR
“tunnelling through
the cost barrier”…
…to even BIGGER
and cheaper
energy savings
marginalcostof
efficiencyimprovement
cost-effectiveness
limit
cost-effectiveness
limit
0
Figure S.5: Tunneling Through the Cost Barrier
Source: Rocky Mountain Institute 2
Loosely quoted from Natural Capitalism, pp. 121–22.](https://image.slidesharecdn.com/f244087a-ca6d-4a72-bd99-8446dc9f2061-150525100216-lva1-app6892/85/E03-08_HighPerformanceDataCenters-16-320.jpg)


![To achieve the greatest possible energy savings in
a data center, it is best to begin with an examina-
tion of the native loads. The following quotation
from Natural Capitalism explains why. This report
is organized to follow the compounding savings
from these native loads “upstream” toward
the power source. As Natural Capitalism states:
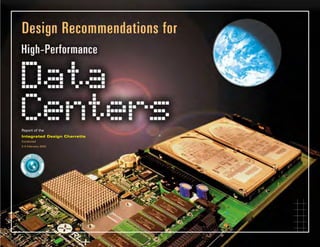
TO LEAP FORWARD, THINK BACKWARD: Much of the
art of engineering for advanced resource efficiency involves
harnessing helpful interactions between specific measures so
that, like loaves and fishes, the savings keep on multiplying.
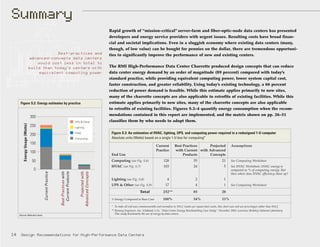
The most basic way to do this is to “think backward,” from
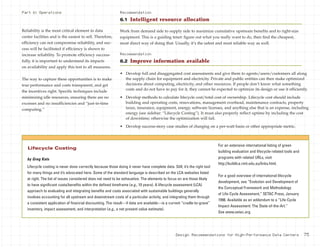
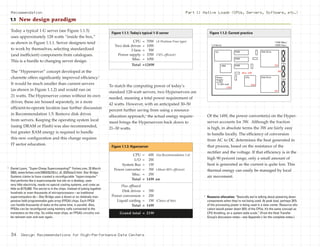
downstream to upstream in a system. A typical industrial
pumping system, for example, contains so many compound-
ing losses that about a hundred units of fossil fuel at a typical
power station will deliver enough electricity to the controls
and motor to deliver enough torque to the pump to deliver
only ten units of flow out of the pipe—a loss factor of
about ten-fold.
But turn those ten-to-one compounding losses around back-
ward…and they generate a one-to-ten compounding saving.
That is, saving one unit of energy furthest downstream (such
as by reducing flow or friction in pipes) avoids enough com-
pounding losses from power plant to end use to save about
ten units of fuel, cost, and pollution back at the power plant.
Those compounding savings represent significant economic
and environmental leverage... [enabling] each successive
component, as you go back upstream, to become smaller,
simpler, and cheaper. This in turn means that downstream
savings merit the greatest emphasis. The reason is simple.
In a chain of successive improvements, all the savings will
multiply, so they appear all to have equal arithmetic impor-
tance. However, the economic importance of an energy-saving
measure will depend on its position in the chain. Savings
furthest downstream will have the greatest leverage in
making the upstream equipment smaller, and this saves not
just energy but also capital cost. Downstream savings should
therefore be done first in order to save the most money.
Downstream-to-upstream thinking is thus a special case of
a more general rule: Do the right things in the right order.
For example, if you’re going to retrofit your lights and your
air conditioner, do the lights first so you can make the air
conditioner smaller. If you did the opposite, you’d pay for
more cooling capacity than you’d need after the lighting
retrofit, and you’d also make the air conditioner less efficient
because it would either run at part-load or cycle on and off
too much…Once you’ve done the right things in the right
order, so as to maximize their favorable interactions, you’ll
have very little energy use left: Successive steps will have
nibbled away at it a piece at a time, with each improvement
saving part of what’s left after the previous steps.
The arithmetic of these multiplying terms is powerful.”2
Part 1: Native Loads1
(CPUs, Servers, Software, etc.)
Design Recommendations for High-Performance Data Centers 33
Fuelinput=100
70%Powerplantlosses
9%Transmissionanddistributionlosses
10% Motor losses
2% Drivetrain losses
25% Pump losses
33% Throttle losses
20% Pipe losses
9.5 Units of energy output
Source: E SOURCE. Drivepower Technology Atlas (www.esource.com).
1
Native loads are those loads that carry out the critical functioning
of a system, as opposed to ancillary equipment that supports those
loads by providing such services as cooling or power conditioning.
In the case of a data center, native loads include the computers and
telecommunications equipment that provide services to customers.
2
From Natural Capitalism.](https://image.slidesharecdn.com/f244087a-ca6d-4a72-bd99-8446dc9f2061-150525100216-lva1-app6892/85/E03-08_HighPerformanceDataCenters-33-320.jpg)


![44 Design Recommendations for High-Performance Data Centers
the data center is paying dearly for the inefficiency
of power supplies used in typical servers. This
cost is passed through to data center customers,
so owners and operators do not see the need to
care about inefficiency. Since server purchasers
seldom consider the economic benefits of power
supply efficiency, power supplies are being
designed using the wrong criteria.
If server purchasers were charged directly for the
power and cooling loads they create, they would
demand more efficient units from the manufactur-
ers. Once server manufacturers learn that every
watt saved is worth not pennies but many dollars,
they will begin buying, integrating, and selling
more efficient devices.
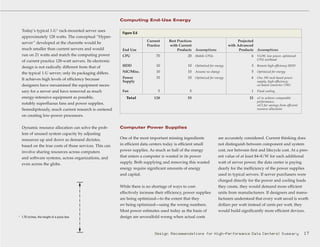
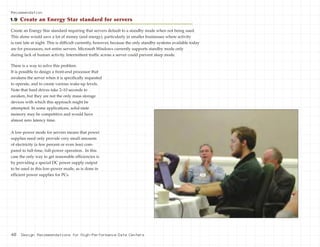
Recommendation 2.2 (continued): Create clear connections between power supply design, system efficiency, and power cost,
with incentives to support efficient solutions
by Neil Rasmussen
A significant part of no-load losses can be eliminated without adding cost, weight, or size. They are a result
of inattention to the design. Some circuits simply waste power for no reason. I have eliminated losses from
existing production designs with no negative effect. When original designers are confronted, they invariably
say, “I could have eliminated that loss but there was no reason to.”
But after the “free” loss reduction, cost and size increases will start to occur. Making copper traces4
and
wires larger on printed circuit boards and coils takes up valuable space. Adding additional capacitors to
reduce capacitor heating increases cost and size. Designing low-loss current and voltage snubber circuits, or
circuits that recover energy that might otherwise be wasted, increases cost and size.
A detailed analysis could provide good cost data on light-load efficiency. One simple method for estimating
the result, however, is to examine the variations between standard production power supplies. Assuming that
the mean value from survey data is the average and that the best light-load efficiency supply is achieved
with a reasonable design, then the best compared to the average is probably a good [minimum] estimate of
what is available for free. If you are willing to spend $1 per watt beyond that, in my engineering judgment,
you could reduce the loss by 30% without difficulty. [The whole-system lifecycle value of saving a watt can be
$10–20/W. —Ed.]
Size, Weight, and Cost
4
See “Tradeoffs between Copper and Core Loss,” p. 46.](https://image.slidesharecdn.com/f244087a-ca6d-4a72-bd99-8446dc9f2061-150525100216-lva1-app6892/85/E03-08_HighPerformanceDataCenters-44-320.jpg)


![Dick Bourne: I just did a little calculation. If you’re willing to accept that a seven-[ºF-]degree temperature rise is
reasonable for water going through one of these racks, then one gallon per minute will cool a kW. That means
11 GPM to cool an 11 kW rack. That’s not a very large water flow, and it probably can be warmish water.
Ken Brill: There’s no free lunch. If energy density continues going up, we’re going to have to embrace some
things. Liquid cooling is coming. If we’re headed to 400 watts a square foot, [then] instantaneous, uninterrupted
cooling systems will be essential because one temperature excursion can destroy a room’s worth of equipment.
That has not happened yet, but when it does and a customer has to write out a check for $15 million for new
computer equipment, this change will occur. We are in an industry that reacts to things.
David Schirmacher: I think you can get past reluctance to water. Obviously, IT people are inherently concerned
about water in their data centers. The real problem is that there are ideas coming from all over the place. If you
come up with a water-based or fluid-based solution that people believe is the future, and you can document the
benefits of it, and include steps that mitigate risks, then maybe you can push this idea through. These solutions
are very expensive, and they are usually short-lived solutions. Consistency is the limiting factor.
Ron Perkins: Maybe we ought to get out of this little box. When the cooling load exceeds fourteen watts a
square foot, don’t cool it, get rid of it. Remove most of the heat—three-quarters of it—with once-through air and
throw it out the stack. After that, providing enough spot cooling to satisfy the rack plus a really efficient exhaust
fan eliminate the need for all the little fans. This strategy requires a high ceiling space so that the hot air can
move away from the machine, stratify, and be easily removed. This would be much cheaper than trying to cool
400 watts of thermal energy per square foot.
Panel Comments on Cooling
48 Design Recommendations for High-Performance Data Centers
Customers of collocation data centers tend to
use compact rack servers in order to reduce
costs for rented floor area. In these flat built
rack servers, electricity to drive fans for heat
evacuation becomes more important, e.g. 25%
of the power consumption of the server.
This higher percentage of power consumption
for fans of the rack-optimized server is due to
the flat and compact construction of the
device with only small air ducts. Operators of
managed data centers could think about using
water for heat evacuation. Indeed, with
increasing power density of processors,
manufacturers of servers and racks envisage
direct water-cooling. A leading rack producer
has developed a bus system for cooling water,
which feeds coolers of different processors
(Reference: Wasserkühlung für Server.
Magazin für Computertechnik, www.heise.de/ct,
October 2002). With this direct water-cooling
system it is possible to dissipate much more
heat with less auxiliary transport energy than
by air ventilation. But using water in an elec-
tronic system is critical in terms of security, and
therefore will be avoided as long as possible.
Source: Energy- and Eco-Efficiency of Data Centres: A
study commissioned by DIAE1 / ScanE2 of the Canton of
Geneva, by B. Aebischer et al., 5 January 2003, p. 36.
See Appendix S.
Water Cooling Developments
Part 3: Next Generation Cooling
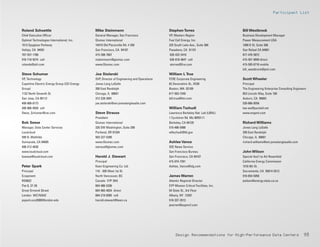
Airless cooling (liquid) systems offer the potential to place racks back to
back, and thereby utilize a single wall system for cooling.
Alternating the hot and cold aisles thus becomes unnecessary;
heat is removed via the liquid, not by airflow.](https://image.slidesharecdn.com/f244087a-ca6d-4a72-bd99-8446dc9f2061-150525100216-lva1-app6892/85/E03-08_HighPerformanceDataCenters-48-320.jpg)


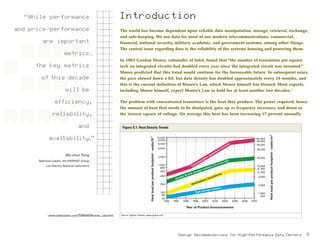
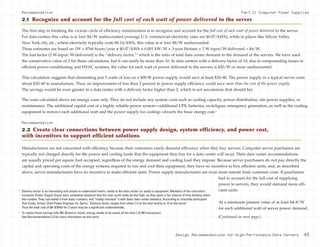
![Recommendation
4a.1 Increase the temperature
range of cooling air
Systems that boost air temperature differentials
increase cooling system efficiency. Instead of oper-
ating data centers in the historically mandated
55–75˚F-range, a 70–90˚F range is reasonable using
new technology. This significantly lowers the
power draw for cooling and increases overall effi-
ciency. In cool and/or dry climates, economizer1
operating hours and effectiveness would improve
greatly at these higher operating temperatures.
Because data centers require less latent cooling
than office space, economizer cooling should also
be attractive in a wider range of climates and for
more hours of the year than for offices. Higher air
temperatures would increase economizer poten-
tial even further.
Approximately 80 percent of all computer rooms
are small installations that occupy ~200–1,000 sq.
ft. Typically these small spaces are served by
overhead HVAC systems. As we have previously
learned, equipment failure rates are three times
higher at the top of a rack than at the bottom
because that’s where the heat collects. Improving
the management of airflow in these rooms can
reduce this concentration of heat and make it
possible to raise the supply air temperature—
possibly from the 55–75ºF range to 70–90ºF—
thereby improving efficiency and increasing
the opportunities for economizer operations.
Improving airflow through the equipment racks
Part 4: Cooling
1
An [air-side] economizer is simply an airflow control scheme that
detects those times when it is more efficient to use ambient (outside)
air directly to cool the space rather than using HVAC equipment. This
requires an ambient air temperature or enthalpy sensor and control
logic to decide if the ambient air is cool and/or dry enough to provide
useful cooling, and then increasing the makeup ventilation air flow
rate to deliver this cool air to the space.
Part 4a: Low-Energy Ventilation and Cooling
90ºF
90ºF
90ºF
70ºF
PLAN
90ºF
70ºF
Figure 4a.2.1
Recommendation
4a.2 Manage airflow to reduce energy required for cooling
and ventilation
Overhead ducted supply & return
(return could be plenum)
52 Design Recommendations for High-Performance Data Centers](https://image.slidesharecdn.com/f244087a-ca6d-4a72-bd99-8446dc9f2061-150525100216-lva1-app6892/85/E03-08_HighPerformanceDataCenters-52-320.jpg)


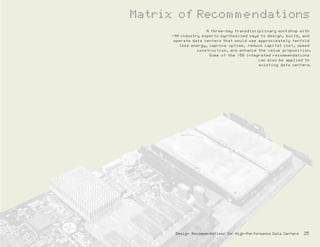
![Natural ventilation is suitable for data centers located in dry climates—hot or cold. As shown in Figure 4a.5.1, raising the building off the ground allows “ground”
cooling to occur. Hot and cold aisles (managed airflow), combined with tall solar- and/or wind-driven chimneys, create temperature differentials that, in turn,
create natural drafts that pull cool air into the system at ground level and exhaust hot air through stacks at the top of the building. Evaporative spray, as in
classical Persian draft towers, could provide supplemental cooling when natural temperature conditions aren’t sufficient to create a differential. In very humid
or hot and/or hot-and-humid climates, additional mechanical cooling might be necessary.
Recommendation
4a.6 Demand-controlled
ventilation
Typically, data center ventilation systems are
designed, installed, and operated at a constant
rate 24x7. As a result, these systems frequently
introduce far-more-conditioned outside air than is
required. Except for command centers, few people
continuously occupy data center critical space.
Excessive ventilation imposes an additional cool-
ing load on data center spaces during hot, humid
weather, and can displace pre-conditioned air
during the winter months (in colder climates)
with drier air requiring additional humidification.
Therefore, evaluating and minimizing ventilation
rates can produce big dividends in efficiency.
Ventilation systems can run at very low rates
[0.1–0.5 ACH6
] and be triggered to increase when
elevated carbon dioxide (more occupants/respira-
tion) or VOC (from IT refresh or other contami-
nants) levels are detected. It is important to main-
tain a slight “positive pressurization,” however, to
prevent air infiltration from adjacent areas.
56 Design Recommendations for High-Performance Data Centers
Ambient
Option evap
spray
Solar/wind
chimney
Plant option
in extreme
climates
Natural Approach C
S
SW
SE
Cool incoming air
by landscaping
Figure 4a.5.1: Natural ventilation
Figure 4a.5.2
Source: Battle McCarthy
6
ACH: air changes per hour.
Recommendation
4a.5 Natural ventilation
Part 4a: Low-Energy Ventilation and Cooling](https://image.slidesharecdn.com/f244087a-ca6d-4a72-bd99-8446dc9f2061-150525100216-lva1-app6892/85/E03-08_HighPerformanceDataCenters-56-320.jpg)


![Desiccant cooling dries the air, then humidity is
added through evaporative cooling. It is applica-
ble only to new designs, not retrofits. A disadvan-
tage is that some excess heat is transferred into
the incoming air. However the phase change of
the water in the evaporative step can compensate
for this. Efficiency assumptions: fan 78 percent;
motor 94 percent = 0.24 kW/ton.
Recommendation
4b.8 Thermal storage
Thermal storage is recommended only when all
other methods have failed to provide the desired
and required load reductions. Its use applies pre-
dominantly to facilities larger than 10,000 sq. ft.
Water storage is preferred over ice because water
is simpler, cheaper, and more reliable, although
it requires more space. Use multiple tanks for
system redundancy and emergency backup cool-
ing potential.
Thermal storage could be linked to wet free cool-
ing systems such as nighttime evaporative heat
removal, bore holes, cooling towers, thermal
ground or foundation coupling, and winter intake
air path heat exchangers.
• More efficient coils and fans.
• Substitute polypropylene for PVC fill in
cooling towers.
• Efficient counterflow cooling towers.
• More efficient pumps: the challenge is to get
combinations of efficient pumps (84 percent)
and motors (95 percent). The barrier isn’t the
technology; it’s the failure to recognize and
integrate the technology available.
• Controls that work: controls consistently fail
to function as sensors drift out of calibration.
Air conditioning manufacturers are starting
to use better sensors. Presently the problem is
that data center customers don’t commission
for efficiency/calibration (see Recommend-
ation 6.8).
• More accurate and stable humidity sensors.
Recommendation
4b.7 Dessicant cooling
Recommendation
4b.9 Wish list for manufacturers
The above suggestions will yield the following
percentage savings in cooling energy, using
1.4 kW/ton as the base case (air-cooled unitary
CRACs):
• Water cooling the unitary equipment yields
a 35% reduction in cooling energy demand;
• Chilled water system with water-cooled
screw chillers between 60 and 200 tons=40%
(Centrifugal chillers are the best but are more
expensive, screw chillers next-best and lower
cost, reciprocating compressors last choice but
still water-cooled.);
• Chilled water systems with centrifugal
chillers greater than 200 tons save 51%;
• Cogen. on the cooling side only saves 81%
[absorption chillers];
• Desiccant cooling = 83%;
• Dry cooler glycol/water saves 85%;
• Cold climate: outside air economizer with
heat recovery saves 89%;
• Water-side economizer of the chilled water
system saves 90%;
• Earth-coupled direct water saves 91%.
60 Design Recommendations for High-Performance Data Centers](https://image.slidesharecdn.com/f244087a-ca6d-4a72-bd99-8446dc9f2061-150525100216-lva1-app6892/85/E03-08_HighPerformanceDataCenters-60-320.jpg)


![There are more complete ways to measure availability and reliability.2
Availability depends on both the frequency and the duration of failures:
Availability (A) = 1 – MTTR/MTBF, where MTTR = mean time to repair (duration of outage) = 1/r (r = rate of repair)
and MTBF = mean time between failures = 1/r + 1/f (f = rate of failure).
Therefore, A = 1 – f / (f + r) = r / (f + r), and Reliability (R) = 1 – probability of failure = exp(–ft), assuming the failure rate f is constant.
For example, if r = 1/12 hours and f = 1/ 20 years, then R over one year is exp (–0.05) = 95% (5% chance of a failure during one year);
R over 10 years is exp (-0.5) = 60% (40% chance of a failure during 10 years); and A = 1/12 / {1/12 + (1 / [20 * 8766])} = 0.99993 (4.5 “nines”).
In data centers, the duration of a power outage (1/r) might be very short but still cause intolerable losses in terms of data and business.
In other words, the MTTR for the data center could be much longer than the MTTR of the power supply. This suggests that the rate of failure or MTBF
could be far more important to data center performance than the power supply availability or the duration of outages.
Other metrics and indices are employed to characterize electric service reliability from a utility perspective, addressing frequency, duration, or extent of outages.
The indices use customer interruptions, the sum of all customers experiencing all interruptions (customers with multiple events get counted each time)
and customer minutes (the total of the product of customers interrupted times the duration of each interruption for all events). The most common indices in
use are the system-wide average indices SAIDI, SAIFI, CAIDI, and CAIFI, all summarized in Figure 5b.3
The key for data centers is ensuring that even very
brief interruptions are counted and minimized.
Part 5: Facility Power Supply
2
See Allen, Whit, “Championing Power Quality and Reliability,”
Energy User News, December 2002.
See www.energyusernews.com/CDA/ArticleInformation/features/
BNP__Features__Item/0,2584,88122,00.html.
3
A thorough discussion of these indices can be found in Billinton &
Allan (1996). A good discussion of their relationship (or lack of it) for
DG planning is presented in Willis & Scott (2000).
Average Interruption Time Cumulative 24 Interrupted
Availability per Year Hours Every
0.99 (2 nines) 3 days, 15 hours, 36 minutes 98 days
0.999 (3 nines) 8 hours, 46 minutes 2.7 years
0.9999 (4 nines) 53 minutes 27 years
0.99999 (5 nines) 5 minutes 274 years
0.999999 (6 nines) 32 seconds 2,740 years
0.9999999 (7 nines) 3 seconds 27,400 years
Figure 5a: Industry standard “nines”—a common but inappropriate measure of availability
Design Recommendations for High-Performance Data Centers 65](https://image.slidesharecdn.com/f244087a-ca6d-4a72-bd99-8446dc9f2061-150525100216-lva1-app6892/85/E03-08_HighPerformanceDataCenters-65-320.jpg)